• Тип индикатора
  • Цена
     - 
  • Сбросить
Смотри обучающее видео по маркету на YouTube
Как купить торгового робота или индикатор
Запусти робота на
виртуальном хостинге
Протестируй индикатор/робота перед покупкой
Хочешь зарабатывать в Маркете?
Как подать продукт, чтобы его покупали

Технические индикаторы для MetaTrader 5 - 31

icon На основании сигналов технических индикаторов принимаются решения относительно открытия или закрытия сделки на фондовом и форекс-рынках. Суть индикаторов заключается в математическом преобразовании цены и/или объемов финансового инструмента для прогнозирования изменений цен в будущем. Протестируйте технические индикаторы, чтобы лучше предсказывать поведение рынка и зарабатывать на этом.
Screen Shoter
Andrey Khatimlianskii
4.33 (3)
Индикатор для "скриншотирования" графика с заданным интервалом. Файлы сохраняются в директорию " MQL5\Files\ScreenShots\Symbol TF\ " и именуются датой и временем съемки ( 2017.06.20 23.56.24.png ) Настраивается: Width и Height — ширина и высота сохраняемых скриншотов, IntervalSeconds — интервал сохранения в секундах. Внимание ! Если поставить большой размер скриншотов и высокую частоту съемки, может закончиться место на жестком диске. Не удаляйте папку, в которую пишутся скриншоты, индикатор смо
FREE
This indicator saves the chart as a template when you change the symbol. It also loads the template from the new symbol. Therefore you are able to save all objects that you have drawn on the chart. It is an addition to the Watchlist Indicator. How to use it: - Pull the indicator to the chart - The first parameter defines which timeframes are saved into one file. An example: If you do not want to see a drawn object (e.g. line) from D1 in M1 you need to specify the timeframes. - The default v
FREE
CT Omni Channel
Kei Charles Daniel
3 (1)
Critical Trading, Omni-Channel This indicator lets you create a unique channel from a base type and a range type. Channels are great for spotting over-extensions or the start of new trends. With an ever changing market it is important to create your own edge in the market that no one else has. Let Omni-Channel add to your unique trading strategy. Please contact criticaltrading@outlook.com for more info or advice on adding any other functionality.
FREE
Support Resistance View draws horizontal lines in the current chart that define in real time the values of Supports/Resistances for the timeframe tha you choose. Inputs: Lines color: color of the lines. Timeframe: timeframe for calculations. Support and Resistance are values at which the currency usually inverts the trend or have a breakthrought, so you can use this values to define a strategy for trading.
RickTradeShow Path
Ricardo Rodrigues Dias De Lima
Produto Teste para testar chaves e validações. Ao instalar entre em contato. Mais informações entrar comunicação Instalando por favor revisar os testes querendo mais informações leia as instruções podendo estar errado entrar em contato Espero que este indicador auxilie nos trades dos usuários. O indicador será avaliado em outras metodologias para melhor atender
FREE
MultiPlatformA
Mikhail Savenkov
5 (1)
Мультивалютный индикатор в отдельном окне отображает движение валютных пар в пунктах с расхождением от начала дня. Во время работы, динамически возможно включать и отключать различные пары прямо на графике. При первом запуске, возможно, потребуется продолжительное время, пока загрузиться история для основных валютных пар. Для валют CAD, CHF, JPY - график перевернут. При повторном открытии, все настройки индикатора восстанавливаются автоматически.
FREE
Простейший индикатор для ручной торговли. Для комфортной торговли так же имеется эксперт https://www.mql5.com/ru/market/product/41133 Суть идикатора: уровни строяться на основе Moving Average с выбранным периодом по ценам High и Low. На разнице между High и Low строятся следующие уровни выше и ниже. В случае если бар не выходит за уровни, помечается зеленой меткой. Данную метку и уровни можно использовать для выставления отложенных ордеров когда цена на долго застревает между уровнями. Входны
FREE
White Crow Indicator by VArmadA A simple yet powerful  candle analysis based indicator using the White Soldiers & Crow patterns. Works with timeframes 1H and higher and tested on all major pairs. Pay attention to the signal: An arrow indicating a long or short entry. How It Works: Arrows indicate a ongoing trend. After multiple bullish or bearish candles in a row the chances for another candle towards that trend is higher. Instructions: - Crow Count: Set the number of candles that ne
FREE
JCStatistics 简繁数据统计 1.显示账户信息:内容显示 交易员、账号、本金、杠杆、保证金、保证金比例、余额、净值; 日周月开盘余额、持仓收益、日收益、周收益、月收益; 收益为正时显示红色字体,收益为负时显示绿色字体; 日收益低于-5%时显示CircuitBreak; 总收益低于-10%时显示MarginCall; 2.显示统计数据: 收益(收益率)(交易量)(胜率) 5日数据;4周数据;12月数据; 3.当前标的统计:Symbol()收益(交易量)(胜率) 4.主流标的统计:收益(交易量)(胜率) 可以选择性显示账户信息、数据信息,调整显示颜色,调整字体,调整字体大小。 指标删除后自动删除桌面文字及背景。 备注:如遇使用问题,请联系邮箱:16692618587@qq.com.
FREE
Exclusive Stairs это трендовый индикатор для платформы MT5. В основе алгоритма его работы лежат скользящие средние, работающие в обработке специальных фильтров и методов сглаживания цены. Что позволяет Exclusive Stairs давать сигналы намного раньше, чем обычные Moving Average. Данный индикатор подходит как для скальперов, если использовать его на более мелких таймфреймах, так и для трейдеров, которые готовы ждать хорошей и точной сделки пару дней. Версия  Exclusive Stairs   для терминала MetaTra
RCCMA — это общий индикатор скользящих средних, работающий с индикатором ReviewCandleChart. Оригиналом является индикатор Custom Moving Average от компании MetaQuotes Software Corp. На основе этого когда я создал соответствующий индикатор для ReviewCandleChart . Преимущества Когда индикатор ReviewCandleChart включен, справа от вертикальной линии индикатора никакие линии отображаться не будут. Когда индикатор ReviewCandleChart включен, нажатием клавиши, например Z или X, вы можете нарисовать ск
FREE
Indicador Volatilidade Histórica Indicador é um oscilador que faz o plot da volatilidade histórica de um ativo, representado pelas fórmulas: Volatilidade Histórica = Raiz quadrada da média das diferenças ao quadrado * Fator de anualização. Média das diferenças ao quadrado = soma de todas as diferenças de retorno diário / número total das diferenças. Retorno diário = (preço atual - preço anterior) / preço anterior. Nesse indicador estamos utilizando os preços de fechamento de cada barra e fazemos
FREE
Wolf Countdown
Tiziano Zambelli Sopalu
5 (1)
Wolf Countdown helps you not to waste the right amount of time, it gives you back the time remaining until the candle closes. How to use: Download and install the  Wolf Countdown Indicator on your MetaTrader 5. Apply the indicator to your favorite chart. this works on any timeframe... Thanks to this indicator you will never miss the right moment to enter your trades.
FREE
1. Why did I develop this series of indicators I found that most traders need to use multiple time frame indicators. They usually switch time frame to see indicators. However, once the timeframe is switched, you cannot see the  corresponding relationship  between  the price in the smaller timeframe  and  the indicator in the larger timeframe . For example: if your price chart is in H1 timeframe, you can see H4, D1 and W1 indicators in H1 timeframe Chart. This is more helpful for you to find t
FREE
Moving Ratio
Ricardo Rodrigues Lucca
"Moving Ratio Candle" is used to check the distance of a candle to a theoretical pressure point. Furthermore, we have two points of interest, the first for the mean and the second for the median. This indicator uses the shape of bars and the line that crosses the bar from left to right is based on the calculation of the closing price for both sides. The rest follows a more standard calculation. The same could be done as a line, but I want to know the behavior of this indicator in relation to the
FREE
Пользовательский индикатор Bollinger Bands Height - высота полос Bollinger Bands. Показывает текущее состояние индикатора Bollinger Bands: полосы удаляются друг от друга или  полосы начинают сближаться. Сжатие - сближение полос, означает, что  текущий движение рынка ослабевает  и указывает на скорое начало нового сильного движения. Значит нужно искать удачный момент для входа в позицию, так как можно ожидать резкое изменение цены. Наиболее эффективен в работе с другими трендовыми индикатор
FREE
Dynamic Theoretical Stop Histogram indicator that dynamically analyzes the theoretical Stop levels in real time. Operation : The DTS - Dynamic Theoretical Stop does a mapping of fractals in previous candles and suggests two levels of Stop: For purchase and for sale. Suggested reading : It is necessary to make the definition of Maximum Stop in points in the Trading Plan. In this way, the trader can decide the best entry point by analyzing the theoretical stop levels: Stop for sales: S
FREE
Analyze potential   Covered Call   structures in the Brazilian market. Define where you want the break-even of your structure and see what structure to use. It works for any asset that has authorized series of options on B3 (Brazilian Stock Exchange). Associate the indicator to the asset you want to set up the Covered Call. *** ATENTION *** For the robot to work, the service that consults the authorized series of B3 options must be running on your terminal. Download the utility for free from
FREE
High and Low The indicator marks bars with a simple trend definition“ each subsequent high above/below the previous one and each subsequent low above/below the previous one ”. Charles Dow Formula:  Max – The current maximum Min – The current   minimum MaxK – Maximum per period MinK – Minimum per period Min>MinK & Max>=MaxK – Symbol on top Max<MaxK & Min<=MinK – The symbol on the bottom Input parameter: Number of bars in the calculated history Period for current timeframe The distance
FREE
This indicator can be used to study the repeating daily volatility structure, and also find deviations from the historical means.  Black line tells the average volatility of current hour from last 30 days. Blue bands tell the confidence interval (2 times standard deviation). Red line tells the current volatility, ATR. Inputs:  - days: the number of days where to calculate the average volatility - atrp: the ATR period used to measure volatility
FREE
This incicator shows you when a pin bar is formed, and aid you perform a inversion strategy or a trend continuation based on resistence support and or channel. Typically a pin bar shows you a price rejection from the market and the signal most of time is profitable. So i suggest to use buy/sell limit order over ratrace SL little bit over or below bar and take profit based on your strategy and money management. Best timeframe are D H4 H1
Индикатор RSI magic kjuta5 . Пользовательский   Индикатор ( RSI magic kjuta ) на основе стандартного Индикатора Силы ( Relative Strength Index, RSI ) с дополнительными настройками и функциями. К стандартной линии RSI добавлены линии максимального и минимального значения RSI на графике. Теперь можно визуально наблюдать прошедшие максимумы и минимумы RSI , а не только значения по закрытию баров, что позволяет избежать путаницы   при анализе торгов. Например, советник открыл или закрыл ордер, но
Индикатор Time And Sales Layout показывает проторгованные объемы покупок и продаж прямо на графике. Он предлагает графическое представление хорошо известной таблице (ленте) сделок "time and sales". Индикатор скачивает и обрабатывает историю реальных тиков. В зависимости от выбранной глубины истории процесс может занять ощутимое время. Во время обработки выводится комментарий с процентом выполнения. Когда история обработана, индикатор начинает анализировать тики в реальном времени. Последний бар
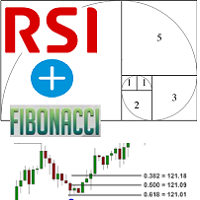
Fibonacci and RSI. The indicator is a combination of the Fibonacci and RSI indicators. Every time the price touches one of the fibonacci levels and the rsi condition is met, an audible alert and a text alert are generated. Parameters number_of_candles : It is the number of candles that will be calculated. If you put 100, the indicator will give you the maximum and minimum of the last 100 candles. sound_signal:   If you want the indicator to notify you that the conditions are met using
Переработка стандартного ADX для получения более понятных и эффективных торговых сигналов. Индикатор вычисляет ADX по стандартным формулам, но исключает операцию взятия модуля от значений ADX, которая по какой-то причине искусственно добавлена в ADX. Другими словами, индикатор сохраняет исходный знак значений ADX, что делает их более точными, простыми для использования и более ранними по сравнению со стандартным ADX. Строго говоря, любое преобразование вроде взятия модуля уничтожает часть информ
O indicador é uma ferramenta desenvolvida para o MetaTrader, projetada para auxiliar na análise detalhada do comportamento do preço em relação a uma média móvel específica. Ao ser anexado ao timeframe diário, o ele realiza cálculos e monitora, em timeframes menores, quantas vezes o preço toca determinados níveis de afastamento durante o dias além de calcular a média dos toques. MT4:  https://www.mql5.com/pt/market/product/111706
FREE
(Google Переводчик) Этот индикатор был вдохновлен средним истинным диапазоном (ATR) Джона Уэллса Уайлдера , но с некоторой дополнительной информацией. Точно так же он вычисляет экспоненциальное скользящее среднее истинного диапазона, но использует стандартный альфа-вес вместо Уайлдера . Он также вычисляет среднее отклонение от среднего диапазона и отображает его как смещение. Это помогает не только быстрее определить изменение, но и его влияние. (Original text) This indicator was inspired by Joh
FREE
Индикатор теней. Отображает размер теней свечей, в пунктах, в виде гистограммы. Работает в двух режимах, на выбор пользователя. Описание настроек индикатора Mode - режимы работы индикатора, два режима: первый height - режим отображения верхних и нижних теней свечей; второй difference - режим отображения разницы теней свечей, разница между верхней и нижней тенью свечи.
FREE
Технический индикатор "Линии Боллинджера" (BB) подобен конвертам. Единственная разница между ними в том, что линии конверта строятся на фиксированном расстоянии (%) от скользящей средней, в то время как линии Боллинджера строятся на расстоянии определенного числа стандартных отклонений от нее. Стандартное отклонение это мера волатильности, то есть линии Боллинджера изменяются в соответствии с условиями рынка. Линии расширяются, когда волатильность рынков увеличивается и сужаются, как только рынк
FREE
Gapless   Moving Average  (GMA) Improved version of   standard   Moving Average  (MA)   from MetaTrader library which provides the possibility to   eliminate the 'gaps' between candle sticks   which distort the average values mainly during the N ('period') initial candles after market opens due to the spread ('gap') between closing price from previous day and opening price from the next day. The greater these 'gaps' are, the more divergent the standard MA is in order to indicate the current p
FREE
//////////////////////////////////////////////////////////////////////////////////// Улучшенная версия стандартного индикатора Standard Deviation. Теперь это адаптивная и сглаженная линия. Настройка не совсем простая - но я надеюсь что вы справитесь. Понять показания этого индикатора очень просто, смысл такой же как и у обычного  Standard Deviation . ///////////////////////////////////////////////////////////////////////////////////// Надеюсь этот индикатор очень Вам пригодится в успе
FREE
MaxlotTomson
Vasilii Luchnikov
5 (2)
Добрый день.  Сегодня мы предлагаем индикатор  MaxlotTomson   для определения максимального объема, который вы можете выставить на покупку или продажу,  если смотреть на ваш уровень депозита. Данный индикатор удобно использовать для Новостной торговли, когда нужно определить точку входа на скоростном движении и рассчитать уровень риска в процентах от депозита, Индикатор  MaxlotTomson показывает максимальное значение объема ЛОТА для вашего депозита  который выы можете использовать для торговли.
FREE
*Used by MeditionSeed EA.  Meditation is a practice in which an individual uses a technique – such as mindfulness, or focusing the mind on a particular object, thought, or activity – to train attention and awareness, and achieve a mentally clear and emotionally calm and stable state.[1][2][3][4][web 1][web 2] Plant a Meditation Seed to have wonderful future.
FREE
Индикатор отображает изменение баланса В правом нижнем углу окна. Отображаются следующие периоды Сегодня  Вчера  3 дня  Неделя 10 дней  Месяц 3 месяца Полгода Год  Все время  Есть возможность выставить расчетное время. Удобно пользоваться для расчетов прибыли/убытков с определенного часа. Будет полезен например ночным скальперам. Данные совпадают с расчетами отчета в терминалее.
FREE
Weighted WCCI
Alexey Viktorov
4.67 (3)
Стратегия форекс «Гора» основана на одном довольно сложном индикаторе. С его помощью генерируются вполне неплохие сигналы и, в принципе, автор указывал возможность торговли и на остальных инструментах, однако, мы решили взять изначальный вариант — торговлю только по GBP/USD. Так же следует сказать, что по ходу развития тренда торговая стратегия пропускает большое количество неплохих точек входа, но это только на первый взгляд. Фильтрация сигналов показала себя достаточно неплохо и в итоге торгов
FREE
Индикатор окрашивает свечи графика в цвета, вычисленные из значений сил быков и медведей. Работает следующим образом:  Берутся значения двух индикаторов Bears и Bulls, сравнивается кто сильнее на свече. Это всё. .
FREE
NS Financas Indicador de Spread
Luiz Guilherme Neves Da Silva
4.33 (3)
Spread Indicator MT5 - NS Finanças. (http://www.nsfinancas.com.br) Auxiliary tool to give Spread visibility to all types of currency pairs and timeframes. The labels are well positioned in the upper right corner of the chart so as not to disturb the visualization during the trade, however it is also possible to drag the indicator to the best place on your screen. In addition to the current spread, this indicator also monitors the minimum, maximum and average spread of the selected currency pair
FREE
Indicator for fast navigation through financial instruments. When you click on the button, you go to the chart of the financial instrument, the name of which was written on the button. In other words, the indicator opens or unfolds an existing chart window. For each chart, you can customize the name of the financial instrument, text color and background color; in total, you can customize symbols buttons that you trade often. The indicator can be installed on any charts for which you need to swit
FREE
Mirrorized Moving Averages
Mahmoud Sabry Mohamed Youssef
5 (6)
I always wondered if I can have multiple time frame Moving average on same chart , it is not possible , now with my Indicator is possible , As you know Moving average is lagging not leading indicator , but how can I predict future levels of it ? I came with this idea , I hope you will like it , I made a Mirror of Moving average , the other side of specific time will be shown in the other side of the chart where the price didnt reach yet , that will help you to know the levels you can start sel
FREE
Индикатор, показывающий момент преодоления нулевой отметки индикатора MACD. Индикатор стрелочный и может быть использован для торговли бинарными опционами. Входные параметры Period of SMA1  - Период 1 скользящей средней Period of SMA2 -  Период 2 скользящей средней Period of SMA3 -  Период 3 скользящей средней Inform about finding the signal  - подавать уведомление, при нахождении сигнала
FREE
The Indicator assists in decision making along with the user's market reading. By drawing the trend, this indicator becomes very useful on days of high volatility in the market, that is, it offers strategic insights on days of economic data, news or pronouncements. On flat market days it becomes usual to identify possible market reversals. Follow Youtube to understand the most suitable scenarios for its use.
FREE
La idea de este indicador es la siguiente: reemplazar los precios High, Low del indicador SAR por los valores del indicador Moving Average. Al final tendremos la siguiente imagen: Es decir, el indicador SAR cambia su dirección después de tocar el indicador Moving Average. Parámetros de entrada SAR: Step   - parámetro "Step" del indicador SAR; SAR: Maximum   - parámetro "Maximum" del indicador SAR; MA: Period   - parámetro "período de promediación" del indicador MA; MA: Shift   - parámetro "d
FREE
DuettoFXTompson
Vasilii Luchnikov
4 (1)
Индикатор DuettoFXTompson  создан для работы с двумя  инструментами у которых высокий уровень корреляции, индикатор можно использовать  для парного трейдинга по валютам, акциям, и др. финансовым инструментам.  Индикатор показывает момент расхождения инструментов и  сумму двух инструментов ( желтая линия), дополнительно   рассчитывается параметр Среднего значения МА.  Рекомендуемый таймфрейм для работы М5.  Контакты для связи 777basil@mail.ru , приготовим эксперта, индикатор по вашему заданию.
FREE
Based on two MA line indicators. Looking at the histogram, if the value is greater than 0, the uptrend will increase, the bigger the value, the stronger the uptrend will be and vice versa, if the value is less than 0, the downtrend will decrease, the smaller the value, the stronger the downtrend . The necessary condition when entering a buy order is that the first histogram is greater than 0 and the current candle is closed, and enter the order when the second histogram appears. The necessary
FREE
Displays symbol tabs for easy access when trading, symbols that are coloured are symbols you have trades running on. The indicator immediately shows the specified currency pair in the open window after clicking it. You no longer need to open a new window to view each chart thanks to the indicator. Additionally, it enables traders to concentrate on their trading approach by just keeping a small number of charts displayed.  
FREE
TimePrice Free
Du Zhi Shan Tian
5 (2)
Display the date, time and price according to the movement of the mouse cursor on the chart This is useful for discretionary trading. It is an indispensable tool for verifying and studying past market prices and trades. Characteristic Date,Time and Price are displayed. The value follows the movement of the mouse. You can change the color of the text. Please refer to the video on youtube. For MT5 only.
FREE
If your strategy requires trading during a certain period of market activity - calm or turbulent, this indicator will help you find such periods of time within a week for each currency pair using statistics. The principle of the indicator is quite simple. The entire trading week, from Monday 00:00 to Friday 23:59, is divided into timeslots, the duration of which corresponds to the current timeframe. For each timeslot, activity is calculated - the average value of the difference between the
FREE
提供专业的EA编程服务,推出特色仪表盘EA编程,将您的交易策略自动化,可视化,一个图表管理多个交易货币对,详情查看: http://www.ex4gzs.com  Providing quick Developments and Conversion of MT4/MT5 EAs, Indicators, Scripts, and Tools. If you are looking for an Dashboard EA to turn your trading strategy into auto trading algo and to manage multi trades in one chart with visualizing tool, come and visit http://www.ex4gzs.com/en for more details. 如果产品有任何问题或者您需要在此产品上添加功能,请联系我 Contact/message me if you encounter any issue using the product or need extra featu
FREE
Track the historical outcome of your options operations on your favorite asset. It works for any asset in the spot market that has authorized option series on B3 (Brazilian stock exchange). Associate the robot with the asset you want to record and monitor its operation history and results. How to use the robot: 1. Enter historical data for your operations: Purchases and sales of the asset Purchases and sales of options on the asset Received dividends Cash inflows and outflows 2. Monitor the rea
FREE
*Used by MeditionSeed EA.  Meditation is a practice in which an individual uses a technique – such as mindfulness, or focusing the mind on a particular object, thought, or activity – to train attention and awareness, and achieve a mentally clear and emotionally calm and stable state.[1][2][3][4][web 1][web 2] Plant a Meditation Seed to have wonderful future.
FREE
Привет. Сегодня представляем индикатор корреляции -  SynchroWindowTomson. Индикатор в одном окне показывает движение нескольких инструментов, по отношению друг к другу, удобно определять направление и изменение, особенно когда вы работаете с целым портфелем разных инструментов и нужно определить какой из них тянет результат назад и движется в другую сторону. Так же видны точки разворота спреда.
FREE
Main purpose: This indicator calculates the average of previous candles (a half of candle points). This value represent the strength of market (buy/sell) in each candle. Parameters: . Period: indicating previous candles to calculate average . Shift: draw line at a shift on chart. Tip: We can use this value to consider TP and SL of a position before opening.
FREE
To download MT4 version please click here . This is the exact conversion from TradingView: "RSI versus SMA" By "JayRogers". This indicator lets you read the buffers for all Lines on chart.  Note: This is an indicator, Not an expert. Meaning It does not take trades. If you want the EA please contact via message. You can easily use the indicator to understand the logic behind trades that the TradingView strategy takes. The strategy is profitable if this indicator is applied to the right symbol at
FREE
Just learning how to create an indicator from this tutorial . its just a garbage text to fill the descriptions. Hello there. Hello there Hello there Hello there Hello there Hello there Hello there Hello there Hello there Hello there Hello there Hello there Hello there Hello there Hello there Hello there Hello there Hello there Hello there Hello there Hello there
FREE
//////////////////////////////////////////////////////////////////////////////////// Улучшенная версия стандартного индикатора Average True Range. Теперь это адаптивная и сглаженная линия. Настройка не совсем простая - но я надеюсь что вы справитесь. Понять показания этого индикатора очень просто, смысл такой же как и у стандартного Average True Range. ///////////////////////////////////////////////////////////////////////////////////// Надеюсь этот индикатор очень Вам пригодится в ус
FREE
Простой индикатор, показывающий цены Bid и Ask. Есть настройки отображения информации и возможность перетаскивать панель. Индикатор используется для наглядного отображения цен покупки и продажи актива. Входные параметры : Support - Ссылка, на помощь проекту heigth - Высота формы width - Ширина формы size - Размер текста bidcol - Цвет текста bid askcol - Цвет текста
FREE
Зачем нужен этот индикатор? Думаю вы замечали каким «хаотичным» может быть дви- жение цены. Бывают периоды, когда цена движется направле- но, почти без коррекций. В такие периоды трендовые страте- гии работают очень хорошо.  Но  как только направленное движение заканчивается, торговая стратегия перестаёт работать. Появляется очень  много ложных сигналов, что приводит к большому количеству отрицательных сделок.  Тогда возникла мысль: «А что если создать индикатор,  который смог бы заменить ценов
FREE
The Indicator indicator draws 2 clouds based on Envelopes indicator values. The upper cloud is formed by the upper lines values and the lower cloud by the lowers lines values. The indicator allows to change the Envelopes parameters and the clouds colors the period of the base line and the deviations of each Envelopes instance. The indicator holds 5 buffer index as follow: [0] - Outer values of the upper cloud [1]  - Inner values of the upper cloud [2]  - Base/Center line values [3]  - Inner valu
FREE
Оригинальный трендовый индикатор. Индикатор рисует в отдельном окне три линии, характеризующие текущую динамику цены. Может принимать значения от -1 до +1. Чем ближе значение индикатора к +1, тем сильнее восходящий тренд. Чем ближе к -1, тем сильнее нисходящий. Также может применяться в качестве осциллятора для определения перекупленности/перепроданности. Индикатор имеет один входной параметр Period, в котором указывается количество баров, используемых для расчета.
FREE
主要城市的时间。北京时间、东京时间、悉尼时间、惠灵顿时间、纽约时间、法兰克福时间、伦敦时间、迪拜时间。 城市时间可选择开启或者关闭。 点差变色提醒。设置点差提醒点数,例如,设置100点,点差大于100点,文字会变红色。 Time in major cities. Beijing time, Tokyo time, Sydney time, Wellington time, New York time, Frankfurt time, London time, Dubai time. City time can be turned on or off. Dot difference color change reminder. Set the point difference reminder points. For example, set 100 points. If the point difference is greater than 100 points, the text will turn red.
FREE
Не каждый сам может написать индикатор. Но у кого угодно может возникнуть идея. Реализовать её самостоятельно поможет индикатор Universal Main Window Free MT5 , принимающий в качестве входного параметра формулу, по которой и будет рисоваться линия индикатора. Данный индикатор предназначен для использования в основном окне графика. Все индикаторы серии Universal : В главном окне В дополнительном окне Бесплатные МТ4 Universal Main Window Free МТ5 Universal Main Window Free MT5 МТ4 Universal Se
FREE
Индикатор отображает график произвольного сочетания торговых инструментов, описываемого введенной арифметической формулой. Область применения индикатора весьма обширна и ограничивается только вашей фантазией: Использование индикатора для арбитража. Подбор сочетаний инструментов, торгующихся в определенном канале, для применения к ним сеточных стратегий. Исследование динамики вашего портфеля активов. Использование индикатора: Добавьте индикатор на любой график. Символ графика не обязательно долже
FREE
Equidistant bands indicator with calculated moving average, allows you to configure the band size and can be used freely as an entry / exit indicator. Buffer 0 = price, buffer 1 = upper band, buffer 2 = lower band. you can also configure the periods of moving averages used in the calculations and also the shift to previous bars in addition to the price that can CLOSE (default) or OPEN. Excellent for fast daily moving pairs and frequent returns.
FREE
*Used by MeditionSeed EA.  Meditation is a practice in which an individual uses a technique – such as mindfulness, or focusing the mind on a particular object, thought, or activity – to train attention and awareness, and achieve a mentally clear and emotionally calm and stable state.[1][2][3][4][web 1][web 2] Plant a Meditation Seed to have wonderful future.
FREE
Добрый день. Сегодня добавили вспомогательный индикатор тренда DveMashkiTompson, идея взята из аналога МТ4 и перенесена на МТ5, используется совместно с индикаторами Тренда ТМА и МА, рисует красные и зеленые области в зависимости от направления рынка. Тренд вверх -зеленые области, тренд вниз -красные.Области основываются на пересечении индикатора МА, таким образом данный индикатор дает информацию графического содержания для более быстрой оценки ситуации и принятия решения.
FREE
提供专业的EA编程服务,推出特色仪表盘EA编程,将您的交易策略自动化,可视化,一个图表管理多个交易货币对,详情查看: http://www.ex4gzs.com   Providing quick Developments and Conversion of MT4/MT5 EAs, Indicators, Scripts, and Tools. If you are looking for an Dashboard EA to turn your trading strategy into auto trading algo and to manage multi trades in one chart with visualizing tool, come and visit http://www.ex4gzs.com/en for more details. 如果产品有任何问题或者您需要在此产品上添加功能,请联系我 Contact/message me if you encounter any issue using the product or need extra feat
FREE
Индикатор имеет всего один параметр - это количество баров для анализа. Индикатор рассчитывает статистику, когда рынок шел вниз, когда наверх, количество баров для каждого движения. Из этих данных высчитывается средний показатель количества баров, который вырисовывается в окне индикатора. Если значения индикатора резко понижается, то рынок готовится к движению наверх. Если значения индикатора долго держится на высоких значениях, то рынок готовится к снижению.
FREE
Не каждый сам может написать индикатор. Но у кого угодно может возникнуть идея. Реализовать её самостоятельно поможет индикатор Universal Separate Window Free MT5 , принимающий в качестве входного параметра формулу, по которой и будет рисоваться линия индикатора. Данный индикатор предназначен для использования в дополнительном окне графика. Все индикаторы серии Universal : В главном окне В дополнительном окне Бесплатные МТ4 Universal Main Window Free МТ5 Universal Main Window Free MT5 МТ4 Un
FREE
MAPC
Pavel Gotkevitch
3.75 (4)
Индикатор MAPC (Moving Average Percent's Change) показывает процентное изменение скользящей средней от одного периода к другому выбранному периоду и позволяет отслеживать сглаженный темп изменения цены. Индикатор MAPC рассчитывается по формуле: MAPC[i] = 100 * (MA[i] - MA[i - n]) / MA[i],  где: MA[i] - текущее значение скользящей средней;   MA[i - n] - значение скользящей средней, отстоящей на n периодов от текущего значения скользящей средней. Входные настройки Period - период скользящей сред
FREE
Progress viewer
Sphelele Sphesihle Lubanyana
This indicator helps keep track of the number of trades taken in the day. It shows losses and potential profit then the total profits which is, profits - losses. Then total profit for the week and month. Soon the indicator will be sharing some trading tips based on your trading. It really does put necessary pressure and helps you to  set a goal for yourself for the day. Familiarise yourself to draw your analysis on the same chart with the indicator because it will have to alert you if price brok
FREE

MetaTrader Маркет позволяет максимально безопасно покупать программы для платформы MetaTrader. Вы можете скачать демо-версии понравившихся роботов и индикаторов прямо из терминала и проверить их в тестере стратегий.

Протестируйте программы в различных режимах перед покупкой для получения максимального представления о продукте и оплатите понравившийся продукт через платежную систему MQL5.community.

Платежная система MQL5.community обеспечивает оплату продавцам, а возможность тестирования программ в различных режимах позволяет покупателям получить максимальное представление о продукте.