Смотри обучающее видео по маркету на YouTube
Как купить торгового робота или индикатор
Запусти робота на
виртуальном хостинге
виртуальном хостинге
Протестируй индикатор/робота перед покупкой
Хочешь зарабатывать в Маркете?
Как подать продукт, чтобы его покупали
Новые технические индикаторы для MetaTrader 5 - 8
The TrendChannelTracker Indicator is an innovative Forex trading tool. This indicator, which is based on the standard Stochastic Oscillator, provides traders with a unique and simplified method for observing market trends. In contrast to the traditional Stochastic Oscillator, which is shown at the bottom of the chart, the TrendChannelTracker Indicator is built into the price action itself. This removes the need for traders to continually switch their attention between the oscillator and the pri
FREE

The BandsFill Indicator is a modified Bollinger Bands with a colored cloud. It has two adjustable parameters: Period Deviation The cloud is colored as follows: If the price crosses the upper band, the cloud is blue. If the price crosses the lower band, the cloud is pink. Thanks to this, the BandsFill Indicator provides traders with an easy opportunity to detect various features and patterns in price dynamics that are invisible to the naked eye. Based on this information, traders can predict
FREE

Я не хочу, чтобы вы загружали эту систему, надеясь на чудо. Несмотря на то, что этот инструмент хорошо спроектирован, его цель — стать частью настоящей трансформации вашей деятельности. Используйте по максимуму возможности, которые он предлагает, проводите анализ, развивайтесь как профессионал, думайте как крупный игрок.
В сфере информационной безопасности атака методом подбора пароля представляет собой систематический метод проб и ошибок для обнаружения паролей, учетных данных или криптографи
FREE

TW Trend Scalper Indicator:
TW Scalper Shoot предлагает вам уникальный опыт торговли, используя новейшие торговые стратегии и технологии искусственного интеллекта. Этот продукт соответствует разнообразным потребностям скальпирующих трейдеров, предоставляя две различные категории сигналов:
Проверьте этот исключительный продукт сегодня и начните свой уникальный опыт на пути к тому, чтобы стать трендовым скальпером.
Кроме того, получите продукт стоимостью 37 долларов в подарок.
Категории сигна
MENA TREND INDICATOR & SCANNER Комплексное решение для многотаймфреймового анализа трендов и торговли MENA TREND INDICATOR & SCANNER – это полноценный инструмент для трейдинга, разработанный для упрощения рыночного анализа за счет визуального и структурированного подхода к определению трендов и выполнению сделок. Он объединяет реальное выявление трендов, многотаймфреймовый анализ и отслеживание торговой статистики , что делает его гибким инструментом как для ручной, так и для автоматизированной

ATR Master – Мастер Волатильности на Графике! ATR Master – профессиональный индикатор ATR , который мгновенно отображает ключевые данные прямо на графике! Он помогает оценить диапазон движения цены, определить пройденное расстояние и оставшийся потенциал , а также контролировать таймер свечи и текущий спред. Почему трейдеры выбирают ATR Master? Анализ дневного ATR – видите средний диапазон движения цены за день, в скобках указывается сколько дней выбрано за период.
Пройденный ATR –
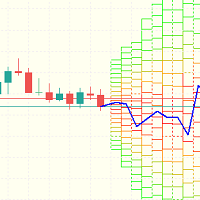
Индикатор использует брауновское движение и итерации Монте-Карло для вычисления вероятности движения цены в определённом направлении . Что показывает индикатор? С одной стороны, он рисует тепловую карту , которая делит область на три зоны в зависимости от вероятности достижения ценой определённых уровней: Красная зона : Вероятность более 50% . Оранжевая зона : Вероятность от 25% до 50% . Зелёная зона : Вероятность менее 25% . С другой стороны, он чертит синюю

Market Structure Indicator BOS CHOCH MT5
The Market Structure Indicator (BOS-CHOCH) is a specialized ICT-style tool designed for MetaTrader 5 (MT5) . This indicator detects both primary and secondary market character shifts (CHOCH) and breaks in structure (BOS) across multiple levels, offering valuable insights for ICT and Smart Money traders . By helping traders analyze price behavior, it enhances market structure recognition and provides more precise trade opportunities. «Indicator Installati
FREE
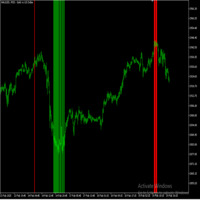
Reversal Radar – Технический индикатор для анализа разворота рынка Обзор
Reversal Radar — технический индикатор, разработанный для определения потенциальных поворотных точек на рынке. Он анализирует исторические данные о ценах, чтобы обнаружить значимые максимумы и минимумы, предоставляя визуальные сигналы, которые помогают трейдерам распознавать области, где может измениться рыночный импульс. Ключевые особенности Extreme Price Detection:
Определяет значимые максимумы и минимумы, которые могут

Market Session Asia EU USA – Визуализация глобальных торговых сессий на любом таймфрейме Market Session — это мощный индикатор для MetaTrader 5, который выделяет ключевые торговые сессии ( Азиатскую, Европейскую и Американскую ) прямо на графике. Он работает на всех таймфреймах , позволяя трейдерам быстро определять активность рынка и волатильность в разное время суток. Функции:
️ Отображает границы сессий Азии, Европы и США
️ Работает на всех таймфреймах для гибкого трейдинга
️ Помогает
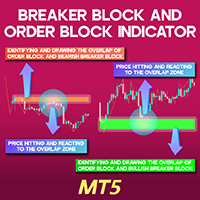
Breaker Block and Order Block Indicator for MT5
The Breaker Block and Order Block Indicator (BB+OB) is specifically developed for traders using ICT strategies to recognize key market zones. This tool employs a unique algorithm to detect intersections of Order Blocks and Breaker Blocks , highlighting them on the chart in green for bullish zones and brown for bearish zones on the MetaTrader 5 (MT5) platform. By utilizing this indicator, traders can improve their market entries and exits, refining
FREE
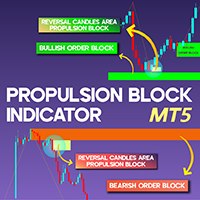
Propulsion Block Indicator for MT5
The Propulsion Block Indicator (ICT Propulsion Block) in MetaTrader 5 is an advanced analytical tool designed to detect price shifts and liquidity zones. These propulsion blocks emerge after the last candle revisits an order block, absorbing liquidity following notable price movements. This indicator pinpoints critical areas where order blocks intersect with Supply and Demand Zones , automatically updating the chart once the price enters one of these designate
FREE

Rejection Block Indicator and Void MT5
The Rejection Block Indicator is a powerful tool designed to detect market reversal zones in MetaTrader 5 . By analyzing candle wicks, this indicator marks crucial rejection block areas where long upper shadows near price highs and lower shadows near price lows act as potential reversal points. Additionally, the Void (absorbed portion) within the rejection blocks is highlighted in gray. Once this void is entirely filled, it signals that the level has lost
FREE
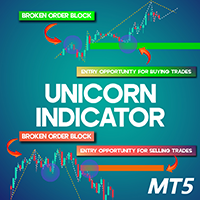
Unicorn Indicator MT5
The Unicorn Indicator is a sophisticated MetaTrader 5 tool designed to identify price gaps and highlight them using Breaker Blocks on the price chart. A Breaker Block represents an order block that initially gets broken but later acts as a strong support level when the price revisits it. A Unicorn zone emerges when a Breaker Block coincides with a Fair Value Gap (FVG). The indicator visually marks bullish Unicorn zones in green and bearish Unicorn zones in red, displaying
FREE
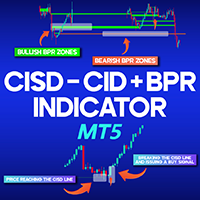
CISD-CSD & BPR Combined Indicator MT5
The CISD-CSD + BPR Combined Indicator is an advanced tool based on the ICT (Inner Circle Trader) trading style in MetaTrader 5. This indicator utilizes the three concepts of "CSD," "CISD," and "BPR" to identify specific zones on the chart and issue trading signals under appropriate conditions. The "CISD" concept comprises four elements: consolidation , impulse , fluctuation , and divergence . Typically, the price exits these zones with a rapid movement ( I
FREE
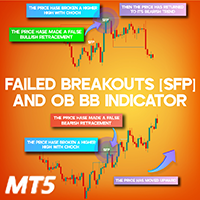
Swing Failure Pattern BB OB Indicator for MT5
The Swing Failure Pattern (SFP) indicator is a valuable tool in MetaTrader 5, designed to identify false breakouts and key market reversal points. This indicator provides a visual representation of significant price action events such as Break of Structure (BOS), Change of Character (CHoCH), and Fake Breakout (SFP). It is particularly useful for traders following price action strategies, ICT methodologies, and Smart Money trading concepts to pinpoin
FREE
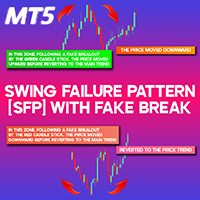
Swing Failure Pattern (SFP) with Fake Break Indicator for MT5
The Swing Failure Pattern (SFP) Indicator in MetaTrader 5 is designed to identify deceptive breakouts in financial markets. This pattern appears when the price momentarily surpasses key levels, such as previous highs or lows, triggering stop-loss orders and liquidity traps. However, instead of continuing in that direction, the price swiftly reverses, signaling a false breakout . The main function of the SFP pattern is to exploit liqu
FREE
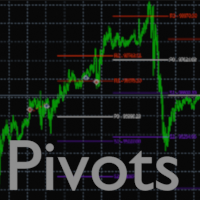
Pivots Points Indicator:
Displays the Pivots Points lines for the Daily, Weekly or Monthly periods
Several parameters are possible:
1 - Choice of calculation method:
- Classic
- Woodie
- Camarilla
- Fibonacci
2 - The choice of the period for calculating the pivot points ( Daily, Weekly or Monthly )
3 - The display or not of the price labels (to the right of each line) as well as the size of the associated font
4 - The number of pivot points (previous) that we want to display
5 - Po

Manyal trading system, CovEchoTrend Robot, focuses on reliability and flexibility. By employing statistical analysis methods to study the relationships between the base indicator and market patterns, the system enables a deeper understanding of market processes. Intelligent pattern analysis: The application of statistical data processing helps identify key trend reversal points more accurately, signaling significant market shifts. Informed decision-making is based on the intersection of indicato
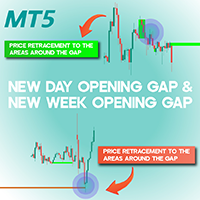
New Day Opening Gap and New Week Opening Gap NWOG NDOG MT5 The New Day and New Week Opening Gap (NDOG-NWOG) indicator is a powerful tool designed for traders using MetaTrader 5. It detects price gaps that emerge at the start of a new trading day or week and visually represents them on the chart. When the market reopens following a daily or weekly closure, the price often shifts from its prior closing level, leading to a gap. This indicator highlights weekly gaps (NWOG) in red and daily gaps (
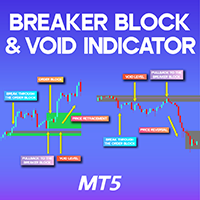
Breaker Block & Void Indicator MT5
A Breaker Block represents a price zone where the market revisits after breaching an Order Block . In simple terms, when the price pulls back to a previously broken order block, it forms a breaker block. The Breaker Block Indicator is designed to automatically detect these critical zones, marking them once an order block is violated and the price retraces. By analyzing market movements, it helps traders identify recurring patterns in price action. «Indicator I
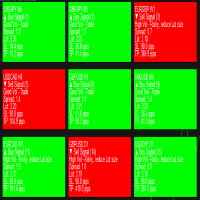
Introducing Telos Dashboard Indicator – Your Ultimate Trading Companion Optimized For Forex! Note: This is a dashboard indicator and won't work on the strategy tester. Demoing it there is a waste. Instead get the main indicator or, use the demo of DynamicCOG to see how it works with arrows, although Telos is a more refined and filtered version than the DynamicCOG indicator. Never Miss a Trading Opportunity Again!
Welcome to the future of trading with the Telos Dashboard Indicator ! Inspired

Индикатор предназначен помогать в принятии решения выбора направления торговли (бай или селл). Представляет собой сканер истории, ищущий совпадения текущего паттерна (комбинации нескольких текущих баров) с историческими данными в процентном соотношении по относительному вертикальному положению свечей относительно друг друга, размеров каждой свечи, размеров тела свечи и теней свечи. На истории найденные совпадения обозначаются вертикальными линиями на свече начала искомого паттерна. После каждого

Описание индикатора "Currency Strength Panel with Trend Analysis" Этот индикатор предназначен для анализа силы валютных пар и определения их текущих трендов, что помогает трейдерам принимать более обоснованные решения при торговле. Он отображает на графике панель, которая показывает силу каждой валютной пары на основе изменений на разных таймфреймах (H1, H4, D1) и определяет, находится ли пара в тренде или в контр-тренде. Как использовать этот индикатор: Анализ силы валютных пар: Индикатор отсле

Historical Equity Flow Indicator (HEFI) Описание
HEFI — это индикатор для MetaTrader 5, который визуализирует динамику баланса счета и плавающего баланса в реальном времени. Он помогает трейдерам анализировать историческую эффективность своей торговли, а также оценивать текущее состояние открытых позиций. Для чего предназначен Отслеживание баланса счета с учетом закрытых сделок за выбранный период. Отображение плавающего баланса (баланс + незакрытые прибыли/убытки). Анализ влияния открытых пози
FREE

The key logic of SignalTech is generated by Artificial Intelligence. The machine learning module should continue optimizing the core logic on the server side to guarantee that SignalTech System can accurately track the market's movement.
SignalTech can generate AI based signals with Buy/Sell Arrows and Pop-Up/Sound Alerts. Each signal has clear Entry and stop Loss levels, which should be automatically flagged on the chart, as well as potential Targets 1, 2, and 3.
SignalTech can work on EURU

Индикатор Custom ATR для торговли по горизонтальным уровням
Индикатор Custom ATR – это мощный инструмент, предназначенный для трейдеров, использующих горизонтальные уровни и понимающих важность среднего истинного диапазона (ATR) при принятии торговых решений. Этот индикатор вычисляет ATR на основе настраиваемого количества баров, фильтрует аномальные бары (слишком большие или слишком маленькие) и предоставляет наглядное отображение ключевых данных, включая значения ATR, количество пунктов для с
FREE
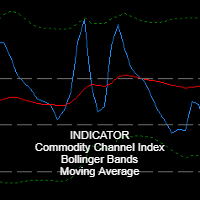
Main Indicator Description: RosMaFin Triple Insight CCI Navigator is an advanced technical indicator that combines the power of three popular indicators - CCI (Commodity Channel Index), Bollinger Bands, and Moving Average - in one comprehensive window. This versatile tool provides traders with a complex view of market conditions and helps identify potential trading opportunities with greater precision. Key Features: Display of all three indicators in one window for efficient analysis Fully custo
FREE

**Verve AI** Reversal Pro Indicator Pro – The powerful AI tool that accurately detects market reversals. With precision, it identifies key turning points and highlights crucial support and resistance levels. Whether you're navigating volatile trends or finding the perfect entry or exit, **Verve AI** simplifies complex data into clear, actionable signals. Trade smarter with the most reliable reversal indicator, powered by advanced artificial intelligence.

Smart Sniper Entry Spike Detector
Advanced AI-Powered Spike Detection for Boom and Crash Markets
Here are my Socials, make sure you contact me to see How I Use The Spike Detector:
Free Telegram Group: https://t.me/+4jj1artnc_1mMzM8 WhatsApp: https://wa.me/+27659660169 Official Website: https://smartsniperentry.site
The Smart Sniper Entry Spike Detector harnesses cutting-edge artificial intelligence to identify high-probability trading opportunities in Boom and Crash synthetic indices. De

The "Setup Bivit" Indicator The "Setup Bivit" is an advanced technical indicator designed for MetaTrader 5, developed to provide a clear and comprehensive visual analysis of the financial market. Inspired by customized strategies, this indicator combines intuitive visual elements and decision-support tools, making it a powerful ally for traders looking to identify trends, support and resistance zones, and price patterns across different timeframes. With a rich and interactive graphical interface

Highly advanced Non-repaint MT5 Trading indicator. Arrow appears on current candle stick arrow will not disappear, The indicator works in All timeframes M1 - Monthly timeframe. Pairs to trade: US30, SPX500, NASDAQ100, GOLD BLUE ARROW- BUY SIGNAL PINK ARROW- SELL SIGNAL Note the indicator will show multiple blue arrows showing a strong uptrend. Same goes as Multiple pink arrows showing a strong downtrend Entry is on arrow direction and exit on opposite signal.
Please contact me after purchase.
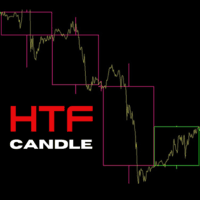
ICT Traders! Here's another cool Indicator that will allow to trade the HTF narrative while focus on price action on your entry timeframes. The following are the input for setup the indicator: Maximum Bar: The number of HTF bar you want to display High Timeframe: the Timeframe which narrative you want to base on and trade from the lower timeframe. Visual Timeframe: the largest Timeframe the indicator will print the HTF candles. Bullish Candle: The color of the bullish candle Bearish Candle: The
ADBIN BAND – Adaptive Channel Indicator for XAUUSD and DE30
Description:
The ADBIN BAND is a trading indicator designed for analysis of XAUUSD (Gold) and DE30 (German Stock Index) . It generates dynamic price channels using an Adaptive Moving Average (AMA) to reflect market volatility. Functionality: Dynamic Channels : Plots upper and lower bands around price, adjusting to volatility via AMA. Signal Generation : A green arrow appears when price closes above the upper band. A r

Super Trend Indicator – Trend Following Tool
Description:
The Super Trend Indicator is a trend-following tool designed to assist traders in identifying market trends. Utilizing the Average True Range (ATR), it dynamically adjusts to market volatility and generates visual signals. The indicator plots lines directly on the chart, changing color based on trend direction. Crosses between the price and indicator line may suggest potential trend shifts. Key Features: Dynamic trend detection using ATR.

Range Breakout Signal (RBS) is a powerful trading indicator based on the Fair Value Gap (FVG) concept. This strategy identifies imbalances in price action, where liquidity gaps create high-probability trading opportunities. The indicator pinpoints these gaps and marks potential buy and sell zones for traders to capitalize on market inefficiencies. Key Features:
Detects Fair Value Gaps (FVG) for strategic entries Identifies strong breakout zones with price range expansion Displays clear buy a

This Indicator enhances the default Relative Strength Index (RSI) by introducing several improvements. First, it visually highlights overbought and oversold regions by changing the RSI color from white to red. Second, it includes additional reference lines at 20, 40, 50, 60, and 80, providing a clearer framework for assessing RSI values. The most notable feature is the use of the middle 50-line to indicate the current market cycle. The color of the 50-line dynamically reflects the cycle: green f

The "Matrix Series" indicator is a technical analysis tool designed to identify potential support and resistance zones by visualizing overbought/oversold conditions and trend direction using a combination of price data and customizable parameters, incorporating Commodity Channel Index (CCI) to highlight potential reversal points within the market.
Key features of the Matrix Series indicator: Dynamic Zones: Calculates support and resistance levels based on CCI values, allowing users to adjust th
FREE

A Fair Value Gap (FVG) is a three-candle price imbalance where price moves aggressively in one direction, creating a gap between the wicks of the first and third candle.
How to Identify an FVG: The second candle must have a large body , showing strong displacement.
The wick of the third candle must not overlap with the wick of the first candle , leaving an inefficiency. The third candle should not close beyond the high (bullish) or low (bearish) of the second candle.
Usage: Internal Range
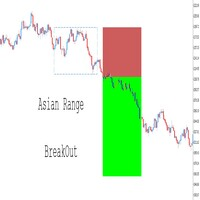
Полностью настраиваемый – Адаптируйте индикатор под свой стиль торговли, изменяя параметры, такие как время диапазона, цвета, стили линий и настройки риск-доходности. Визуализация торговых уровней – Автоматически отображает цену входа, стоп-лосс (SL) и тейк-профит (TP) на основе условий пробоя. Бесшовная интеграция с советниками (EAs) – Возьмите полный контроль над своими автоматическими стратегиями, добавляя дополнительные подтверждения, такие как RSI, скользящие средние, пробой структуры
FREE
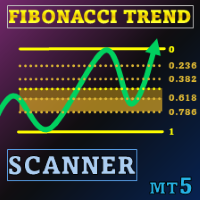
Специальное предложение : ALL TOOLS , всего по $35 за каждый! New tools will be $30 for the first week or the first 3 purchases ! Trading Tools Channel on MQL5 : Join my MQL5 channel to update the latest news from me В условиях волатильной торговой среды мощный и интуитивно понятный инструмент анализа поможет вам быстро воспользоваться новыми возможностями. Fibonacci Trend Scanner не только объединяет в себе функции традиционного индикатора Fibonacci и SuperTrend, но и расширяет во

Важное примечание: "Некоторые изображения", показанные на скриншотах, взяты из моих индикаторов, Suleiman Levels Indicator и RSI Trend V Indicator. Индикатор RSI Trend V предназначен для идентификации тренда и интегрирован с уровнями Фибоначчи для определения целевых зон и возможных разворотов. Это очень мощный, строгий и полезный индикатор для определения общего направления тренда. Он включает бычьи и медвежьи стрелки, которые появляются в потенциальных зонах разворота цены. Однако ключевые эл
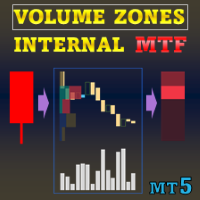
Специальное предложение : ALL TOOLS , всего по $35 за каждый инструмент! New tools will be $30 for the first week or the first 3 purchases ! Trading Tools Channel on MQL5 : Join my MQL5 channel to update the latest news from me Volume Zones Internal Visualizer Multi-Timeframe – это лучшее решение для получения детального представления о торговом объеме на младших таймфреймах во время работы на графике старшего таймфрейма. Если вы ищете мощный и интуитивно понятный инструмент для ан
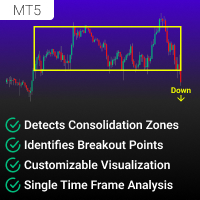
Consolidation and Breakout Detector — это продвинутый индикатор для MetaTrader 5 (MT5) на одном таймфрейме, предназначенный для трейдеров, которые хотят идентифицировать зоны консолидации (боковые рынки) и обнаруживать возможности пробоя .
Он автоматически анализирует историческое ценовое движение, выявляет области бокового движения рынка и уведомляет трейдеров о подтвержденном пробое . Этот инструмент полезен для трейдеров, работающих на пробой, следящих за трендом и торгующих в диапазоне , пом
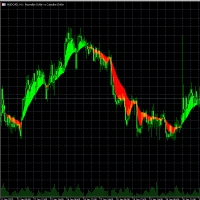
CrossMann is a simple and elegant indicator for MetaTrader 5, which represents the areas of intersection of moving averages.
This indicator displays two Exponential Moving Averages (EMA), with different periods, calculated by closing prices, and colors the ranges of their intersection in two colors - for buying and selling.
The indicator will work great on all trading instruments and timeframes in strategies where a similar principle is used.
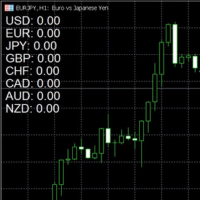
Новый Торговый Инструмент: Оптимизируйте Ваши Сделки! Я рад представить вам совершенно новый инструмент, который я разработал, чтобы вы могли делать сделки, не задумываясь! В отличие от классических индикаторов, этот инструмент не просто отслеживает изменение цен. Он глубоко анализирует корреляции между валютами и помогает выявить стратегические моменты для входа на рынок. Вот как это работает: Ноль = Нет Сделки : Пока индикатор на нуле, это означает, что рыночные условия неблагоприятны, и

ShoukatSRI — это продвинутый индикатор MQL5, разработанный для помощи трейдерам в определении потенциальных изменений тренда на рынке до их полного формирования. Используя комбинацию техник сглаживания и индивидуальную логику сигналов, индикатор обрабатывает рыночные данные и предоставляет ранние оповещения посредством четко определенных сигналов на покупку и продажу. Ключевые особенности: • Раннее обнаружение тренда — индикатор применяет передовые алгоритмы, такие как SuperSmoother, гауссовское

BOS and CHOCH with Label Indicator MT5
The BOS-CHOCH market structure shift detector is an advanced tool designed for traders who analyze internal price movements on the MetaTrader 5 (MT5) platform . This indicator leverages sophisticated algorithms to cater specifically to traders following ICT (Inner Circle Trader) and Smart Money trading methods . It automatically detects Break of Structure (BOS) and Change of Character (CHOCH) and marks them on the chart with clearly labeled annotations. A
FREE

Fair Value Gap Void MT5
The Fair Value Gap and Void (FVG + Void) indicator is specifically designed for ICT and Smart Money (SMC) traders, utilizing sophisticated algorithms to detect and highlight imbalance zones and FVGs on price charts. This tool is tailored for the MetaTrader 5 (MT5) platform, where bullish FVGs are represented in green and bearish FVGs in brown, allowing traders to quickly recognize critical trading areas. When the price revisits these zones, the indicator marks the portio
FREE

This MetaTrader 5 indicator identifies and visually displays the trading hours of major financial markets (Europe, US, and Asia) on the chart. Through customizable colored fills, it marks the trading periods of each market, respecting server times (GMT+2) and excluding weekends. Market names are displayed near the top of the chart in Arial Black font, also with customizable color. The indicator automatically adjusts to the chart scale, maintaining the fill across its entire vertical range.
FREE

Improved Fair Value Gap Void MT5
The Improved Fair Value Gap (iFVG + Void) indicator for MetaTrader 5 is an advanced iteration of the traditional Fair Value Gap "FVG" indicator. Fair Value Gaps emerge following sharp price movements, marking crucial zones where supply and demand are unbalanced. Price action often gravitates back to these levels. This indicator visually marks bullish Fair Value Gaps (FVG) with green boxes and bearish Fair Value Gaps with red boxes. Additionally, it shades the us
FREE

Order Block Void Indicator MT5
The Order Block + Void Indicator in MetaTrader 5 is an advanced tool designed to detect key liquidity areas and highlight them as order blocks. These zones are frequently utilized by institutional traders, making them ideal reference points for determining support and resistance levels. This indicator visually marks bullish order blocks with green boxes and bearish order blocks with red boxes. Additionally, once an order block is consumed, it turns gray to indic
FREE
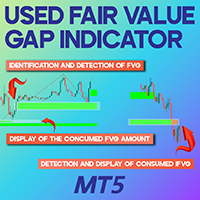
Modified Fair Value Gap (FVG) Indicator for MT5
The Modified Fair Value Gap (Modified FVG-iFVG) indicator is a sophisticated and efficient tool designed for ICT and Smart Money traders, optimized for the MetaTrader 5 (MT5) platform. This indicator detects and marks market imbalance areas (FVG), highlighting key supply and demand zones. Bullish FVG zones are displayed in green, while bearish FVG zones appear in brown. As the price revisits these levels, the indicator dynamically updates by progr
FREE
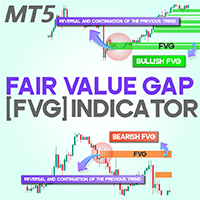
Fair Value Gap or FVG indicator MT5
The Fair Value Gap (FVG) Indicator is a valuable asset for traders using MetaTrader 5, designed to highlight market inefficiencies. An FVG occurs when an imbalance between supply and demand causes a rapid price movement. To understand this, picture three consecutive candlesticks; the space between the first and third candlestick represents the "FVG." This indicator automatically marks these gaps on the chart using dynamic boxes—green for bullish FVGs and red
FREE
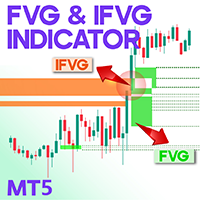
FVG and IFVG Indicator for MT5
The Fair Value Gap (FVG) indicator for MetaTrader 5 is a specialized tool designed to detect critical liquidity zones in line with the ICT trading methodology. These gaps emerge following strong, directional price movements, during which certain price levels remain untraded due to high volatility. Over time, prices often retrace to fill these gaps, creating strategic trading opportunities. «Indicator Installation & User Guide» MT5 Indicator Installation | FVG an

Reversal Zones Pro – индикатор специально разработанный для точного определения ключевых зон разворота тренда .Он рассчитывает средний истинный диапазон движения цены от нижних до верхних границ и визуально отображает прямо на графике потенциальные зоны,помогая трейдерам эффективно выявлять важные точки разворотов тренда. Основные функции: Определение зон разворота : Визуальное отображение индикатором потенциальных зон разворота прямо на графике. Это помогает трейдерам эффективно выявлять
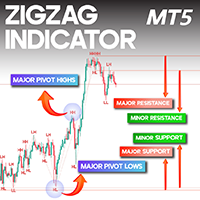
ZigZag Indicator with Labels for MT5
The ZigZag Indicator with Labels is a valuable tool for traders using MetaTrader 5 (MT5) to identify market structure by pinpointing significant highs and lows. This indicator enhances technical analysis by distinguishing between major turning points, which define broader trends, and minor fluctuations, which indicate internal price movements. It is especially useful for Elliott Wave analysts , enabling them to track market dynamics effectively and recognize

MYHISTOGRAM MT5 MyHistogram is a powerful technical analysis tool designed to help traders visualize the distance between price extremes and a moving average. By calculating and displaying this distance in a histogram format, it allows traders to quickly assess market trends, spot potential reversals, and make more informed trading decisions. The indicator is highly customizable, enabling users to select different timeframes, moving average types, and applied price settings. Additionally, it fea
FREE
How Antabod Stochastic Works Antabod Stochastic is a cutting-edge technical indicator designed to analyze market momentum and identify overbought and oversold conditions with unparalleled precision. Here's a breakdown of how it works and what makes it a game-changer for traders: ________________________________________ 1. Core Concept At its heart, Antabod Stochastic is based on the stochastic oscillator principle, which measures the position of a current price relative to its range over a spec
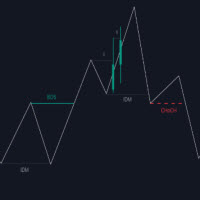
The Market Structure with Inducements & Sweeps indicator is a unique take on Smart Money Concepts related market structure labels that aims to give traders a more precise interpretation considering various factors. Compared to traditional market structure scripts that include Change of Character (CHoCH) & Break of Structures (BOS) -- this script also includes the detection of Inducements (IDM) & Sweeps which are major components of determining other structures labeled on the chart. SMC & price a

MT5 Session Indicator: Track Global Market Hours with Precision Boost your trading strategy with this FREE Session Indicator for MetaTrader 5 , designed to help you effortlessly identify active trading sessions across global markets. Perfect for forex, stocks, and commodities traders, this tool highlights key market hours (Asian, European, North American, and overlaps) directly on your chart, ensuring you never miss high-liquidity periods. Key Features:
Visual Session Overlays : Clear color-c
FREE

Simple Vwap with the daily, weekly and monthly
VWAP is the abbreviation for volume-weighted average price , which is a technical analysis tool that shows the ratio of an asset's price to its total trade volume. It provides traders and investors with a measure of the average price at which a stock is traded over a given period of time.
How it's used Identify entry and exit points: Traders can use VWAP to determine when to buy or sell an asset. Understand price trends : Traders can use V
FREE

Solar Prediction – Индикатор для анализа движения цены Solar Prediction – это инструмент, предназначенный для определения направлений движения цены на рынке. Индикатор анализирует динамику рынка и помогает находить потенциальные точки входа и выхода. Анализ рыночных данных без использования дополнительных индикаторов
Гибкость в применении – работает на различных таймфреймах
Простота использования – подходит как для начинающих, так и для опытных трейдеров
Адаптация к рыночным усло

Arrow Simulator mt5 gives buy and sell signals based on non repaint arrow logic
It also shows take profit and stop loss placement based on average true range
Also provided is a simulation panel in the corner to show how the signals performed over a set number of bars
When running in strategy tester or live lower the number of bars to reduce using pc resources and speed up back testing
Filter out arrows with the ma filter if needed and choose your trading time
Default settings is for 5m EUR

Panther Scalping Indicator – The Ultimate Trading Weapon for Gold, Forex & BTC! Dominate the Markets with Precision Buy & Sell Signals! We’ve designed the Panther Scalping Indicator to give you an unfair advantage in trading Gold (XAUUSD), Forex pairs, and BTC. This powerful tool is built on the proven Panther Scalping Strategy , ensuring you never miss a high-probability trade. How It Works:
Lime Up Arrow – A clear Buy Signal when market conditions align.
Red Down Arrow – A strong
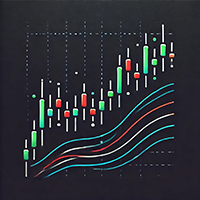
This is simple indicator for displaying Multi Moving Average line in chart, with one single Indicator. Just place the indicator in your chart, select how many MAs you want to display. And you are ready to go. Parameters can be changed on the fly by the control panel provided by the Indicator. And you can show/hide the Moving Average line just with check/unchecked in the Panel. This indicator are still in development, if you have any further feature request, please let me know in the comment.
FREE
Panther Scalping Indicator – Your Ultimate Trading Edge! Maximize Your Profits with the Panther Scalping Indicator! We’ve transformed the powerful Panther Scalping Strategy into an advanced indicator that gives you precise Buy and Sell signals on Deriv’s Synthetic Indices , including Volatility Indices, Step, Jump, and Drift Switching Indices. How It Works:
Lime Up Arrow – Clear Buy Signal when market conditions align.
Red Down Arrow – Strong Sell Signal to capitalize on downtrends
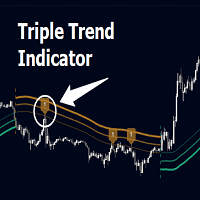
Triple Trend Indicator is a versatile trend-following tool designed to help traders identify trend strength and potential pullback levels using a three-band system. Each band represents a varying degree of price deviation from the mean, providing progressively stronger trend signals.
Key Features:
Three Adaptive Bands:
The indicator dynamically calculates three bands (1, 2, and 3) based on moving averages (SMA, EMA, WMA) and ATR multipliers.
Bands are positioned below the price in a
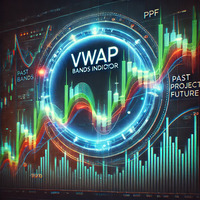
VWAP Bands Indicator – The Revolution in Trend Analysis! The VWAP Bands Indicator is the ultimate tool for traders seeking precision and clarity in market analysis! Based on the Volume-Weighted Average Price (VWAP) , this indicator not only displays the main trend but also adds three dynamic bands to capture volatility and identify strategic buy and sell zones . Why Use the VWAP Bands Indicator?
Professional Accuracy – Identifies support and resistance areas based on real volume.
Th
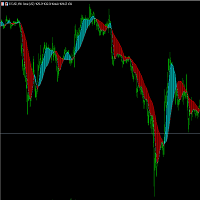
Trend Indicator Pro Use any currency and any time period you want For greater profitability use a risk return of at least 1:3 or 1:4 Entry Signal : Appears after the moving average crossover closes ️️
Histogram Flip : Signals important trend changes ️
Easy to use : Perfect for those who want fast, confident decisions!
Boost your accuracy : Find the best market entry moments with more confidence!
Get straight to the point and seize the best trend opportunities!
Узнайте, как легко и просто купить торгового робота в MetaTrader AppStore - магазине приложений для платформы MetaTrader.
Платежная система MQL5.community позволяет проводить оплату с помощью PayPal, банковских карт и популярных платежных систем. Кроме того, настоятельно рекомендуем протестировать торгового робота перед покупкой, чтобы получить более полное представление о нем.
Вы упускаете торговые возможности:
- Бесплатные приложения для трейдинга
- 8 000+ сигналов для копирования
- Экономические новости для анализа финансовых рынков
Регистрация
Вход
Если у вас нет учетной записи, зарегистрируйтесь
Для авторизации и пользования сайтом MQL5.com необходимо разрешить использование файлов Сookie.
Пожалуйста, включите в вашем браузере данную настройку, иначе вы не сможете авторизоваться.