Смотри обучающее видео по маркету на YouTube
Как купить торгового робота или индикатор
Запусти робота на
виртуальном хостинге
виртуальном хостинге
Протестируй индикатор/робота перед покупкой
Хочешь зарабатывать в Маркете?
Как подать продукт, чтобы его покупали
Новые технические индикаторы для MetaTrader 5 - 69

This is Gekko's Bollinger Bands indicator. It extends the use of the famous Bollinger Bands and calculates strong entry and exit signals using price action on the edge and on the middle bands. You can set it up in many different ways, eg: pullback, pullback against trend, middle band crossing and middle band crossing against trend. Inputs Number of Bars to Plot Indicator: number of historical bars to plot the indicator, keep it low for better performance; Produces Signal Only When a Bar Closes:

Volume Delta Panel is a very powerful indicator that read the supply on Market. It calculates the Delta from movement of the price and the difference of BUY volumes and SELL volumes. The Volumes are added to price and normalized to symbol points.
Its special structure allows you to get all Time Frames values available on the platform MT5. Panel can show 50 instruments simultaneously all customizable according to the offer of the Broker. A good observation of this instrument can suggest great

Description Very robust and powerful indicator, which allows through its 4 components, trade the market in trend or not trending conditions. it based on a very reliable trading strategy and gives you all you need to be succesful in trading. KEY LINKS: Indicator Manual – How to Install – Frequent Questions - All Products How is Clever Scalper Pro useful to you? A complete and reliable trading strategy. Easy to understand and trade Allow to identify trend, confirm it, look for retraceme

Этот индикатор носит скорее информативный характер. Его работа основана на предположении о том, что движение цены на рынке можно представить в виде шума того или иного цвета, который зависит от параметров распределения ценовых значений. Благодаря этому можно анализировать изменение цены с разных сторон, а рассматривая движение цены как шум того или иного цвета можно получить информацию о текущем положении дел на рынке и сделать прогноз о поведении цены. При анализе показаний индикатора учитывае

Несмотря на некоторые недостатки индикатора « AIS Color Noise Filter » идея использовать его для сглаживания ценового ряда и прогнозирования цен выглядит достаточно привлекательной. Это вызвано несколькими причинами: во-первых, учет нескольких шумовых компонент позволяет строить прогноз на независимых друг от друга факторах, что может повысить качество прогнозирования; во-вторых, шумовые характеристики ценового ряда ведут себя достаточно стабильно на протяжении всей истории, что дает возможност
Индикатор Markets Heat может помочь вам определить правильный курс действий в текущей рыночной ситуации, рассчитав «уровень тепла» на рынке. Что такое «уровень тепла» на рынке? Ну, это мой собственный способ упрощения сложных рыночных условий для облегчения процесса принятия решений. Как это работает? Большую часть времени рынок движется в узком диапазоне и не может «решить» куда идти -> плоский рынок -> холодный рынок. В других случаях цена идет вверх или вниз -> делает трендовые движения -> на

Intraday Volume Profile анализирует краткосрочную информацию о цене и объеме, помогает визуально представить уровни концентрации цены и объема. При краткосрочной торговле на Forex обычно используют 5-, 15-, 30-, 60-минутные и т.д. внутридневные графики при торговле в рыночный день. Индикатор возможно использовать в качестве дополнительного инструмента для внутридневного скальпинга . Профиль объема дает превосходный визуальный образ спроса / предложения по каждой цене за выбранный таймфрейм. Пр

Session Volume Profile - это расширенное графическое представление, которое отображает торговую активность в течение торговых сессий Forex на указанных ценовых уровнях. Рынок Forex можно разбить на четыре основные торговые сессии: Австралийская сессия, Азиатская сессия, Европейская сессия и любимое всеми время торговли - Американская (US) сессия. POC - профиля может быть использован в качестве уровня поддержки и сопротивления для внутридневной торговли.
VWAP - цена средневзвешенная объемом
The Absolute Strength (AS) is intended to chart the current and historical gain or loss of an underlying based on the closing prices of a recent trading period. It is based on mathematical decorrelation. It shows absolute strength momentum.
This indicator is not measured on a scale like Relative Strength (RSI). Shorter or longer timeframes are used for alternately shorter or longer outlooks. Extreme high and low percentage values occur less frequently but indicate stronger momentum of the un

Description: The indicator shows the TDI indicator in a separate window, and with the RSI component, the indicator finds possible divergences with M or W patterns. KEY LINKS: How to Install – Frequent Questions - All Products Functions: Finds Market Makers patterns. Finds extremes or exhaustion into the market. Looks for a trend continuation. Content: TDI Indicator Divergence and M or W Signals Note 1: This indicator should only be considered as a part of any trading strategy. You shoul
Didi Index Alert Plus Filter
Indicator developed by Brazilian and analyst Odir Aguiar (Didi), consists of "Moving Averages", known for the famous needles Didi, which allows the visualization of reversal points. The concept is very simple, when you insert 3 Moving Averages on display, one of three periods, an 8 and the other 20, there appears the formation of the indicator which works on an axis or center line 0. The needles occur when the intersection of averages comes closest to the line 0.

A scalping indicator based on mathematical patterns, which on average gives signals with relatively small SL, and also occasionally helps to catch big moves in the markets (more information in the video)
This indicator has three main types of notifications: The first type warns of a possible/upcoming signal on the next bar The second type indicates the presence of a ready signal to enter the market/open a position The third type is for SL and TP levels - you will be notified every time price r

Simple Day Trading Strategy SDT VERY RELIABLE DAY TRADING AND SCALPING INDICATOR THAT CAN MAKE EVEN A NEWBIE PRODUCE TREMENDOUS RESULTS. IT IS SIMPLE AND FAST, NO FANCY ON-CHART OBJECTS. JUST BUY AND SELL ARROWS. IT TELLS YOU WHEN TO ADD TO A POSITION AND WHEN YOU SHOULD CONSIDER EXITING. THE BEST TIME TO EXIT ALL TRADES COMPLETELY IS ON OPPOSITE SIGNALS
GREAT PRODUCT FOR ALL TRADING STYLES (swing, day trading, scalping, etc). JUST TRY IT ON ALL TIME FRAMES AND CURRENCY PAIRS AND SETTLE ON
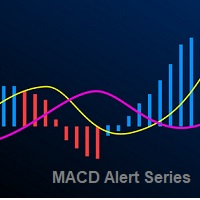
The Moving Average Convergence Divergence Indicator (MACD) is both a trend–seeking and momentum indicator which uses several exponential moving averages set to closing prices to generate trading signals. We added many types of alerts plus the Delay Cross Filter to aid in your search for better opportunities in the market.
Product Features Sound alert Push Notification (Alerts can be sent to your mobile phone) Signs on chart Alert box Alert on zero histogram cross or line sign cross. DelayCros

Уникальность данного индикатора заключается в алгоритме учёта объёмов: накопление происходит непосредственно за выбранный период без привязки к началу дня. Последние бары можно исключить из расчёта, тогда текущие данные будут меньше влиять на значимые уровни (объёмы), образованные ранее. Для более точного расчёта по умолчанию используются данные с графика М1. Шаг распределения ценовых объёмов регулируется. По умолчанию правая граница отображения установлена на бар, соответствующий началу и

[ZhiBi Dragon] основан на принципе колебаний, который может предсказать горизонтальное расположение и форму тренда рынка, а затем подать сигнал ордера в соответствии с формой рынка, а также вероятность сигнала и качество тренда! зеленые, красные и зеленые, эти три тонкие линии, пересекающие желтую линию вверх, имеют тенденцию вверх, а эти три тонкие линии, пересекающие желтую линию вниз, - тенденцию вниз. Вероятность сигнала делится на три уровня: 25%, 50% или 75%. Чем выше вероятность, тем в
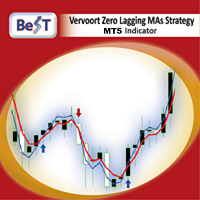
All those involved in trading do certainly know that Moving Average Crossovers for being tradable should be reliable and also they need to have minimal lag.
BeST_Vervoort Zero Lagging MAs Strategy is an outstanding indicator that can help you to achieve it and is based on S.Vervoort's work about Reliable and of Zero Lag MAs Crossovers as described in his TASC_05/2008 article " The Quest For Reliable Crossovers ". It's a Multipotentiality Indicator as it can display of either simply the Zero Lag

Индикатор вычисляет профили объёма динамически и выводит результат в виде кривых VAL, VAH и POC.
Особенности работы индикатора Индикатор использует для вычислений исторические данные младших (относительно текущего) таймфреймов: M1 - для таймфреймов до H1, M5 - для таймфрейма H1, M15 - для таймфрейма H4, H1 - для таймфрейма D1, H4 - для таймфрейма W1, D1 - для таймфрейма MN. Цвет участков кривой DPOC определяется в совокупном сравнении объёма уровней POC всех профилей, входящих в состав этой к

ATR is an excellent indicator to visualize if volatility is increasing or decreasing. But what if you want to compare the volatility to another pair or instrument? Since each pair with different quote currency has different pip value, the output of the ATR doesn't really say that much. Comparing pairs to other instruments is even harder. What you as a trader care about is how much the pair has moved up or down in percentage, therefore normalizing ATR to percent would make things much easier. T
FREE

RoundNumbers indicator is a simple and powerful psychological price levels. Trader usually use these levels as a Support and Resistance (SnR). Indicator Input: Levels - Numbers of levels drawn on chart. Default 30 levels. BoxSize - Box size drawn on each levels, indicate buffers around levels. Default value 1pips (10point) above and below each levels. ZoneSize - Distance between each levels, default value 10pips (100point). Style & Colours - User inputs customization. For MT4 version, p
FREE

Оригинальный трендовый индикатор. Индикатор рисует в отдельном окне три линии, характеризующие текущую динамику цены. Может принимать значения от -1 до +1. Чем ближе значение индикатора к +1, тем сильнее восходящий тренд. Чем ближе к -1, тем сильнее нисходящий. Также может применяться в качестве осциллятора для определения перекупленности/перепроданности. Индикатор имеет один входной параметр Period, в котором указывается количество баров, используемых для расчета.
FREE
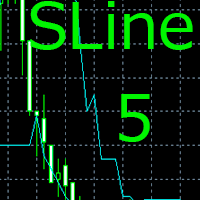
Данный индикатор помогает трейдеру выявить импульс цены,а также рассчитать его силу относительно среднего истинного диапазона движения цены. Индикатор будет незаменимым помощником для трейдеров использующих в своей торговой стратегии,теорию "Снайпер",в которой для торговли используются так называемые "импульсные уровни".Индикатор работает с любыми валютными парами находящимися в окне Обзор Рынка МТ5,металлами,индексами и т.д. Для работы по индикатору,нужно дождаться момента,когда 3 линии с вверх

Niubility Scalping The Niubility Scalping indicator detects trend, give sell point and buy point. this indicator can use for scalping technique, and also use for trend technique.
Attention
Chart statistics will help you to optimize your trading, statistical accuracy to the hour.
It can works on every timeframe.
The indicator analyzes its own quality and performance.
Losing signals are highlighted and accounted.
The indicator is non-repainting.
It implements sound alerts.
Parame

Niubility RSI and Fibo The RSI will send an alert when the RSI value of the price gets to the level specified in the settings.
The input of the indicator can allow for change of RSI period, overbought and oversold.
The RSI will work for multi timeframe.
The RSI will scan different pairs.
This Fibo is designed to draw a Fibonacci retracement, using as a basis the ZigZag indicator.
Description:
'up' word means up trend.
'down' word means down trend.
' -- ' word means no tre

Alert Stochastic plus delay and level Filter
A stochastic oscillator is a momentum indicator comparing a particular closing price of a security to a range of its prices over a certain period of time. We added many types of alerts plus the Level Cross Filter to aid in your search for better opportunities in the market. Product Features Sound alert Push Notification (Alerts can be sent to your mobile phone) Signs on chart Alert box Level Filter Delay Level Filter
Indicator Parameters K

Давайте рассмотрим характер изменения цен на рынке Forex, не обращая внимания на причины, из-за которых эти изменения происходят. Такой подход позволит нам выделить основные факторы, влияющие на движение цены. Для примера возьмем цены открытия баров на валютной паре «EUR-USD» и таймфрейме H1. Построим для этих цен диаграмму Ламерея (Рисунок 1). На этой диаграмме видно, что движение цены в основном происходит по линейному уравнению. Чтобы определить параметры этого уравнения можно воспользоваться

this is an indicator to clarify seeing Low and High in the market and is very useful for facilitating those who are studying technical price action
this is a type of indicator that gives color to the candlestick where the indicator is divided into 3 colors red = bearish green = Bullish
Gray = base
this indicator can be used on the forex market or the mt5 binary market. https://t.me/SBA_FOREX_SIGNAL

FX Market Correlation indicator calculates the weakness/strength from all 28 currency pairs in the market. This is unique and powerful way of watching the market. It works on all timeframes. You can use it for scalping, or you can use it for long term trading. FX Market Correlation indicator is NOT repainting.
Features: --------- -easy determine which currency is strengthening and which is weakening -choose best currency pairs to trade and times to trade them -find correlation between pairs -N

Технический индикатор "Reversal patterns" является математической интерпретацией классических разворотных паттернов: Pin Bar, Harami и Engulfing. То есть «Разворотного бара», «Харами» и «Поглощения». Данный индикатор позволяет определить момент разворота котировок на основе рыночной динамики и победителя между «быками» и «медведями». Индикатор отображает момент разворота на локальных максимумах и минимумах графика любого таймфрейма, что позволяет повысить точность сигнала. Также индикатор имеет

ADX CROSS Trend Filter Alert
The average directional index (ADX) is used to determine when the price is trending strongly. In many cases, it is the ultimate trend indicator. We added many types of alerts plus the TrendDI Filter Level to aid in your search for better opportunities in the market.
Product Features Sound alert Push Notification (Alerts can be sent to your mobile phone) Signs on chart Alert box Trend Filter Delay Cross Filter Indicator Parameters ADXPeriod - Set the ADX indicator

Niubility Trend Niubility Trend displays the trend direction for all time frames in real time.
You'll see at a glance at which direction the trends are running, how long they last and how powerful they are.
All this makes it an easy-to-use trend trading system for beginners, advanced and professional traders.
Features
Easy to trade Customizable colors and sizes It is non-repainting and non-backpainting It is fantastic as a trailing stop method It implements alerts of all kinds

Ищете мощный индикатор для торговли на рынке Форекс, который поможет вам с легкостью определить прибыльные торговые возможности? Не ищите ничего, кроме Beast Super Signal. Этот простой в использовании индикатор, основанный на тренде, постоянно отслеживает рыночные условия, ищет новые развивающиеся тренды или отслеживает уже существующие. Beast Super Signal дает сигнал на покупку или продажу, когда все внутренние стратегии совпадают и на 100% совпадают друг с другом, что устраняет необходимость

Xtreme TrendLine - это мощный мощный индикатор тренда. Индикатор основан на анализе свечей и трендовых каналов. Его можно использовать на любой торговой паре или инструменте на любом таймфрейме. Этот индикатор доступен в советнике через функции iCustom и полностью настраивается пользователем.
Функции Любой торговый инструмент Любой таймфрейм Полностью настраивается пользователем Больше линий тренда на одном графике Может использоваться в советнике через функцию iCustom Можно использовать сразу

BeST_Trend Exploiter is a Metatrader Indicator based on a smart proprietary algorithm which can detect the market Median Trend while it filters out the noise providing Buy and Sell Signals and also wherever it is applicable it provides us with TP Levels of High Probability. Additionally as it has Built Inside all the necessary features it can be used as a Complete Strategy of very Impressive Results. Essential Advantages of the Indicator
Clear and Easily Understandable trading rules. Real

Features Value area lines (POC, VAH and VAL) of the present and the past separately customizable, making it easier for the trader to read on the most important levels. Value areas and volume profile work in any time period and in any market such as: stocks, futures, forex. commodities, etc. Customizable volume profiles color in single color or gradient. The gradient offers the view of how the volume behaved over time. Customizable performance setup. Allowed to set the number of sessions in whic
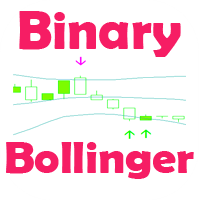
Стрелочный индикатор, выдающий сигнал при пересечении канала боллинждера. Сигналы выдаются в виде стрелок и подходят для торговли бинарными опционами.
Входные параметры Period of BB - период боллинджера Shift of BB - смещение боллинджера Deviation of BB - отклонение боллинджера Type of BB Signals - тип поиска сигналов Invert signals - Возможность давать инвертированные сигналы (для работы по тренду) Inform about finding the signal - параметр, отвечающий за получение уведомлений (Alert) о н
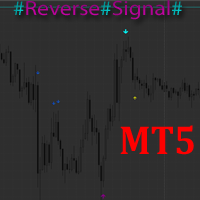
Версия индикатора MT4 - https://www.mql5.com/ru/market/product/16415 Индикатор обозначает предполагаемые развороты рынка в виде стрелок. В индикатор встроены 3 вида разворота. Основной сигнал на разворот. Это более сильный и важный разворот. Обозначается самой крупной стрелкой. Альтернативный сигнал - это дополнительный сигнал без использования дополнительных фильтров в отличие от основного. Подойдет для скальпирования на малых таймфреймах. Смесь основного разворота и альтернативного, но с доба

If you trade Forex, having detailed information about the currency strength and currency pairs correlation can take your trading to new heights. The correlation will help to cut your risk in half, and strength analysis will help to maximize the profits. This indicator provides a hybrid approach for selecting the most appropriate currency pairs using the strength analysis and currency pairs correlation.
How to use the Currency Strength Analysis
Suppose your trading strategy provides a buying o

Должна была состояться прибыльная сделка и вдруг отменилась? При наличии надежной стратегии выход из сделки также важен, как и вход. Exit EDGE помогает максимально увеличить доход от текущей сделки и не потерять выигрышные сделки.
Всегда будьте внимательны к сигналу на выход из сделки
Отслеживайте все пары и тайм-фреймы в одном графике www.mql5.com/en/blogs/post/726558
Торговля
Вы можете закрыть уже открытые сделки, как только получите сигнал Закрывайте заявку на покупку, если вы получил

ZhiBiTMG - это коллекция трендов и индикаторов мартингейла для всех сегментов рынка и всех циклов графиков. Многие индикаторы на рынке нарушают тренд, но утверждают, что они точные, но так ли это на самом деле? На самом деле, это не точно! Потому что рынок должен идти по тренду. Этот индикатор ZhiBiTMG дает сигнал Мартингейла на предпосылке тренда. Это будет соответствовать рыночным правилам. Инструкция по применению: Красная линия - это линия нисходящего тренда (Sell), всего три линии, по умолч

This indicator draw a line on high and low levels of X number of days. It is possible to have an alert (in the software and mobile app) for when the price breaks the high or low of the current day. Configurações: Days - past days to calculate (1 = actual day only).
Alert when reach levels - activate the alert for specific levels or both.
Push notification - enable the alert to the mobile MT5 app.
Appearance
High - high level color.
Low - low level color.
Size actual day - thi
FREE

PLEASE HELP REVIEW/ SUPPORT/ SHARE THIS OTHER INDICATOR HERE https://www.mql5.com/en/market/product/51637 AS YOU DOWNLOAD THIS ONE FOR FREE. THANKS.
This Indicator is based on four moving averages and the PIVOT points. The indicator provides clarity to trading, especially in ranging markets when price is very slow and tight. You can trade intensively daily, every day with this indicator. You may decide to trade with this indicator alone and get the maximum out of the market. The indicator
FREE

Time Range Separator is a useful tool to display a separator period on your platform.
You could go in the properties of the indicator, select the desired range and that's ALL. We believe it is a useful and necessary that we wish to share with you for free all our followers. Input Values: TimeFrame = Period Separator Separator_Color = Vertical Color Line Separator_Style = Vertical Color Style Separator_Width = Vertical Line Width Good trading to all and see you soon. Same indicator for MT4 her
FREE

Read Elliott wave principle automatically. With the Swing Reader, you can easily read the Elliott Wave Principle through an automatic system. With swing, we mean a ZigZag market that is created by a breakout of its standard deviation. You can set the deviation manually, or you can let the indicator do it automatically (setting the deviation to zero).
Advantages you get Never repaints. Points showing a horizontal line, in which statistically a long wave ends. Candles showing a vertical line in

Daily pivot are relatively important in trading.
This indicator have options to select 5 commonly use pivot point calculations.
User input Choose Pivot Point Calculation (Method Classic, Method Camarilla, Method TomDeMark, Method Fibonacci or Method Woodies.) Choose Applied Timeframe for the calculation (M5, M15, H1, H4, D1, W1 etc) Can be attached to any timeframe Choose color of Pivot point Note:
For MT4, please refer here : https://www.mql5.com/en/market/product/22280
FREE

Features Start point of VWAP movable. 7 types of VWAP calculation methods: close, open, high, low, average price, typical price and weighted close. 2 types of volume calculation: ticks or real volume. Thus, the indicator works in any market, for example: stocks, futures, forex, commodities, etc. Color, line style, and line width of the customizable VWAP. Label that show the current VWAP price. VWAP breakout alert that can be enabled or disabled. 2 types of methods to trigger the breakout alert:

VR Sync Charts это утилита для синхронизации разметки между окнами. ИНДИКАТОР НЕ РАБОТАЕТ В ТЕСТЕРЕ СТРАТЕГИЙ!!! Как получить триал версию с тестовым периодом, инструкции, обучение читайте в блоге https://www.mql5.com/ru/blogs/post/726504 . С помощью VR Sync Charts Ваши трендовые урони, горизонтальные уровни, разметка Фибоначчи будут синхронизированы со всеми графиками. Утилита позволяет синхронизировать все стандартные графические объекты в терминале MetaTrader, все Ваши тренды, линии Ганна, и

Индикатор показывает развороты рынка в виде стрелок. Разворотные сигналы основаны на моих личных наблюдениях за поведением рынка. В основу взяты такие принципы как поиск экстремумов, объемы и Price Action. Индикатор дает сигналы на следующих принципах: Поиск окончания тенденции на рост/снижение рынка Поиск модели разворота на основе Price Action Подтверждение разворота объемом контракта. Также в индикатор встроен сигнал при появлении стрелки. Индикатор не перерисовывается. Индикатор не перерисов

Features 3 types of waves: bullish, bearish and unknown. The unknown tower comes when prices move in opposite the direction of the current tower. Label that shows the percentage remaining for the next tower. Allows you set the type of volume that will be accumulated in the towers, either real or tick volumes. Thus, the indicator works in any market, for example: stocks, futures, forex, commodities, etc. Allows you to set the required score for the tower exchange. Allows you to set the font size

Features 3 types of boxes: bullish, bass and unknown. The unknown box arises when prices move in the opposite direction of the current box. Allows you to set the required points for the box change. Lets you set both the box border types and colors or background color. Label that shows the box reversal points. Lets you set the size, color, corner position, and vertical label margin. Input Parameters Tab Reversal Points. Limit in points in the opposite direction to change boxes. Bulls Box Color -

InsideBarStop Indicator for MT5
This indicator can be used to show and evaluate the trailing stop algorithm "Trailing Stop with Inside Bars" that was proposed by the famous German trader and author Michael Voigt ("Das grosse Buch der Markttechnik") to capture robust gains when trading strong price moves. The trailing stop price is shown as a red line. You can start the trailing stop anywhere on your chart (bars or candles) by setting the "initialBarDateTime" input parameter to the open time of
FREE

Indicador en base a la pendiente de la linea de precio, dibuja una línea de color cuando sube a base de los precios que previamente has sido procesados o linealizados, y cuando baja la pendiente la linea linealizada toma otro color. En este caso se a considerado 6 lineas de diferentes procesos desde pendientes largas hacia las cortas, observándose que cuando coincidan las pendientes se produce un máximo o mínimo, lo que a simple vista nos permitirá hacer una COMPRA O VENTA.

Стрелочный индикатор, выдающий сигнал при пересечении канала боллинждера. Сигналы выдаются в виде стрелок и подходят для торговли бинарными опционами.
Входные параметры Period of BB - период боллинджера Shift of BB - смещение боллинджера Deviation of BB - отклонение боллинджера Inform about finding the signal - параметр, отвечающий за получение уведомлений (Alert) о найденном сигнале. По умолчанию - да
FREE

It is a MetaTrader 5 integrated drawing tool inspired on the "Pointofix" software. You can paint, make annotations and drawings on the chart in real time. It works in multiple timeframes, that is, the drawings can be visualized in different timeframes. The drawings are also saved in files and can be restored even on MetaTrader restarting.
Simple and Pratical
Chart Pen is designed as simple, beautiful and innovative way to create and manage all your chart analysis. There is no existing drawi

This tool was developed to help traders on candle by candle and replay training. In the indicator settings, the user can set the training start datetime. The indicator will autommatically hide all candles after this datetime. So the user can make studies before starting the training. Starting the training, the user can simulate your trades quickly and easily!
This is a product developed by Renato Fiche Junior and available to all MetaTrader 5 users!
Input Parameters
Training Start - train

This indicator was developed to support multiple timeframe analysis. In the indicator settings, the user can set the color, width, and style of the horizontal lines for each timeframe. This way, when the horizontal lines are inserted into the chart, they will be plotted with the timeframe settings.
MTF Lines also allows visibility control of another objets like rectangles, trend lines and texts.
This is a product developed by Renato Fiche Junior and available to all MetaTrader 4 and 5 users!

References: "A Modern Adaptation of the Wyckoff Method" "The Secret Science of Price and Volume" "Trades About to Happen" To know more, search on the internet: "The Wyckoff Method", "Weis Wave" and "Volume Spread Analysis"; Features 3 types of waves: bullish, bearish and unknown. The unknown wave comes when prices move in opposite the direction of the current wave. Label that shows the percentage remaining for the next wave. Allows you set the type of volume that will be accumulated in the wave
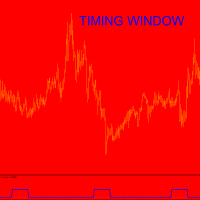
As for the cycle discussion, I invite you to read the TimingCycleWithLLV indicator presentation ...please ask me if something is not clear. I think that time is much more important than price;this is the reason for wich I trade only when one cycle finishes and the new one start. WHAT is Timing Window? It is a certain number of bars within which inversion is probable I do not know how much inversion will be....how many pips,BUT market will inverts with high probability.Time for inversion is ok. S

Funciona identificando picos de máximos y mínimos, para luego eliminarlos haciendo una linea o curva, pudiendo el usuario ingresar el valor de que tanto puede suavizar. Nos facilita poder ver la tendencia así como ver el cruce que puede hacer con otros indicadores, mostrando a simple vista los inicios y salidas de una tendencia u operación. Así también facilita la visualización de subidas y bajadas.
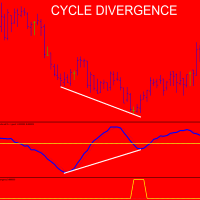
Please,put CycleDivergence in the same folder of TimingCycleWithLLV otherwise it does not run. As for the cycle discussion, I invite you to read the TimingCycleWithLLV indicator presentation ...please ask me if something is not clear. I think tha time is much more important than price;this is the reason for wich I trade only when one cycle finishes and the new one start. In order to use the CycleDivergence indicator follow these steps: 1) for example (see imagine number four) 1 minute chart,in t

Use of support and resistance in systematic trading is very subjective. Every trader has their own idea and way to plotting the support and resistance levels on the chart. KT Support and Resistance indicator take out this ambiguity out of the situation and automatically draws support and resistance levels following an algorithmic approach using a unique multi-timeframe analysis.
When launched on the chart, It immediately scan the most significant extreme points across all the available timefr
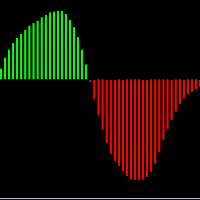
É um indicador oscilador baseado no "MACD" convencional porém com suavização . Através desse indicador você será capaz de operar sem os ruídos produzidos pelo indicador "MACD" convencional. Em quais ativos o indicador funciona: Em qualquer ativo do mercado, tanto em forex, como B3 ou binárias. Qual é o novo parâmetro: Smooth Period ou período de suavização, que representa o período que será suavizado no "MACD".

RSI with moving average is great to see when the price is overbought and oversold instead of RSI only.
INPU T PARAME TERS : RSI:
Period - RSI period.
Price - RSI applied price.
Color scheme - RSI color scheme (4 available). MOVING AVERAGE:
Period - MA period.
Type - MA type.
Apply - MA applica tion.
Shift - MA shif t (correc tion). PRICE LINE:
Show - specify if line with price, only line or nothing.
Style - line style. OTHER:
Overbought level - specify the level .
Overboug
FREE
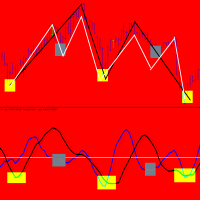
TimingCycleWithLLV is an excellent tool to determine the timing of your entry point! Everyone knows that cycles exist both in nature and in financial markets.Cycles are present in all time frames,from 1 minute to 1 year.Sometimes they are very clear to identify,others there is overlap between cycles of varyng duration. I can say this:the one-day cycle corresponds to the duration of a trading day( for example the one-day cycle for GERMAN DAX index is 14 hours as the trading day is 14 hours). Obvi
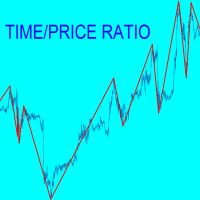
A chart is made by price and time but many traders consider only price.For each swing TIME-PRICE RATIO indicator shows in real time ratio between price/time and time/price. Moreover in the past you can read for each swing :number of pips;number of bars;ratio P/T and ratioT/P. Why it is usefull? because when P/T or T/P is a fibonacci ratio,the probabilities increase for inversion near support/resistance lines.During swing formation an audible alarm and a warning window advise you that a fibonac

In spite of a very simple indicator, it assists the trader who is eventually positioned several days in an operation if the asset swap is for or against its operation.
It is the ideal indicator for long-term operators.
The Swap is the rate that the operator pays for being positioned from one day to another or sometimes from week to week.
There are strategies that, besides a setup and risk management, also contemplate operating in favor of the Swap.

Indicador multi-nivel y multi-timeframe que permite seguir la tendencia del precio de cualquier par de divisas, metales, acciones, CFD's, etc. Intuitivo y fácil de aplicar sobre cualquier gráfico.
Parámetros: Timeframe : Marco de tiempo que se le aplicará al nivel Period : Periodo que se aplicará Applied Price : Precio a aplicar
Aplicaciones: Se puede usar aplicando diferentes niveles sobre el mismo gráfico, por ejemplo, in nivel de 8, 14, 20, etc.
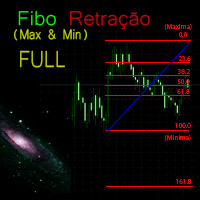
Functional in the Forex market. Functional in the B3 market - Bolsa Brasil Balcão.
Motivation The technical indicator of Fibonacci retraction for many is essential and the basis for all forecasts of market movements. The name of the tool comes from the Italian mathematician Leonardo de Pisa (13th century). This FULL version will work in Meta Trader 5 on any type of account.
This FULL version will work in Meta Trader 5 on any type of account.
To test on the DEMO account, download the free

Functional in the Forex market. Functional in the B3 market - Bolsa Brasil Balcão.
Motivation The technical Fibonacci retraction indicator for many is essential and the basis for all market movement forecasts. The name of the tool comes from the Italian mathematician Leonardo de Pisa (13th century).
This DEMO version will work in Meta Trader with Demo and Strategy Tester.
To purchase the Full version that works on a Real account, click on: https://www.mql5.com/en/market/product/38089
FREE

New Candle Alert is a simple indicator that notify you when a new candle is formed. Func tions : Alert type - option to choose between message with sound or only sound. Message - alert message. Push notifications - enable push notifications. Show timeframe - show the symbol timeframe. Show hour - show the alarm time. Test message - if you don't want to wait a new candle formed to see the message. MT4 version: https://www.mql5.com/pt/market/product/37988 Hope you enjoy it. Any doubt or su
FREE
MetaTrader Маркет - торговые роботы и технические индикаторы для трейдеров, доступные прямо в терминале.
Платежная система MQL5.community разработана для сервисов платформы MetaTrader и автоматически доступна всем зарегистрированным пользователям сайта MQL5.com. Ввод и вывод денежных средств возможен с помощью WebMoney, PayPal и банковских карт.
Вы упускаете торговые возможности:
- Бесплатные приложения для трейдинга
- 8 000+ сигналов для копирования
- Экономические новости для анализа финансовых рынков
Регистрация
Вход
Если у вас нет учетной записи, зарегистрируйтесь
Для авторизации и пользования сайтом MQL5.com необходимо разрешить использование файлов Сookie.
Пожалуйста, включите в вашем браузере данную настройку, иначе вы не сможете авторизоваться.