Смотри обучающее видео по маркету на YouTube
Как купить торгового робота или индикатор
Запусти робота на
виртуальном хостинге
виртуальном хостинге
Протестируй индикатор/робота перед покупкой
Хочешь зарабатывать в Маркете?
Как подать продукт, чтобы его покупали
Платные технические индикаторы для MetaTrader 4 - 114

Wind Dancer Indicator Ready to take control of your trading journey? The Wind Dancer Indicator is here to empower your strategies with a unique, visually intuitive approach. Designed with flexibility in mind, this indicator is not optimized, giving you the creative freedom to fine-tune and adapt it to your specific trading needs. How Does the Wind Dancer Indicator Work? The logic behind the Wind Dancer Indicator is a blend of sophisticated signals and a seamless visualization algorithm: Signal

Aurora Cross: Your Customizable Path to Trading Success! Price: $65
Explore More Tools and Strategies Here About This Indicator
The Aurora Cross Indicator is designed to empower traders to refine and optimize their strategies. It’s a versatile tool created specifically for you to customize and tailor to your unique trading approach. It is not pre-optimized, giving you complete freedom to experiment and find the perfect settings for your trading style. How It Works
At its core, the Aurora Cross

Cosmos Dance Indicator The Cosmos Dance Indicator is your next powerful tool in financial trading, designed for traders who value precision and flexibility. This indicator is not pre-optimized, giving you the freedom to fine-tune and adapt it to your specific trading strategy. With Cosmos Dance, you hold the reins to enhance your trading edge. Key Features and Logic: Clear Buy and Sell Signals: Visual arrows for "Buy" (green) and "Sell" (red) opportunities, helping you identify potential market

Not Optimized – Created for Your Custom Optimization! Introducing Diamond Crush – your pathway to mastering market squeezes! This indicator is designed to identify powerful trading opportunities by analyzing market conditions and visualizing key areas of market compression and expansion. Why Diamond Crush? Band Squeeze Analysis: Harness the power of dynamic upper and lower bands to capture market volatility and trend shifts effortlessly. Buy & Sell Signals: Visual cues guide you through potenti

Moon Touch Indicator Unlock the full potential of your trading strategy with the Moon Touch Indicator! This advanced tool is designed for traders who want to fine-tune their approach and optimize their results. While the indicator isn't pre-optimized, it gives you the flexibility to tailor it perfectly to your trading style and market conditions. How Does It Work? The Moon Touch Indicator is a versatile signal tool that works by identifying key market conditions: Buy and Sell Signals: Clearly m

Solar Flare Indicator The Solar Flare Indicator is a versatile and customizable tool designed for traders who value precision and adaptability. Built to empower traders of all levels, this indicator highlights key market dynamics to support strategic decision-making. Please note, the indicator is provided without pre-optimization, giving you the freedom to tailor its settings to your specific needs. Behind the Strategy – How It Works: The Solar Flare is rooted in a combination of technical anal

Unlock the Power of the Storm Break Indicator The Storm Break Indicator is a cutting-edge tool designed to identify precise market entry points using the proven logic of Bollinger Bands. While this indicator is not optimized out of the box, it offers you an exceptional opportunity to tailor it to your trading style and maximize its potential. What Makes the Storm Break Indicator Unique? Core Logic: The indicator leverages Bollinger Bands, a time-tested technical analysis tool, to identify overb

Visual EMA CrossPro - Your Ultimate Trading Companion! Are you ready to enhance your trading strategy with a powerful yet easy-to-use tool? Introducing the Visual EMA CrossPro, an intelligent indicator designed to help traders identify precise market entry and exit points based on EMA crossovers. For just $65, you get access to a reliable solution to simplify your trading journey. How It Works:
The Visual EMA CrossPro leverages two key EMAs (Exponential Moving Averages) to identify trends and

Visual EMA MultiFlex Indicator - Master the Trends with Precision! Achieve trading mastery with the Visual EMA MultiFlex Indicator, a dynamic tool designed to enhance your decision-making by combining the power of three Exponential Moving Averages (EMAs). Whether you're a beginner or an experienced trader, this indicator is your gateway to identifying precise market entries and exits. How It Works:
The Visual EMA MultiFlex Indicator leverages Short, Medium, and Long EMAs to analyze market momen

Visual EMA PriceSync Indicator Price: $65 Discover a cutting-edge trading indicator designed to synchronize price action with EMA (Exponential Moving Average) trends. The Visual EMA PriceSync Indicator is your ultimate tool for identifying precise market entry and exit points, making it an essential addition to any trader’s arsenal. What does it do?
The indicator detects crossover signals between the price and EMA, which signify potential trend reversals or market corrections. These signals are

The Visual EMA ReversalScout Indicator combines a powerful EMA crossover strategy with RSI-based divergence detection to generate reliable buy and sell signals. Its advanced logic ensures robust and actionable market insights while maintaining flexibility for optimization. Strategy Breakdown: EMA Crossovers: Uses Fast EMA and Slow EMA to identify trend directions and reversals. Bullish signals arise when the Fast EMA crosses above the Slow EMA, indicating an uptrend. Bearish signals occur when

Unleash Your Trading Potential with the Visual EMA SignalLine Pro! This innovative indicator is designed to revolutionize the way you approach trading. While it’s not pre-optimized, its raw power lies in its flexibility and precision, making it a must-have tool for traders eager to fine-tune strategies to their unique style. Why Choose the Visual EMA SignalLine Pro?
The indicator is built around the powerful concept of Exponential Moving Averages (EMA) combined with dynamic signal line strategi

Empower Your Trading Journey with the Visual EMA TrendForce! This advanced indicator is designed to give you the edge you need in the dynamic world of trading. Although it’s not pre-optimized, it provides a robust foundation for traders to customize and optimize according to their unique trading needs. Why Visual EMA TrendForce Stands Out
The indicator leverages the proven strength of Exponential Moving Averages (EMA) combined with trend-detection algorithms. Here’s how it can transform your tr

Visual CrossPulse Indicator The Visual CrossPulse Indicator is a tool designed for precision and ease, combining technical analysis with user-friendly features to identify profitable market opportunities. This hybrid strategy tool integrates the MACD (Moving Average Convergence Divergence) with an optional RSI (Relative Strength Index) filter, visually signaling high-probability trade setups for confident market entries. How It Works The indicator uses the MACD to detect trend momentum shifts.

HistoEdge Indicator HistoEdge is a powerful and customizable MetaTrader 5 indicator designed to provide insights for informed trading decisions. It is not optimized by default, allowing traders to fine-tune it according to their strategies. Key Features Utilizes the MACD histogram to highlight market momentum and potential reversals. Displays fast, slow, and signal periods for a comprehensive view of market dynamics. Fully customizable parameters, including fast period (default: 12), slow perio

Master the Market with the Visual SignalPro Divergence Indicator! Designed for traders who want to uncover hidden opportunities, this indicator is your gateway to identifying high-probability divergence setups. It’s not pre-optimized, giving you the freedom to fine-tune it to match your unique trading style and preferences. What Makes the Visual SignalPro Divergence Indicator Unique?
Divergence is a powerful concept that reveals when price action and momentum indicators move in opposite directi

MACD Momentum Shift Unleash the power of momentum in your trades with the MACD Momentum Shift, an advanced trading indicator based on the Moving Average Convergence Divergence (MACD). This tool is designed for traders who want to optimize and adapt it to their personal trading style. This indicator is not pre-optimized, allowing full customization. Modify MACD fast, slow, and signal periods, as well as the delay between signals, to match different market conditions and strategies. It provides c

Dragon State Indicator is a powerful trading tool designed to empower traders by giving them the foundation to optimize it further. This indicator is not optimized, making it a perfect choice for traders who love to tweak and customize trading tools to suit their unique strategies. The Logic Behind the Indicator The Dragon State Indicator identifies pivotal market movements using these components: Buy and Sell Signals: Buy Signal: Clearly displayed with lime-green arrows when conditions suggest
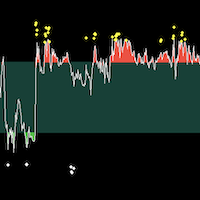
BS Trend Line For MT4是一款很好的买卖指示器,不含有未来函数,不会重绘,新版本已经加入了更好的过滤算法,开单成功率有了很大的提高,是一个很好的波段交易提示器,尤其是配合 SourcePoint For MT4 会有更明显的效果,它能帮你过滤掉接近70%以上的无效交易信号。 ===================参数列表===================== timeframe:M5
gip:30 sip:6 up line:80 down line:20 ===================使用方法===================== 配合 SourcePoint For MT4 使用时, SourcePoint For MT4 的参数 fastP: 96
slowP:208 avgP:72
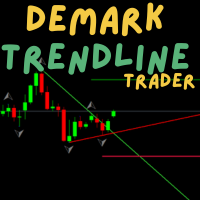
If you are unsure how to use this indicator, please feel free to reach out to me. I will explain it to you and provide reading materials to help you make the most of it. Most effective with TD sequential : MT4: https://www.mql5.com/en/market/product/129509?source=Site +Profile+Seller MT5: https://www.mql5.com/en/market/product/129507?source=Site +Profile+Seller My Other products: https://www.mql5.com/en/users/1700046313/seller
Here’s a brief description of how to use the

Trend Guardian Pro - Индикатор раннего прогнозирования трендов Trend Guardian Pro - это результат совместной работы команды профессиональных математиков, аналитиков и трейдеров. Индикатор создан на основе многолетнего анализа рыночных данных и использует передовые методы математического моделирования для раннего определения потенциальных изменений тренда. Ключевые особенности: Раннее прогнозирование - индикатор анализирует множество рыночных факторов для выявления признаков смены тренда до тог
Great For Binary options. Works on all timeframes. Recommended for M5 timeframe. one candle expiry. Experienced traders can explore. Strategy is based on price action and multi timeframe analysis. Recommended During high volatility sessions, like the London and new York sessions. For the M1(One minute) timeframe, Traders can use four or five candle expiry, this means it can be applied for 4, 5 or more minutes expiry.
For forex traders, I tested the indicator with the JesVersal universal EA:

Introducing the Phoenix Turn Indicator
The Phoenix Turn indicator is designed for traders who seek to harness the power of precise market-turn detection. This tool provides clear visual cues to identify potential buy and sell opportunities based on dynamic price-action and indicator-based logic. Why Choose Phoenix Turn? Unoptimized for Flexibility: This indicator is provided as a raw tool for you to optimize and customize, fitting perfectly with your unique trading strategy. Clear Visual Signal
The indicator can be used as a standalone trading system or can be part of any system you are currently using. This is because the indicator deals with the aspects of the market that are very important for any strategy. The indicator can be used to enter with or against the trend and also as a tool that shows the ideal exit position where you can close your trades. The indicator is very easy to use. All you need to do is attach the indicator to your chart and follow its signals according to your

Crystal Cross RSI Introducing the Crystal Cross RSI indicator—crafted for traders who seek control over their strategy! This tool is not pre-optimized, leaving room for you to fine-tune and adapt it to your trading style. Key Features: Clear Buy and Sell Signals: Lime arrows highlight buy opportunities, while red arrows signal sell entries—keeping your decisions sharp and informed. Dynamic RSI Analysis: The blue RSI line tracks market momentum, complemented by a signal line for precise crossing

Desert Mirage Indicator Take your trading to the next level with the Desert Mirage Indicator! Designed with flexibility in mind, this tool is your ultimate companion for identifying lucrative opportunities in the forex market. Please note: this indicator is not optimized—it’s built for you to customize and tailor to your unique trading style! Key Features: RSI-Based Signals: Harness the power of the Relative Strength Index (RSI) to spot overbought and oversold market conditions with ease. Gener

Introducing "Dragons Pulse" Are you ready to take your trading strategies to the next level? The Dragons Pulse Indicator is a powerful tool designed with flexibility in mind, empowering you to optimize it according to your unique trading style. While not pre-optimized, this indicator provides you with a foundation to unleash your creativity and craft strategies that truly work for you! Key Features: RSI-Based Insights: Uses the trusted Relative Strength Index (RSI) to analyze market momentum. P
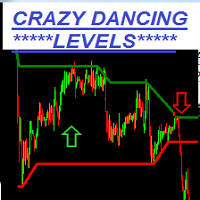
Crazy Dancing moving RES/SUP Levels Automatic redrawing of moving Supports and resistances levels to indicate price breaking supports (signal SELL) or breaking resistance levels (signal BUY) Very simple appearing indicator but very clever and smart too !!!! Main Inputs: # of bars for the support and resistances levels + the initial shift from start + moving average for filter signaling Smaller values for bars /shift inputs when using Higher Time frames (D1-H4) and the reverse higher values for

Introducing the Phoenix RSI Indicator – your gateway to mastering market momentum and identifying profitable trading opportunities! Designed for traders who value control, this indicator comes pre-equipped with powerful features but is intentionally left unoptimized to empower YOU to tailor it to your unique trading strategy. What Makes the Phoenix RSI Indicator Special? Customizable RSI Analysis :
Visualize market momentum with a sleek RSI line directly on your chart.
Adjust the RSI period to

Introducing the Thunder Wave Indicator The Thunder Wave Indicator is a powerful tool designed for traders who love to optimize and tailor their strategies. This indicator is not pre-optimized, giving you full control to adjust it according to your trading style and market conditions. Why Choose Thunder Wave? The Thunder Wave Indicator leverages the Relative Strength Index (RSI) to deliver actionable insights, while incorporating delay and visualization features to ensure precision and clarity.

LevelGuard SmartSMA Indicator Master Support & Resistance Analysis with Precision LevelGuard SmartSMA is a powerful tool designed to simplify your trading decisions by identifying dynamic support and resistance levels. This indicator leverages moving averages to provide precise insights into market movements, helping traders master their strategy with confidence. How It Works Core Strategy: Uses a central SMA (e.g., 50 or 200-period) as a dynamic support or resistance line. Additional SMAs (opt
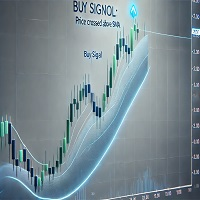
The PriceBreak SmartSMA Indicator is designed for traders who want a powerful price action tool with full customization options. It offers valuable insights into market trends and potential trading opportunities, allowing you to refine your strategy to fit any market condition. How It Works SMA Crossover Logic Uses a 20-period SMA (customizable) to identify market trends. Buy Signals: Triggered when price crosses above the SMA. Sell Signals: Triggered when price crosses below the SMA. You can a

The "Pure Directional SMA Indicator" is a powerful tool designed for traders seeking precise trend direction and actionable signals. This indicator is not pre-optimized, offering flexibility to tailor it to your unique trading style and market preferences. The Logic Behind the Indicator:
At its core, this indicator uses Simple Moving Averages (SMAs) to determine trend direction and generate buy/sell signals. Here's how it works: Three SMA Lines: Short SMA : Reacts quickly to price changes, ide

Индикатор силы быков и медведей Обновление 1.3
Индикатор силы быков и медведей теперь включает встроенный профиль объема для обнаружения областей с самым высоким объемом в пределах заданного диапазона бара. Этот профиль можно дополнительно настроить в соответствии с вашими предпочтениями для более точного определения силы быков и медведей с максимальным объемом.
Это помогает в: Раннем обнаружении и возможностях для точного входа. Обнаружении разворотов. Обнаружении откатов. Обзор:
Индикатор с
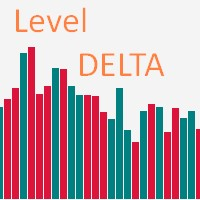
Индикатор Level DELTA для MetaTrader 4 (MT4) – мощный инструмент анализа объемов, который выделяется своими возможностями и точностью. Описание индикатора Индикатор Level DELTA создан для анализа объемов в отдельном окне платформы MT4. Его главная задача – выявление и отображение дивергенций, что позволяет трейдерам принимать более обоснованные и своевременные решения. Особенности индикатора Анализ объемов : Индикатор анализирует объемы на финансовых рынках, что позволяет видеть, как распределяю
Engulfing Pattern Indicator Introducing the Engulfing Pattern Indicator. Are you ready to take your trading strategy to the next level? The Engulfing Pattern Indicator is your ultimate tool to spot powerful market reversals and trends based on the time-tested Engulfing Candlestick Pattern. This indicator is crafted to provide you with actionable insights, but remember: it’s not optimized—you have the freedom to optimize it to suit your trading needs. Why the Engulfing Pattern? The Engulfing Pat

Unleash the power of precision trading with the RangeRider SmartSMA Indicator!
This tool is not optimized, providing you with the ultimate freedom to customize it according to your trading strategy. Perfect for traders seeking control and adaptability, this indicator is designed to help you refine your approach and optimize for success. How it Works:
The RangeRider SmartSMA Indicator combines Simple Moving Average (SMA) calculations with Range and Relative Strength Index (RSI) thresholds to pro

The Visual SmartSMA Indicator MT4 is a versatile tool designed to assist traders in identifying potential buy and sell signals based on Simple Moving Average (SMA) crossovers. With advanced customization options and additional divergence analysis, this indicator provides a clear visual representation of potential market entries while allowing traders to tailor the strategy to their preferences. Features and Highlights: SMA Crossover Detection : Tracks Fast and Slow SMA interactions to generate

Visual Simple Cross Indicator Unlock the power of moving average crossovers with this sleek, fully visual indicator designed to help you identify buy and sell opportunities directly on your chart. The Visual Simple Cross Indicator is simple yet versatile, catering to traders who prefer a no-frills approach to trend-following strategies. Features & Benefits: Customizable Moving Averages: Configure the fast and slow MA periods, methods, and applied prices to suit your trading style. Clear Buy & S

Unlock the Power of Precision with the Storm Peak Indicator! The Visual Storm Peak Indicator is a sophisticated, signal-driven tool designed for traders who seek clear and actionable market insights. It's built on a robust logic foundation, leveraging the Commodity Channel Index (CCI) to identify market peaks and reversals effectively. While the indicator comes with a pre-set structure, it has been specifically created for you to optimize and adapt to your unique trading style. Why Choose the S

Wind Shift Indicator Are you ready to harness market shifts with precision? The Wind Shift Indicator is your tool for identifying potential reversals and trend continuations. Designed for traders who prefer to fine-tune their tools, this indicator is not optimized, giving you the freedom to tailor it to your unique trading style. Logic Behind the Strategy: The Wind Shift Indicator employs a combination of Commodity Channel Index (CCI) logic and visual signal plotting to detect shifts in market
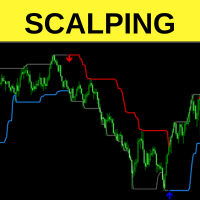
Название индикатора: Scalping Channel System Описание: Индикатор Scalping Channel System — мощный инструмент для анализа рыночных тенденций и поиска потенциальных точек входа. Он создан для удобства трейдера и минимизации необходимости постоянного мониторинга рынка. Индикатор отправляет PUSH и EMAIL уведомления, когда появляется сигнал для открытия сделки, что позволяет трейдеру не сидеть всё время у экрана. Преимущества индикатора: Визуально понятные стрелочные сигналы для удобного анализа. Ком

The Market Strength Indicator (MSI) is yet another in our stable of volume-based indicators, and as such, is a must-have tool for trading virtually any type of market and across a myriad of applications from trend trading to swing trading, scalping, and much more. While its sister indicator, the Currency Strength Indicator (CSI), helps you analyze which currencies are oversold, overbought, correlating, and trending, the MSI or Market Strength Indicator does this also, but in this case, for all m

The VRSI indicator is another in the suite of volume indicators we have developed and one that complements our volume price analysis methodology perfectly. and was developed out of a desire to build further on our cornerstone of VPA by peeling back the layers of volume and considering the relative aspect of volume. Hence, the acronym of Volume Relative Strength Index indicator encapsulates what the indicator is all about. By analyzing relative volume, we are able to see a visual representation o

The VWAP indicator is another of our suite of volume indicators and one which was first referred to in 1988 when it appeared in an article entitled “The Total Cost Of Transactions On The NYSE” in the March edition of the Journal Of Finance from that year, which went on to explain its importance, particularly from an institutional perspective, which underpins its significance in appreciating the power and importance of this indicator. In many ways, it is akin to the volume price analysis methodol

The Fibonacci Confluence Toolkit is a technical analysis tool designed to help traders identify potential price reversal zones by combining key market signals and patterns. It highlights areas of interest where significant price action or reactions are anticipated, automatically applies Fibonacci retracement levels to outline potential pullback zones, and detects engulfing candle patterns. Its unique strength lies in its reliance solely on price patterns, eliminating the need for user-define
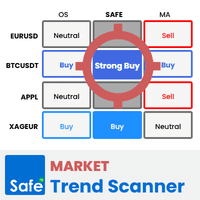
Market Trend Scanner is a trend analyzer or trend screener indicator that helps you know the trend in selected timeframe of all symbols you're watching .
This indicator provides clear & detailed analysis results on a beautiful dashboard, let you able to use this result right away without need to do any additional analysis. How it works
Step 1: Calculate values of 23 selected & trusted technical indicators (Oscillator & Moving Average indicators)
Step 2: Analyze all indicators using best pr

Unlock Precision with ATR Bands Expansion Indicator The ATR Bands Expansion Indicator is your gateway to identifying dynamic price movements and breakout opportunities in the financial markets. Designed to enhance your trading strategy, this tool uses Average True Range (ATR) principles to create adaptive bands that expand and contract based on market volatility. Key Highlights: Not Optimized: This indicator is designed for you to optimize according to your trading preferences and market condit

Unlock the Power of Trend Dynamics with ATR Bands Midline Trend Indicator! The ATR Bands Midline Trend Indicator is a meticulously crafted tool designed to help traders identify trends with precision using the Average True Range (ATR) as a foundation. This indicator focuses on calculating a midline derived from ATR bands, providing a unique perspective for traders to detect trend direction and strength effectively. Important: This indicator is not optimized, leaving the door open for you to tai

Unlock Your Trading Potential with the ATR Bands Touch Indicator! The ATR Bands Touch Indicator is a dynamic tool designed to identify key price interactions with the Average True Range (ATR) Bands. Built to assist traders in spotting significant touchpoints where price momentum aligns with volatility boundaries, this indicator provides a strategic edge in identifying potential trend shifts or breakout zones. Key Features and Logic Behind the Indicator: Core Strategy: The ATR Bands are calculat

Unoptimized and Designed for You to Customize The Mercury Track Indicator is a powerful trading tool created with flexibility in mind, allowing you to tailor it to your trading strategies and market conditions. Out of the box, it provides insightful signals, but it’s meant for traders to optimize and enhance according to their unique preferences and trading styles. Logic Behind the Strategy
At its core, the Mercury Track Indicator employs a combination of signal generation and dynamic band plot

Take control of your trading decisions with the 'Visual Venus Guard Indicator'! This advanced indicator offers a versatile framework designed to assist you in identifying potential market turning points. Created with a focus on customization, it empowers YOU to optimize it according to your unique trading strategy. The Strategy Behind the 'Visual Venus Guard Indicator'
The 'Visual Venus Guard Indicator' uses a comprehensive algorithm to identify critical price zones and reversal patterns, provi

Visual Envelope Indicator is designed for traders who want a clear visual representation of market trends, potential reversals, and price dynamics within defined envelope boundaries. This indicator simplifies market analysis, offering a unique perspective for crafting your trading strategy. Please note that this indicator is not optimized—it's intentionally built for you to optimize it according to your trading style and goals. Strategy and logic behind the indicator
The Visual Envelope Indicat

Visual Envelope Price Cross Indicator Unlock the power of price envelope dynamics with the Envelope Price Cross Indicator. This tool is designed to identify potential trade opportunities by analyzing price movements relative to the envelope bands. It is a valuable addition to your trading arsenal, providing insights into trend continuations, reversals, and market momentum. Important: This indicator is not optimized. It is created for you to optimize and fine-tune to match your trading strategy.

Optimize Your Strategy with the Envelope Support Bounce Indicator! The Visual Envelope Support Bounce Indicator is designed as a tool for traders who want to unlock the potential of envelope-based strategies in their trading. This indicator is not pre-optimized, allowing you to fully customize and optimize it to suit your trading style and preferences. Whether you're a scalper, day trader, or swing trader, the flexibility of this tool makes it an invaluable addition to your arsenal. What does i

Welcome to the Visual Envelope Trend Flow Indicator! This tool is not optimized and has been crafted specifically for you to explore, test, and fine-tune according to your unique trading strategy. It offers flexibility and a powerful starting point for traders aiming to master trend identification and price flow dynamics. The Visual Envelope Trend Flow Indicator leverages the concept of envelope channels, which are dynamic boundaries drawn around price action. These boundaries are calculated ba

The Range Directional Force Indicator is designed to help traders analyze market trends, reversals, and directional strength. It focuses on price movements within defined ranges, identifying key moments when the market is gaining momentum or preparing for a shift. By dividing the chart into dynamic price ranges, the indicator detects critical support and resistance levels. It calculates the directional force of price movements, highlighting potential entry and exit points based on market sentim

The Visual Dragon Cloud Indicator is designed to help traders analyze market behavior through trend identification, support and resistance levels, and potential reversals. It adapts to changing market conditions by using cloud formations to highlight momentum shifts and price direction. This tool provides traders with key price zones for entries and exits based on how price interacts with the cloud. When price moves into or out of specific cloud layers, it signals possible bullish or bearish tr

This indicator is designed to help you forecast the potential high and low prices for the current trading day, based on the high and low of the previous day. It does this by applying a customizable percentage increase or decrease to those levels. How It Works: The idea is simple: It looks at the previous day's high and low prices and then adjusts them by a percentage you choose. Here's what that means: Predicted High : This is calculated by taking the high price of the previous day and adding a
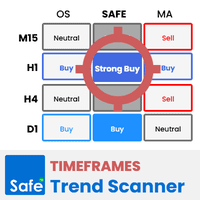
Timeframes Trend Scanner is a trend analyzer or trend screener indicator that helps you know the trend in all timeframes of selected symbol you are watching .
This indicator provides clear & detailed analysis results on a beautiful dashboard, let you able to use this result right away without need to do any additional analysis. How it works
Step 1: Calculate values of 23 selected & trusted technical indicators (Oscillator & Moving Average indicators)
Step 2: Analyze all indicators using best pra

Visual Eagle Dive Indicator The Eagle Dive Indicator is your ultimate tool for analyzing and interpreting market movements with precision. This powerful indicator is designed to help you visualize key market trends and patterns, but it is not optimized. It has been intentionally created for you to customize and optimize according to your trading style and preferences. Key Features and Entry Logic Market Diving Signals: The Eagle Dive Indicator identifies critical market movements, resembling th

Unleash the Power of Market Dynamics with the Vortex Indicator! The Visual Vortex Indicator is your advanced tool for decoding market trends, reversals, and momentum shifts. Priced at $65, this indicator provides a comprehensive view of market behavior, but it’s designed for you to fine-tune and optimize it according to your unique trading strategy. What Makes It Unique?
The Vortex Indicator is based on a strategy that identifies directional movements and trend strength by analyzing key price d

Visual Vortex Momentum Shift Indicator Unlock the potential of momentum shifts in the market with the Visual Vortex Momentum Shift Indicator! This advanced tool is designed to help traders identify crucial turning points and momentum reversals with clarity and precision. However, this indicator is not optimized and is created for you to optimize based on your trading preferences and strategies. What is the Visual Vortex Momentum Shift Indicator? The indicator focuses on detecting momentum shift
Explore the Power of Precision with the Range Indicator! This cutting-edge indicator is designed to provide traders with a detailed analysis of market range movements. However, it is essential to note that the Visual Range Indicator is not optimized—it has been crafted for you to tailor it to your trading needs and optimize it for your unique strategy. Your mastery and customization will unlock its true potential! The Strategy Behind the Range Indicator
The Visual Range Indicator focuses on id

In the rapidly changing financial markets, finding reliable trading signals is the key to success!
In trading, the timing of entry is everything!!
Whether you are a short-term trader or a long-term investor, this indicator can provide you with the most accurate entry signals, helping you to seize market opportunities and become your most powerful trading assistant!
MT5: https://www.mql5.com/en/market/product/129934 Features: Accurate Entry Signals: Based on advanced algorithms and real-tim

Summary: This indicator calculates histograms representing bullish and bearish impulses relative to a moving average. The impulses are determined by the difference between the high/low prices and the MA, normalized by the point value. Higher values in the Bulls array indicate stronger bullish pressure, while higher values in the Bears array indicate stronger bearish pressure.
Key features:
Colors: Uptrend chart is displayed in green and downtrend chart is displayed in red.
Automatic identi
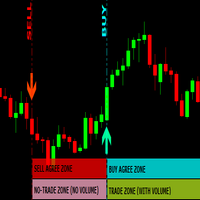
non-repaint free MT4 technical indicator works on all timeframes 1 minute to the monthly timeframe the trade vision buy and sell arrow is a multi currency and synthetic indicator Trade vision buy and sell arrow comes with Push Alerts purple arrow look for selling opportunities white arrow look for buying opportunities. wait for candle to close and arrow to appear before taking any trades
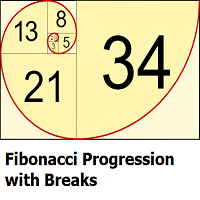
This indicator highlights points where price significantly deviates from a central level. This deviation distance is determined by a user-set value or using a multiple of a period 200 Atr and is multiplied by successive values of the Fibonacci sequence. Settings
Method: Distance method, options include "Manual" or "Atr"
Size: Distance in points if the selected method is "Manual" or Atr multiplier if the selected method is "Atr"
Sequence Length: Determines the maximum number of significant devia
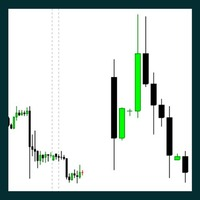
The Indicator is useful for professional trader, such as ICT , Smart Money Concept trader; who do the top-down analysis and want to display the candles of the Higher Timeframe on the Lower Timeframe. It allows you to stay in your entry timeframe while following the narrative of the Higher timeframe. Here are some easy input: Number Of Bars: The total of HTF's candle you want to display. Auto Timeframe: If true, the indicator will recommend the Higher timeframe that suit the current timeframe you

Индикатор DYJ BoS MT4 автоматически определяет и отмечает основные элементы изменений структуры рынка, включая:
Прорыв структуры (BoS): обнаруживается, когда цена совершает значительное движение, прорывая предыдущую точку структуры.
Он отмечает возможные линии восходящего тренда и линии нисходящего тренда (UP & DN, то есть непрерывные новые максимумы и новые минимумы), и как только цена пробивает эти линии, он отмечает красные (МЕДВЕДЬ) и зеленые (БЫЧЬИ) стрелки.
BoS обычно происходит, когда
MetaTrader Маркет предлагает каждому разработчику торговых программ простую и удобную площадку для их продажи.
Мы поможем вам с оформлением и подскажем, как подготовить описание продукта для Маркета. Все продаваемые через Маркет программы защищаются дополнительным шифрованием и могут запускаться только на компьютере покупателя. Незаконное копирование исключено.
Вы упускаете торговые возможности:
- Бесплатные приложения для трейдинга
- 8 000+ сигналов для копирования
- Экономические новости для анализа финансовых рынков
Регистрация
Вход
Если у вас нет учетной записи, зарегистрируйтесь
Для авторизации и пользования сайтом MQL5.com необходимо разрешить использование файлов Сookie.
Пожалуйста, включите в вашем браузере данную настройку, иначе вы не сможете авторизоваться.