Смотри обучающее видео по маркету на YouTube
Как купить торгового робота или индикатор
Запусти робота на
виртуальном хостинге
виртуальном хостинге
Протестируй индикатор/робота перед покупкой
Хочешь зарабатывать в Маркете?
Как подать продукт, чтобы его покупали
Платные технические индикаторы для MetaTrader 4 - 112
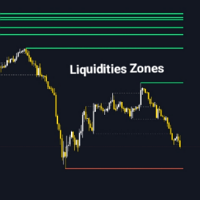
Liquidity Zone Detector — это продвинутый технический индикатор, разработанный для выявления и выделения ключевых зон ликвидности на рынке с использованием индикатора ZigZag. Этот инструмент определяет ценовые уровни, на которых, вероятно, сосредоточена значительная ликвидность, с помощью построения трендовых линий на максимумах и минимумах, определённых ZigZag. Liquidity Zone Detector помогает трейдерам обнаруживать потенциальные зоны разворота или продолжения тренда на основе накопления или вы
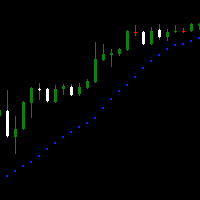
Доброго времени суток.
Вашему вниманию простой, но крайне удобный продукт для любителей индикатора Parabolic SAR . Он представляет собой окно осциллятора, на который выводится несколько тайм-фреймов в режими реального времени вместе с индикатором.
Настройки интуитивно понятные, что бы включать и отключать количество выбранных таймов - необходимо применять PERIOD_CURRENT, в таком случае дополнительный тайм не откроется.
Пишите в комментариях к продукту, что бы вы хотели увидеть в новых вер
Что такое "Real Time MultiIndicator"? "Real Time MultiIndicator" — это продвинутый торговый инструмент, разработанный для упрощения и оптимизации вашего технического анализа. Этот революционный индикатор собирает сигналы с различных временных интервалов и технических индикаторов, отображая их в единой, понятной и легко читаемой таблице. Если вы хотите получить полное и детализированное представление о рынке без необходимости постоянно переключать графики или вручную анализировать каждый индикато
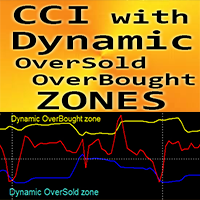
Forex Indicator " CCI with Dynamic OverSold/OverBought zones " for MT4. C ommodity Channel Index (CCI) is excellent for Momentum trading into the trend direction. It is great to take Sell entries from dynamic OverBought zone and Buy entries from dynamic OverSold zone into the direction of main trend T his indicator is excellent to combine with Price Action entries as well . D ynamic OverBought zone - above yellow line
Dynamic OverSold zone - below blue line
CCI oscill
MACD Indicator The Moving Average Convergence and Divergence (MACD) is a trend following momentum indicator which shows the relationship between two moving averages that we chose and configure them on the indicator. The MACD is calculated by subtracting the 26-period exponential moving average and the 12 period D.A.M. These are the default parameters when you put the MACD indicator on the charts, and the period is usually 9 which means the last 9 candles. DT-Oscillator This is Robert C. Miner's
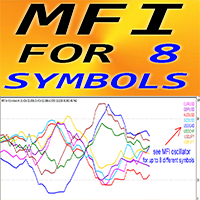
Forex Indicator "MFI for 8 Symbols" for MT4. M oney Flow Index (MFI) is a technical oscillator which uses price and volume data for identifying oversold and o verbought zones It is great to take Sell entries from Overbought when the MFI is above 80 and Buy entries from Oversold when it is below 2 0 MFI is very useful for divergence detection and it is great to combine with Price Action as well "MFI for 8 Symbols" gives opportunity to control MF I values of up to 8 diff

Продукт "Super Trampoline" – это инновационный индикатор для трейдинга, созданный для того, чтобы упростить процесс принятия решений на финансовых рынках. Он анализирует данные графика и предоставляет четкие и своевременные сигналы о том, когда лучше купить или продать актив, основываясь на проверенной стратегии анализа свечных паттернов. Преимущества продукта: Интуитивно понятный интерфейс : "Super Trampoline" интегрируется прямо в ваш торговый терминал, отображая сигналы в виде простых стрелок

Представляю "Super Transplant with Filter" — инструмент, который способен изменить вашу торговую стратегию. Этот индикатор создан для трейдеров, которые ценят точность, надежность и простоту. В нем сочетаются передовые методы анализа трендов и интеллектуальная фильтрация сигналов, что позволяет вам принимать решения, основываясь на наиболее актуальных данных. Преимущества "Super Transplant with Filter": Точность в каждой сделке : Индикатор тщательно анализирует рыночные данные, выявляя ключевые
СКИДКА С 77,90 USD ДО 37,90 USD, ДЕЙСТВУЮЩАЯ ДО ВОСКРЕСЕНЬЯ, 1 СЕНТЯБРЯ Что такое "Forex Scanner"? "Forex Scanner" — это мощный торговый инструмент, предназначенный для того, чтобы предоставить вам полное представление о рынке Форекс в режиме реального времени. Этот продвинутый индикатор собирает ключевые данные из нескольких технических индикаторов и временных рамок, позволяя вам быстро выявлять торговые возможности. Если вы хотите отслеживать многочисленные активы и параметры, не переключаясь
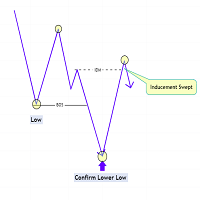
The Market Structure with Inducements & Sweeps indicator is a unique take on Smart Money Concepts related market structure labels that aims to give traders a more precise interpretation considering various factors.
Compared to traditional market structure scripts that include Change of Character (CHoCH) & Break of Structures (BOS) -- this script also includes the detection of Inducements (IDM) & Sweeps which are major components of determining other structures labeled on the chart.
SMC &
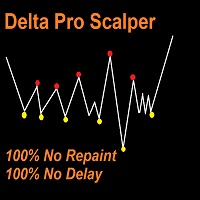
Delta Pro Scalper - Your Ultimate Trend Trading Solution, Delta Pro Scalper is a TREND indicator that automatically analyzes the market and provides information about the trend without redrawing or delay.
The indicator uses candlestick OHLC data and analyzing them to determine up trend or down trend, You MUST wait till closing candle, once the dot appear the next open candle you can open buy or sell position. Red Dot = Bearish Trend (Open SELL)
Yellow Dot = Bullish Trend (Open BUY) Here's th
A Full Concept of BUY/SELL Scalping Strategy Trend detection is one of the basic challenges of every trader. Finding a way to tell when to enter a trade is very important, timing is a game changer, not too early and not too late. Sometimes, due to not knowing the market conditions, the trader closes his positions with a small profit or allows the losses to grow, these are the mistakes that novice traders make. Indicator Trend Whipper is a complete trading strategy and can improve the trader's tr
Scalping Strategy BUY SELL
Having a strategy in the market is one of the main conditions for trading. The presence of various and complicated indicators and tools sometimes makes trading difficult, and the user gets confused after trying various methods and gets stuck in a loss cycle, the result of which is usually clear. This indicator is a simple strategy based on the detection of pivots and short-term trends, which helps you to easily trade in trends. Sometimes a simple but efficient st
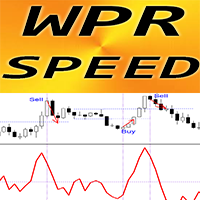
Forex Indicator "WPR SPEED" for MT4 - great predictive tool! The calculation of this indicator is based on equations from physics . WPR SPEED is the 1st derivative of WPR oscillator itself WPR SPEED is good for scalping entries on sideways and flat markets WPR SPEED indicator shows how fast WPR itself changes its direction - it is very sensitive It is recommended to use WPR SPEED indicator for momentum scalping trading strategies: find big size peaks of indicator - open scalping t
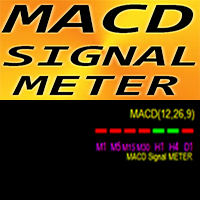
Forex Indicator MACD Signal METER for MT4 Very useful MACD Signal METER indicator is showing current MACD value (above/below Signal) for 7 time frames simultaneously Green box - MACD is above Signal Red box - MACD is below Signal Forex Indicator MACD Signal METER can be used as trade entry filter for Multi Time Frame trading
// More great Expert Advisors and Indicators are available here: https://www.mql5.com/en/users/def1380/seller It is original product which is offered only on t
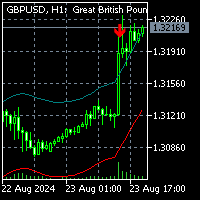
To get access to MT5 version click here . This is the exact conversion from "Nadaraya-Watson Envelope" by " LuxAlgo ". (with non-repaint input option) This is not a light-load processing indicator if repaint input is set to true . All input options are available. Buffers are available for processing in EAs. I changed default input setup to non-repaint mode for better performance required for mql market validation procedure . Here is the source code of a simple Expert Advisor operating

Выпадающее меню для трендовых линий и прямоугольника. Позволяет редактировать цвет, стиль и толщину. При выделении линии появляется меню, каждая функция разделена. Можно сразу нажать и поменять на нужное. Толщина меняется по другому, нужно нажать на цифру, она станет в синем цвете, нажать нужную цифру от 1 до 4, в зависимости от нужной толщины, нажать интер.
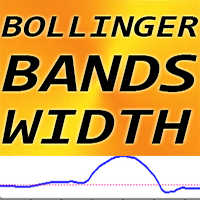
Forex Indicator Bollinger Bands Width for MT4, No Repaint. -BB Width indicator is applicable for using together with standard Bollinger Bands indicator. -This software is must have for every Bollinger Bands indicator fan, because their combination is very efficient to trade Breakouts -BB Width indicator shows the distance (span) between Bollinger Bands. HOW TO USE BB Width (See the example on the picture): 1) Find the lowest value of BB Width of the last 6 months and add 25% to this value
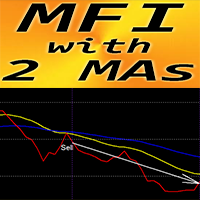
Forex Indicator "MFI and 2 Moving Averages" for MT4 M oney Flow Index (MFI) is a technical oscillator which uses price and volume data for identifying oversold and o verbought zones " MFI and 2 Moving Averages" Indicator allows you to see Fast and Slow Moving Averages of MFI oscillator Indicator gives opportunities to see the trend change very early It is very easy to set up this indicator via parameters, it can be used on any time-frame You can see Buy and Sell entry cond

WaPreviousCandleLevels MT4 shows the previous candle levels, it shows the previous candle Open High Low Close levels (OHLC Levels) in different time frame. It's designed to help the trader to analyse the market and pay attention to the previous candle levels in different time frame. We all know that the OHLC Levels in Monthly, Weekly and Daily are really strong and must of the time, the price strongly reacts at those levels. In the technical analysis, the user can use them as a support and res
А знаете ли вы, почему MetaTrader Market - лучшее место для продажи торговых стратегий и технических индикаторов? Разработчику у нас не нужно тратить время и силы на рекламу, защиту программ и расчеты с покупателями. Всё это уже сделано.
Вы упускаете торговые возможности:
- Бесплатные приложения для трейдинга
- 8 000+ сигналов для копирования
- Экономические новости для анализа финансовых рынков
Регистрация
Вход
Если у вас нет учетной записи, зарегистрируйтесь
Для авторизации и пользования сайтом MQL5.com необходимо разрешить использование файлов Сookie.
Пожалуйста, включите в вашем браузере данную настройку, иначе вы не сможете авторизоваться.