Watch the Market tutorial videos on YouTube
How to buy а trading robot or an indicator
Run your EA on
virtual hosting
virtual hosting
Test аn indicator/trading robot before buying
Want to earn in the Market?
How to present a product for a sell-through
Paid Technical Indicators for MetaTrader 4 - 112

Scalping Worm is an essential tool for every trader aiming to improve the accuracy of their market entries and exits. With its advanced weighted moving average formula and adaptive smoothing logic, this indicator not only captures the current trend direction but also helps determine its strength and stability. The blue line signals an uptrend, while the red line indicates a downtrend, making analysis highly intuitive and visually straightforward. The main advantage of this indicator is its abili
The MarketPrice Indicator is designed to provide a quick, one-glance visualization of the trend direction for a currency pair across all time frames (Time Frames), streamlining decision-making. MarketPrice Indicator is based on daily levels and trading signals derived from moving average crossovers and market strength according to various technical indicators. It comes fully configured, though you can, of course, modify any parameters as desired. Indicator Logic The indicator uses a combination

Hey there! If you are using Moving Average indicator into RSI indicator's window and always wondering if there could be a way to get alerts on your smartphone when those two indicators get a crossover that would be great, right!? Then you have found the right tool for that. This indicator is nothing but a mix of MA indicator and RSI indicator into one indicator window as well as it will give you alerts for crossovers on your smartphone app, email and also on your trading terminal's (desktop) cha

Real Spread Monitor is a powerful indicator that is designed to accurately measure and analyze real spreads, giving traders the ability to compare trading conditions of different brokers. This product is also available for MetaTrader 5 => https://www.mql5.com/en/market/product/125768 Key Features of Real Spread Monitor:
1. Two modes of operation: Write mode : In this mode the indicator collects data on real spreads of the selected trading instrument and records them in a file. The spread is r
Signals for entering and exiting trades for gold, oil, currencies, crypto - all in MT4 without redrawing and with a trend forecast. Even a beginner can easily trade on any timeframe. Flexible and accurate algorithm for auto-tuning signals that can be seen on the screen, heard in English, received on a smartphone.
The indicator has a system of hints for training the user. Hover the mouse pointer over any object and you will see. Instead of a user manual, download a free demo version and study
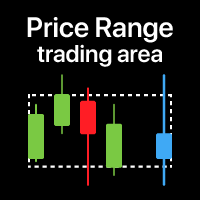
Price zone: v isualization of the trading range for the selected time period E specially useful when trading on low timeframes , so that you can see the range from a higher TF . My #1 Utility : 66+ features, including this indicator | Contact me for any questions | MT5 version When it might be useful: When using multiple time frames To see the overall picture from a different period To see the entire range for the selecte
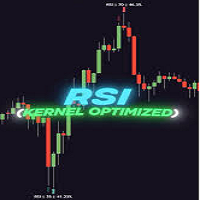
GENERAL OVERVIEW
Introducing our new KDE Optimized RSI Indicator! This indicator adds a new aspect to the well-known RSI indicator, with the help of the KDE (Kernel Density Estimation) algorithm, estimates the probability of a candlestick will be a pivot or not. For more information about the process, please check the "HOW DOES IT WORK ?" section. Features of the new KDE Optimized RSI Indicator :
A New Approach To Pivot Detection
Customizable KDE Algorithm
Realtime RSI & KDE Dashboard
Alert

Indicator detects long bars. How to use:
base = base value in points of our long bar if this value is larger than bar we have our signal. useSplit = when we want to divide our trading into two before and after preset time. Both before and after work the same as our base . splitTimeHour = split time hour 14:00 would be 14. splitTimeMinute = split time minute 14:30 would be 30. before = same as base long bar value in points. after = same as base long bar value in points. useATR = instead o

To meet the need for quick and accurate decision-making in the market, we have launched this exceptional trend indicator. It is designed to provide clear trend analysis for your trading, reducing unnecessary noise and making trading simpler and more effective. Key Highlights and Advantages : No Redrawing : Once signals are generated, this indicator does not change with market fluctuations, ensuring the stability of your trading decisions. This avoids the confusion caused by redrawing and gives
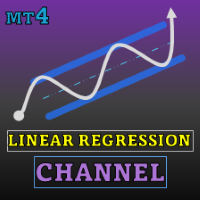
Special offer : ALL TOOLS , just $35 each! New tools will be $30 for the first week or the first 3 purchases ! Trading Tools Channel on MQL5 : Join my MQL5 channel to update the latest news from me The Linear Regression Channel Indicator is a powerful technical analysis tool that helps traders capture price trends and potential reversal points. By calculating and displaying linear regression channels, bands, and future projections, this indicator offers an in-depth perspective on m

The AI Trading Consultant is an advanced indicator designed for traders seeking a reliable technology-based tool for analyzing and understanding markets. Powered by a long short-term memory recurrent neural network ( RNN LSTM ), the AI Trading Consultant provides clear buy and sell signals, helping identify potential market movements and supporting trading decisions. Key Features: Advanced Artificial Intelligence (RNN LSTM)
This indicator uses a recurrent neural network with long-term memory, e
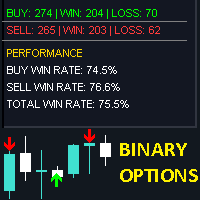
NO REPAINTER is a mt4 arrow type indicator based on divergence strategy, the indicator was made to trade binary options as it helps traders take call/buy put/sell decisions, the indicator has TP and SL inputs in form of expiry bars, if set to one TP and one SL than your expiry is the next candle after arrow candle close. The indicator comes with stats panel that accurately measures and calculate the win rate over the past x number of history data, the indicator is suitable for bots as it has i
To get access to MT5 version please contact via private message. You can also check the other popular version of this indicator here . This is the exact conversion from TradingView:"Optimized Trend Tracker" by "kivancozbilgic" The screenshot shows similar results from tradingview and Metatrader when tested on ICMarkets on both platforms. This is a light-load processing indicator. It is a non-repaint indicator. Highlighting option is not available due to MT4 restricted graphics. Buffers are avai

The real market buy/Sell signals, you can trust.
This indicator tracks the trend strength, the market strength, the real current volume, and the price direction to give traders and investors the optimum point for entry in the form of signals. The time frames range from 5 minutes to one (1) hour chart.
Trading on higher time frames produce the best outcomes, but also do produce less frequent trades, compared to trading on lower time frames.

The Wolf Wave Finder Indicator is a popular indicator, that is useful in identifying potential trading opportunities. The indicator works by recognizing the Wolf Wave pattern, which is a well-known pattern used by professional traders to identify potential areas of support and resistance. The indicator is easy to use and provides traders with an easy way to identify potential trades. The Wolf Wave Finder Indicator is a great tool for traders who are looking for a reliable and accurate way

This indicator is a fusion of the Parabolic SAR and Fibonacci indicators. Fibo is drawn on the last wave, at the peaks the indicator displays prices for convenience. Parabolic SAR helps to define the market trend and generates trends following trade signals. On the other hand, Fibonacci plots the price retracement levels so that traders can determine a better and safer place to enter the market. Scalping with Parabolic SAR and Fibonacci Overview. For this strategy, in addition to our indicator
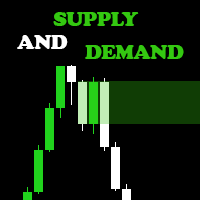
Are you ready to elevate your Forex trading game? Introducing the Supply and Demand Indicator , a powerful tool designed to help traders identify key market zones and make informed decisions with confidence! Key Features: Accurate Zone Identification : Our indicator pinpoints critical supply and demand zones, allowing you to spot potential reversal points and areas of price consolidation. User-Friendly Interface : With an intuitive design, you'll easily navigate through the settings and custom

Hit Rate Top Bottom Signal Hit Rate Top Bottom Signal Hit Rate Top Bottom Signal offers a completely innovative approach. It's ideal for those who want to evaluate beforehand how the signal performs with a specific TP-SL and in which PAIRS/TFs it performs best. The Hit Rate Top Bottom Signal strategy is a fundamental tool for any trader and any type of trading because it not only emits precise, non-repainting signals , clearly indicating when and in which direction to trade, but also keeps a det
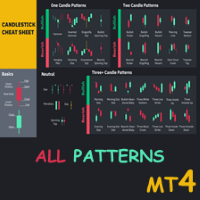
Special offer : ALL TOOLS , just $35 each! New tools will be $30 for the first week or the first 3 purchases ! Trading Tools Channel on MQL5 : Join my MQL5 channel to update the latest news from me Mastering candlestick patterns is essential for any trader looking to make well-informed decisions in the market. Introducing All Candlestick Patterns – a comprehensive tool designed to elevate your technical analysis and provide powerful insights into market trends and potential reversa
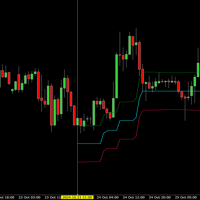
This indicator offers the valued properties of the Halftrend Indicator with some useful additions.
- anchored vertical line : means you can start calculation wherever you want, just drag and drop.
- deviation function allows you to create a channel
- multi types of alert function (Popup, Push, Email, Sound...)
works on all pair and timeframes . Easy to understand, suitable for everyone
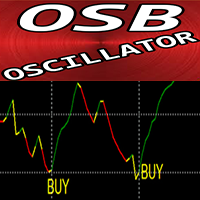
OSB Oscillator - is advanced custom indicator, efficient Price Action auxiliary tool. Advanced new calculation method is used. New generation of Oscillators - see pictures to check how to use it. OSB Oscillator is auxiliary tool to find exact entry points for Price Action, Divergence and Oversold/OverBought signals. Oversold values: below 30. Overbought values: over 70. There are plenty of opportunities to upgrade even standard strategies with this indicator. It is much faster and more accura
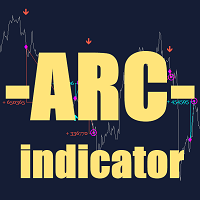
ARC Indicator — an indicator based on three algorithms: analytical, which determines optimal entry points, and an exit algorithm. The indicator works for both buying and selling, making it well-suited for the Forex market. Exiting a trade is done at the best moment thanks to a specialized algorithm. Stop Loss levels are calculated automatically, and there are two modes available: Minimal Mode — suitable for scalping. Normal Mode — increases risk but also raises the number of successful tra
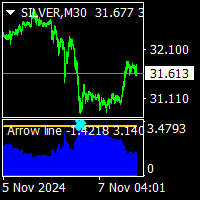
Arrow line indicator is no repaint trend indicator. it works on all time frame and all pairs. it is a pi number ( π) trigger based trend indicator. suitable for experienced traders and beginners. easy to understand. there is a trigger line and 2 histograms. red histogram is ower trigger that is top signal.. blue histogram is over trigger that is bottom signal. minimum bar number is 500. processed value must be setled between 500-3000. max value is depend to chart you are using.
The Binary SF indicator for binary options is designed for the MetaTrader 4 trading platform and provides non-repainting signals, making it a reliable tool for traders. It is suitable for any timeframe (from M1 to daily) and is mainly used for trend trading, helping traders identify suitable entry points for short- and medium-term trades. Working Principle and Signals The indicator analyzes the market and generates signals in the form of arrows (up for buys and down for sells), displayed on the

The Last 50 Pips indicator is designed to quickly identify buying and selling opportunities based on recent price behavior. It measures price changes in the last candles to highlight in yellow moments when the price may be changing direction.
Buy signal: You should open a BUY position when the indicator changes from RED to YELLOW , suggesting a change from a downtrend to an uptrend. Please refer to the images to see how easy it is.
Sell signal: You should open a SELL position when the indicato
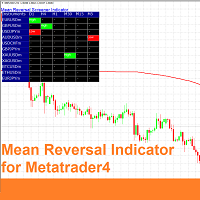
The Mean Reversal Indicator for MetaTrader 4 is a custom technical tool that identifies when the market reaches an n-period high or low, signaling potential mean reversion opportunities. Acting as a versatile screener, this indicator enables traders to detect n-period highs/lows across any selected timeframe and market offered by the broker, making it highly adaptable for multi-market or multi-timeframe analysis. Additionally, the Mean Reversal Indicator offers optional signal filters, including
The TW Volume Signal Pro MT4 , leveraging advanced AI technologies and proprietary smart algorithms, allows you to trade in the gold market with greater confidence and provides you with a unique and unparalleled trading experience. Are you looking for high accuracy and exceptional trading signals in the gold market? With TW Volume Signal Pro MT4, you can become a professional trader and achieve great success in the gold market. So, try it for free!
Key Features of TW Volume Signal Pro MT4:
Acc

Arbitrage Indicators is a professional and easy-to-use Forex trading indicator that uses the best trading principles of the latest AI arbitrage models. This indicator provides accurate buy and sell signals. Applies to currency pairs only. It has six different metrics options, MACD, KDJ, RSI, CCI, RVI, DEMARK. It can be freely switched by users, and intuitively shows the direction and reversal signal of the currency pair. When the two lines cross colors, the currency has a high probability of rev

AI Fibonacci Indicators (Non-Redraw) is a professional and easy-to-use AI fully automated Fibonacci generator Forex trading indicator that uses the latest AI technology to automatically identify accurate Fibonacci positions on charts and automatically plot them on charts. This indicator provides accurate Fibonacci important price positions. Applicable to any currency pair and other products. It has seven function switches, There are five different Fibonacci types (" Fibonacci retracement line "

The SYMBOL MANAGER symbol change indicator is an effective tool designed to enhance trading convenience and significantly simplify the trader's experience.
This indicator allows users to switch seamlessly between currency pairs and timeframes within a single open window of the trading terminal. Importantly, when switching, the associated template, including indicators and current chart settings, is automatically duplicated, ensuring a consistent trading environment.
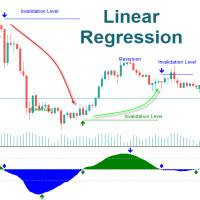
The Linear Regression Oscillator (LRO) is a technical indicator based on linear regression analysis, commonly used in financial markets to assess the momentum and direction of price trends. It measures the distance between the current price and the value predicted by a linear regression line, which is essentially the best-fit line over a specified period. Here’s a breakdown of how it works and its components: Key Components of the Linear Regression Oscillator Linear Regression Line (Best-Fit
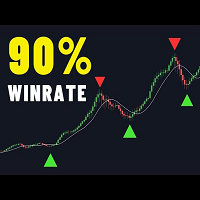
There are many linear regression indicators out there, most of them draw lines or channels, but this one actually draws a chart. This indicator also alow user show MA line on chart. So buy signal is when red candle and crossdown with MA line and vice versal. Following MA type is supported: SMA EMA RMA WMA This simple mineset but powerfull KISS - Keep it simple, stupid :D
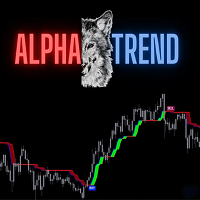
AlphaTrend is a brand new indicator which inspired by Trend Magic. In Magic Trend we had some problems, Alpha Trend tries to solve those problems such as:
1-To minimize stop losses and overcome sideways market conditions.
2-To have more accurate BUY/SELL signals during trending market conditions.
3- To have significant support and resistance levels.
4- To bring together indicators from different categories that are compatible with each other and make a meaningful combination regarding momen

The Morning Star PRT indicator uses the morning flat breakout principle. The indicator displays morning flat levels and shows possible targets.
An additional Fibonacci level has been added to the indicator, as well as sound alerts about the intersection of both target levels specified in the settings and the night flat level.
The Morning Star PRT indicator builds a night flat channel at the end of the night, as well as two Fibonacci price levels up and down. These levels can be considered both
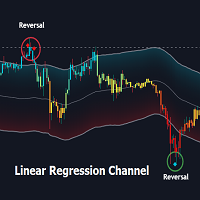
Overview:
The Linear Regression Channel Indicator is a versatile tool designed for Metatrader to help traders visualize price trends and potential reversal points. By calculating and plotting linear regression channels, bands, and future projections, this indicator provides comprehensive insights into market dynamics. It can highlight overbought and oversold conditions, identify trend direction, and offer visual cues for future price movements.
Key Features:
Linear Regression Bands: ( fig

Indicator Supply & Demand zones PRT– is a custom tool that is used to perform supply and demand zones marking of the chart. The indicator draws lines and rectangles on the chart that highlight resistance/support levels and supply/demand zones. For convenience, both lines and figures are painted in different colors so that the signals are easily distinguished from each other.The indicator draws only fresh levels, that is, those that have not yet been used and the price has not yet broken through

This indicator is a powerful tool for traders looking to identify chart patterns, and the benefits of incorporating it into their trading strategy are numerous. This tool effectively identifies and signals potential trends and reversals in the financial markets, thereby increasing trading profitability. Thanks to its advanced algorithm, the indicator can accurately analyze market data, providing traders with valuable information that can help them make informed decisions. Using this indicator al

Deep Insight Candles is an indicator that brings an entirely new perspective to the price chart. It focuses on revealing hidden structures in market movements, uncovering buyer and seller pressure, thus helping traders to better identify key levels, dynamics, and potential reversals. The indicator conveys deeper market insights, allowing traders to make decisions based on a more accurate perception of market sentiment and pressure at specific price levels. This innovative approach transforms the

Entry indicator for: - Strong moves - Tops Bottoms
Try it as yourself and it proves its value with its results. - - - - - - - - - - - - - - - - - - - - - - - - - - - - - - - - - - - - - - Info: BarRange = how many bars are detected; AlertConfirmation = Alerts on and off; CalculatedBars = Indicator Calculated Bars; Buffer0[] = Arrow Up; Buffer1[] = Arrow Down; Buffer4[] = 1 or 0 Buy Signal Buffer5[] = 1 or 0 Sell Signal
Each day at the start of the market, Flashpoints Breakout will review the pivot, support, and resistance levels using the previous day's data (high, low, and close) to calculate two breakout levels (bullish and bearish). This way, you’ll have the new entry levels ready first thing in the morning, along with Take Profit (TP) and Stop Loss (SL) values, allowing you to place pending Buy Stop or Sell Stop orders without additional calculations. With Flashpoints Breakout , each day you can place 1 or
BUYSELLMAGIC is a non-repainting signal-type trading indicator designed to precisely detect entry points in the market.
Features Reliable and permanent signals : BUYSELLMAGIC signals are final once the candle closes, ensuring they will not be modified or removed from the chart. This gives you the confidence of working with an indicator that keeps its signals stable and trustworthy. Comprehensive alerts : In addition to signals on the chart, you’ll receive notifications via email, pop-up alerts

The SniperPro(XAU-USD) trading indicator has performed well for 15 days on XAU USD.....When trading on this indicator, the order sometimes goes into a drawdown.....The indicator does not redraw!!!!!! The indicator works on time intervals M1-D1....He performed well during the release of economic news… We attach the indicator to the XAU – USD M5 chart with standard settings without changing anything.....

Automatic Fibonacci Pivots automatically calculates pivot levels and support/resistance based on Fibonacci, clearly showing key reference points that indicate potential reversal or trend continuation zones, as well as buy and sell areas . Designed for traders seeking clarity on charts without having to recalculate and manually place Fibonacci levels each time. Once set up on your computer, it will send an alert to your phone when a potential buy/sell signal is issued, allowing you to trade direc
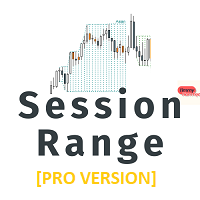
Liquidity is one of the most crucial aspects of the forex market. We can say that liquidity exists at every level of price, but there are certain areas where liquidity tends to be higher. The session high/low is one such area, which is why we developed this indicator. Why Session Range? Helps traders identify session liquidity : The session high/low represents a key liquidity pool, especially during the Asian session. Provides insight into your session position : This indicator allows you to pi
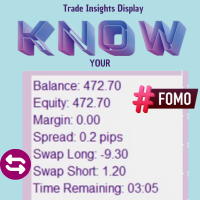
Trade Insights Display is the ideal companion for traders who want to operate with clarity and precision. This indicator provides real-time access to critical account data, such as: Balance Equity Margin Spread Swap Remaining time for the current candle . These data points are essential, regardless of the strategy or other indicators you use. Having this indicator always visible allows you to quickly assess your account status, the swap for each pair (helping you avoid high-cost trades), and the

In the fifth update , the indicator now aims to predict the direction of the next candle, issuing a buy or sell arrow precisely when the conditions are met.
Since its first version, which showed support and resistance levels on the chart, up to the current version 5, many improvements have been made. One of the key changes is the removal of visual support and resistance levels to prevent memory overload. This is no longer necessary, as arrows are now issued when the price is near or touches th

BTC Follow Line - Your Guide to Bitcoin Trading BTC Follow Line is an advanced indicator designed exclusively for cryptocurrency markets, with a particular focus on Bitcoin. Perfect for those looking for reliable Buy and Sell signals in the medium to long term, this tool works on any timeframe, adapting to your trading needs. Why Choose BTC Follow Line? Simple and intuitive : A clean and easy-to-read interface helps you make informed decisions effortlessly. Versatility : Works on all timeframes

Overview The Arrow Blue Reversal Indicator is a powerful MQL4 trading tool designed to identify potential market reversals. Whether you're a beginner or an experienced trader, this indicator provides clear, non-repainting signals to help you make informed trading decisions.
Key Features - Accurate Reversal Signals: Detects trend reversals. - Non-Repainting Arrows: Once an arrow appears, it remains on the chart, ensuring no misleading signals. - Easy-to-Use Interface: Simple and intuitive design

non-repaint free MT4 technical indicator works on all timeframes 1 minute to the monthly timeframe the trade vision buy and sell arrow is a multi currency and synthetic indicator Trade vision buy and sell arrow comes with Push Alerts purple arrow look for selling opportunities white arrow look for buying opportunities. wait for candle to close and arrow to appear before taking any trades

AI Indicator: The Future of Smart Trading at Your Fingertips Welcome to the new era of trading. The AI Indicator is the perfect trading companion for traders of all levels, designed to help you make decisions based on solid data and advanced analysis. Harnessing the power of artificial intelligence, this tool stands out for its ability to adapt to any market and timeframe, providing you with clear and precise trading signals. What Is Artificial Intelligence and Why Is It Important in Trading? Ar
Revolutionize Your Trading with the Enhanced Schaff Trend Cycle Indicator! Unlock the full potential of your trading strategy with our Advanced Schaff Trend Cycle (STC) Indicator , an indicator to deliver faster, more accurate signals than ever before. Built on the foundation of Doug Schaff's classic STC, this upgraded version integrates cutting-edge enhancements to suit the demands of modern traders. Why Choose This Indicator? Precision Redefined : Improved calculations for sharper trend ide
Master Market Trends with the Advanced XST Indicator! Introducing XST (eXtreme Super Trend) , the next-generation trend-following indicator designed for traders who demand speed, precision, and simplicity. XST builds on the strengths of the classic Super Trend indicator while incorporating advanced modifications that make it faster, smarter, and more adaptive to modern market dynamics. Why Choose XST? Enhanced Accuracy : With improved algorithms, XST reduces false signals and provides more re
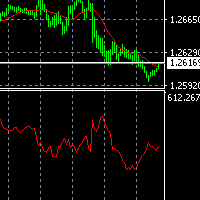
При большом количестве сделок автоматической торговли на различных валютных парах сложно оценить какие были убытки в прошедшем периоде в отсутствии наблюдения. Индикатор помогает проанализировать величину убытков на каждый момент времени в прошлом, когда завершенные ордера были активны, а так же величину убытков еще не завершенных ордеров. Его можно использовать для анализа размера депозита, необходимости увеличить депозит или наоборот возможности его уменьшить в соответствии с используемой стр
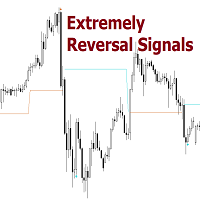
Reversal Signals [AlgoAlpha] – Master Market Reversals with Precision!
Elevate your trading strategy with the Reversal Signals indicator by AlgoAlpha. This advanced tool is designed to pinpoint potential bullish and bearish reversals by analyzing price action and, optionally, volume confirmations. It seamlessly combines reversal detection with trend analysis, giving you a comprehensive view of market dynamics to make informed trading decisions.
Key Features
Price Action Reve

The Parabolic SAR & Support/Resistance Levels is not only a technical analysis indicator, used in forex trading to identify potential trend reversals and entry and exit points, but also a ready-made autonomous trading strategy. The Indicator builds upon the PSAR indicator by adding dynamic support and resistance levels to the chart, which can help traders identify key price levels where the market may potentially reverse. Using this indicator, traders can gain insight into the strength and di

The All Market Channels indicator from ProfRobotrading automatically builds and displays all formed trading channels on the screen. This indicator is very convenient for trading on all existing channel strategies and is applicable to all instruments and timeframes.
Look at the screenshot - it will tell you more :)
More information is available on our website ProfRoboTrading.

This is a Bollinger Bands Compression indicator. It detects volatility compression and the release of “suppressed momentum.” It can be used when it coincides with any specific trading entries — released volatility means a higher probability of making a decent profit. There is also a histogram with colored bands symbolizing weakness or strength, and a zero line crossover. Therefore, this indicator can be used both in conjunction with other indicators within trading strategies, and on its own meri

This is the MT4 Ichimoku Dashboard. This dashboard will scan multiple timeframes in MT5 platform, from M1 chart to D1 chart. It will send the buy/sell signals by alert on the platform or sending notification to your phone or message you via a email.
The buy/sell signal can be set by cross of multiple lines: ex: tenkan-sen line, kijun-sen line, the cloud or you can select the price to cross or above/below the kumo cloud... Please discovery in the input setting, You can find the rule that you are
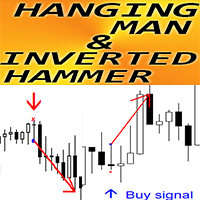
Crypto_Forex Indicator " Hanging Man and Inverted Hammer pattern" for MT4. Indicator " Hanging Man and Inverted Hammer pattern " is very powerful indicator for Price Action trading : No repaint, No delay. Indicator detects bullish Inverted_Hammer and bearish Hanging_Man patterns on chart: Bullish Inverted_Hammer - Blue arrow signal on chart (see pictures). Bearish Hanging_Man - Red arrow signal on chart (see pictures). With P C, Mobile & Email alerts. Indicator " Hanging Ma
The DMI MultiTimeframe EMA indicator is designed to facilitate multi-timeframe analysis by displaying a moving average from a specific timeframe (like H1 or D1) on any other chart timeframe. This tool allows traders to have a broader view across multiple timeframes directly on the current chart, enhancing precision and understanding of market trends. Parameters : Moving Average Timeframe : Sets the timeframe for the moving average, such as H1 for hourly or D1 for daily. Default: H1. Moving Avera

The Trend Ultimate Indicator is designed for visualizing and analyzing market trends, allowing traders to quickly assess current market tendencies. It is particularly useful for: Determining the duration of the current trend (bullish or bearish). Providing a clear visualization of price behavior relative to key moving averages and the MACD indicator. Supporting decision-making based on histogram dynamics (trend direction and intensity). Trend Ultimate does not guarantee profit but assists trader

Indicator Seff designed for both beginners and professionals. This indicator generates possible entry points to open BUY and SELL trades and will help you: reduce the number of errors when opennig orders; predict price movement(in absent of significant news); do not rush to close profitable trades prematurely and increase profit; do not rush to enter the market and wait for "easy prey": and increase the profitability of trading. Does not redraw and works by opening bar.
Settings
ALARM- enabl

This indicator combines two tools: MACD and OsMA . MACD is displayed as two lines: The black line represents the main MACD line. The orange line represents the MACD signal line. OsMA Histogram is shown in two colors: Green bars indicate growth. Red bars indicate decline. You can customize the line colors and thickness in the settings. This indicator serves as an addition to the Combo View Impulse System indicator but can also be used independently. Parameters: Fast EMA period (12) – The short

The Ligma Binary Indicator is a sophisticated tool designed to assist traders in identifying key price action patterns that offer high-probability trade opportunities. This indicator is based on a unique strategy that detects isolated candles or “lonely” candles, which occur in trending markets and are often followed by strong price reversals or continuations. Key Features: Trend Detection: The indicator uses a Simple Moving Average (SMA) to identify the prevailing market trend (uptrend or downt
This is the ADX Dashboard MT5. This dashboard will scan multiple timeframes in MT4 platform, from M1 chart to D1 chart. It will send the buy/sell signals by alert on the platform or sending notification to your phone or message you via a email.
The buy signal is the cross over of DI+ and DI- The sell signal is the cross under of DI+ and DI-.
The up trend color will be displayed when DI+ is greater than DI- The down trend color will be displayed when DI+ is less than DI- The value of ADX value wi
This is the Super Trend Dashboard MT4. This dashboard will scan multiple timeframes in MT4 platform, from M1 chart to D1 chart. It will send the buy/sell signals by alert on the platform or sending notification to your phone or message you via a email.
The buy signal is generated when the super trend line flip from SELL to BUY. The sell signal is is generated when the super trend line flip from BUY to SELL.
The up trend color will be displayed depending on the current Super Trend value.
Индикатор LiquidityDWM отображает на графике не перекрытую дневную, недельную, месячную ликвидность и предназначен для определения предрасположенности направления ценового движения. В концепции движения цены рынок всегда стремиться в сторону ликвидности для ее снятия, поэтому для торговли очень важно знать рыночную предрасположенность движения цены. Индикатор LiquidityDWM покажет вам самые важные уровни ближайшей ликвидности, куда стремиться рынок в первую очередь. Знание первоочередной цели д
This is the Heiken Ashi Dashboard MT4. This dashboard will scan multiple timeframes and symbols in MT4 platform, from M1 chart to D1 chart. It will send the buy/sell signals by alert on the platform or sending notification to your phone or message you via a email.
The buy signal is generated when the heiken ashi bar changes its color from red to white. The sell signal is is generated when the heiken ashi bar changes its color from white to red. The up/down trend color will be displayed depend
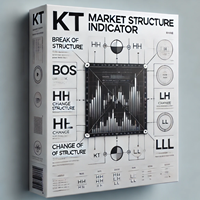
The KT Market Structure intelligently detects and displays Break of Structure (BOS) , Change of Character (CHoCH) , Equal Highs/Lows (EQL) , and various significant swing high/low points using our proprietary algorithm for accurate pattern detection. It also offers advanced pattern analysis by effectively demonstrating the captured profit for each pattern. A fully automated EA based on this indicator is available here: KT Market Structure EA MT4
Features
Accurate Pattern Detection: Our advance

This indicator combines several functionalities: Value Zone Displays two exponential moving averages (EMAs): 13-period EMA in red. 22-period EMA in blue. Impulse System (based on Dr. Alexander Elder's methodology) Candles are color-coded to indicate trade restrictions: Red candles prohibit buying. Green candles prohibit selling. Blue candles allow both buying and selling. Recommended for use on two timeframes for enhanced analysis. 3x ATR Channel A channel based on 3 times the ATR (Average True
Learn how to purchase a trading robot from the MetaTrader Market, the store of application for the MetaTrader platform.
The MQL5.community Payment System supports transactions via PayPal, bank cards and popular payment systems. We strongly recommend that you test the trading robot before buying, for a better customer experience.
You are missing trading opportunities:
- Free trading apps
- Over 8,000 signals for copying
- Economic news for exploring financial markets
Registration
Log in
If you do not have an account, please register
Allow the use of cookies to log in to the MQL5.com website.
Please enable the necessary setting in your browser, otherwise you will not be able to log in.