Смотри обучающее видео по маркету на YouTube
Как купить торгового робота или индикатор
Запусти робота на
виртуальном хостинге
виртуальном хостинге
Протестируй индикатор/робота перед покупкой
Хочешь зарабатывать в Маркете?
Как подать продукт, чтобы его покупали
Технические индикаторы для MetaTrader 4 - 80

Индикатор Ez Channel является важным инструментом для трейдеров, следующих за трендом, поскольку он автоматически определяет на графике реальные каналы тренда. С этим индикатором вам больше не придется часами вручную рисовать линии тренда на графиках. Это экономит ваше время и усилия, быстро рисуя каналы тренда для любого символа и таймфрейма. Одной из ключевых особенностей Ez Channel является его мини-панель управления, которая позволяет легко настраивать периоды времени в соответствии с ва

Average Daily Weekly Monthly Range Alerts.
The most complete multi-period dynamic range indicator with full alert options. Visually displays the Average Range lines on chart + real time distances to the Range Highs and Lows. Notifications are sent when the average ranges are hit. An essential tool for any serious trader! Average period ranges, especially the ADR (Average Daily Range) for day traders, are one of the most useful and consistently reliable indicators available to traders. Always av
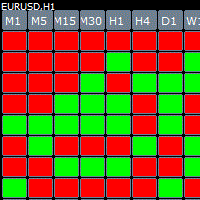
Cube indicator represents the original candle stick chart but in a top down cube form in order to see previous patterns in the markets more easy. The indicator has build in alert once there is a consecutive 3,4,5 bars in a row you get an message.
Parameters Bars_Limit = total visible cubes
TF_M1 = true; TF_M5 = true; TF_M15 = true; TF_M30 = true; TF_H1 = true; TF_H4 = true; TF_D1 = true; TF_W1 = true; TF_MN1 = true; Table_Position_X = 20; Horizontal shift Table_Position_Y = 40; Vertical sh
Indicator, which draws supports and resistances. Algorithm that calculates the entry zone of the position and the possible target. The benefits you get: Never redesigns, does not retreat, never recalculates. Works on forex and CFD, timeframe from M1 to Weekly. Integrated pop-up, push notification and sound alerts. Easy to use.
Parameters: SENSIBILITY = indicates the importance of levels, we recommend a minimum value of 1.0
PERIOD_BAR = indicates how many bars are considered for volatility, w
Панель предназначена для быстрого визуального нахождения и отображения ложных пробоев по всем периодам и на любых выбранных валютных парах одновременно . Цвет сигнальных кнопок , указывает на направление возможного движения . По клику на сигнальную кнопку , осуществляется открытие графика с данным паттерном . Отключить не используемые периоды , можно кликом по его заголовку . Кнопка "All" открывает графики всех сигналов по данному периоду . Имеется поиск в истории ( по предыдущим барам ). Прокру
Стратегия для торговли по тренду. Индикатор показывает точки входа и выводит на графике TakeProfit и StopLoss уровни, а также просчитает общий результат. ВНИМАНИЕ! TI Opti Pro - мощный инструмент для переборки входных параметров индикатора TrendImprovement Pro даст возможность быстро найти самые прибыльные варианты входных параметров. Новый проект.
Описание. Никому уже не секрет что нет универсального индикатора, который бы приносил прибыль на всех валютных парах и таймфреймах в долгосрочном

Торговля на основе показателей тренда самая простая и, зачастую, самая эффективная. Если правильно определить начало тренда, результат сделки обычно положительный. Если же вы используете в качестве базы живой график бинарных опционов, шансы на успех становятся еще выше.
Данный индикатор может отследить устойчивое движение цены в определенном направлении. При этом само движение может быть нисходящим, восходящим или боковым, когда движение рынка не имеет ярко выраженной направленности. Индикатор

Индикатор Dolphin Bands работает одинаково хорошо на любых таймфреймах. Для трендов средней продолжительности рекомендуется использовать стандартную настройку. Для исследования долгосрочных трендов рекомендуется использовать значение индикатора больше стандартного. Для анализа краткосрочных трендов лучше использовать меньшее значение индикатора. Чаще всего для вычисления индикатора используют экспоненциальный метод, но также могут применяться другие разновидности.
Dolphin Bands – это набор ли

Special Volume - Индикатор объема, на рынке Форекс объемы своеобразные (тиковые). Почему на Форекс невозможно отследить нормальные объемы? Дело в том, что это внебиржевой рынок. Следовательно, подсчитать объемы покупок и продаж по одному инструменту, практически, не реально. Многие Форекс трейдеры вовсе отказываются от индикаторов объема в своей работе. Но для тех, кто хочет их использовать, есть несколько интересные инструменты, и один из них Special Volume. Индикатор объема Special Volume отра

Индикатор Martingals работает на всех валютных парах и на всех таймфреймах. Стрелками показывает оптимальные точки входов для будущего усреднения по Мартингейлу даже с нулевой экспонентой. Индикатор показывает сигнал на закрытие серии только в том случае, если все предыдущие сигналы можно закрыть в профите. После закрытия серии в профите нужно сразу открывать ордер в направлении сигнала. Таким образом сигнал на закрытие - это одновременно точка реверсного открытия в другую сторону нового ордера.

Индикатор направления (тренда) Direction Trend. Показывает направление текущего тренда. Раскрашивает бары в красный и синий цвет. Работает на всех валютных парах и на всех таймфреймах. Не надо забывать, что подход должен быть комплексным, сигналы индикатора требуют дополнительной информации для входа в рынок. Принцип работы индикатора заключается в том, чтобы при размещении на график автоматически определять текущее состояние рынка, анализировать исторические данные, на основании исторических д
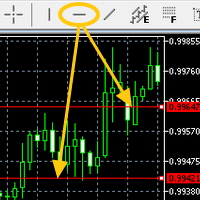
Attach the indicator on the chart and draw the red line from the button on MT4's built-in menu bar then the alert will be sent to you(push,email,popup and sound)
Hi You all know the red line (the MT4 built-in red line) drawn from the menu bar on MT5. It is often used to check the resistance etc.....It is very useful but it is little troublesome to get an alert(sound, push, email and popup) when the red line is touched by the price. Here is Price Touch Alert indication, just use the button to

A unique multicurrency and multi-timeframe strategy developed by a team of LATAlab specialists. Strategy Profit Creator by LATAlab has been tested and verified by our team. This will allow you to earn maximum profit comfortably and efficiently. Strategy features Profit Creator by LATAlab never redraws. Works on any trading symbol. Time frame - from M1 to MN. Automatically detects Buy, Sell, Take Profit, Stop Loss levels. The indicator is equipped with a convenient information panel in which all

Анализ распределения Галактического Объема (VSA) - это индикатор, предназначенный для визуализации Объема и доли, в которой он влияет на волатильность разброса различных пар.
Стратегия состоит из следующего:
Bull Trend: Всегда в пользу тренда, открывайте покупки на минимумах тренда, при условии, что он совпадает с большим объемом, показанным индикатором Galactic VSA. Нисходящий тренд: Всегда в пользу тренда, открывайте торговые операции на максимумах тренда, при условии, что он совпадает с бо

Despite the popularity of inside bar pattern among the traders, using it as a standalone signal doesn't provide any edge in the market.
KT Inside Bar Advanced indicator solves this problem by combining the classic inside bar pattern with the "ECE" cycle and Fibonacci extensions. Using this indicator in place of our classic inside bar indicator will provide a tremendous advantage and edge in the market.
What is the ECE cycle?
In financial markets, the price never moves in a straight line but u

Auto redrawn Pivot support resistance horizontal lines with signal of Buy/Sell possibilities with SL level and with trend support resistance lines too used for all symbols and time frames you can adjust inputs parameters (only 2) and test it on various symbols and time frames input number of bars for calculation and moving average for signal accuracy example : use it on M30 time frame with input 200 for bars count and 100 for MA

This Indicator provides Buy/Sell Signal based on calculations on Higher frame (Trend) and Lower frame(Entry signals) * You should select the higher and lower frame for indicator calculations * You select the Trend line colors as you prefer * Enable or disable Alerts! Trend lines UP/Down are drawn when a trend is detected Wait for small arrows for entry : *Normally an UP arrow in an UP Trend is a BUY signal : ---you Close the BUY position IF a Reverse DOWN Trend signal appears Or when Up trend li

Trend Sniper Super Indicator is one of the best indicator which can provide you will perfect signals for short term and long term trades. This indicator is suitable for both scalping and swing trading strategies. The indicator is over 85% accurate. It uses terminal Message Alerts, Emails and Push notifications to your mobile device to inform you about the new trading opportunities and it will calculate the take profit and stop loss level for you. All you will need to do is to place a trade. Subs
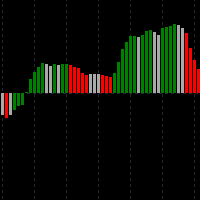
Hybrid MacdAO - индикатор, сделанный на базе двух популярных индикаторов: MACD + AO. Он вобрал в себя их лучшие качества, но при этом лишен недостатков. Предназначен для ручной торговли по тренду. Отлично показывает усиление, замедление текущего движения цены. Также будет хорошим помощником, кто торгует по дивергенциям (довольно точно показывает нужную точку входа в позицию сменой цвета гистограммы). Есть алерт-система (чтобы вы не сидели постоянно возле монитора). Преимущества перед стандартны

Универсальный индикатор Diamond Grail который получил такое название не так просто! Индикатор тестировался больше года нашими специалистами! Один из лучших стрелочных индикаторов, который идеально подходит для бинарных опционов и Форекс, Если торговать по бинарным опционам лучший регтайм для него от 3 минут максимум 5 минут Стрелка появляется на предыдущей свечи. Если торговать на форекс то время открытие от свечи до свечи Результат на форекс От 40 До 1324 пи псов! Доходность Diamond Gra
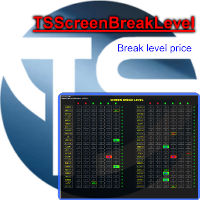
Indicator, which draws supports and resistances that have been broken. Intelligent algorithm for scalper and intraday traders. Multi time frame and multi currency panel. The benefits you get Never redesigns, does not retreat, never recalculates. Works on forex and CFD, timeframe from M5 to Daily. Integrated pop-up, push notification and sound alerts. Easy to use. Parameters input int Number_Instrument = 10; Number of crosses present in your panel SENSIBILITY = 1; indicates the imp

Mars 13 is a Break indicator is a powerful indicator of Pattern trade for any par and any timeframe. It doesn't requires any additional indicators for the trading setup.The indicator gives clear signals about opening and closing trades.This Indicator is a unique, high quality and affordable trading tool. Can be used in combination with other indicators Perfect For New Traders And Expert Traders Low risk entries. Never repaints signal. Never backpaints signal. Never recalculates signal. For

Данный индикатор является профессиональным индикатором для торговли на рынке форекс. Показывает точки для входа в рынок, точки потенциального разворота рынка. Использует один параметр для настроек. Готовая торговая система. Индикатор сочетает в себе несколько прогрессивных алгоритмов. Объединенные системы анализа исторических данных проецируются на линии в виде прямых соединяющие экстремумы. То есть точки разворота рынка. Данные экстремумы или точки разворота рынка можно использовать как линии

Introduction
This is a volume based heatmap type indicator. The indicator does not repaint . Its gives a collective view of short, intermediate and long term volume buy sell activities(bottom to top of map). This indicator should prove quite beneficial to all those who believe in the power of volumes. As usual for any volume based indicators, a ECN broker is recommended.The indicator can be useful for both binary and other fx trading.
Before wondering how to use it, it is probably worthwhi
RSI Crossover Alert — это мощная система уведомлений, разработанная специально для трейдеров, которые используют индекс относительной силы (RSI) в своих торговых стратегиях. Этот индикатор фокусируется на выявлении пересечений RSI, которые происходят, когда быстрая линия RSI пересекает выше или ниже медленную линию RSI. Комбинируя эти пересечения, индикатор эффективно отфильтровывает ложные сигналы, позволяя трейдерам принимать более точные торговые решения. RSI Crossover Alert предлагает

Swing Trading Forex - это новый индикатор который показывает трейдеру импульсные движения цены, а так же с помощью стрелки прогнозирует будущее движение на краткосрочный период. С помощью данного индикатор можно торговать по системе скальпирования, где трейдеры пытаются получить прибыль на коротких промежутках времени. Для получения хороших торговых результатов, нужно поместить на график любой валютной пары индикатор Swing Trading Forex и добавить еще любой бесплатный канальный индикатор. Торгов
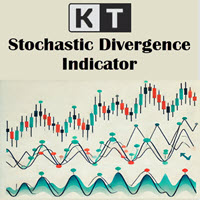
Дивергенция — это один из важных сигналов, указывающих на возможный разворот цены на рынке. KT Stoch Divergence показывает обычные и скрытые дивергенции между ценой и стохастическим осциллятором.
Ограничения KT Stoch Divergence
Использование дивергенции стохастика в качестве единственного сигнала входа может быть рискованным. Не каждую дивергенцию можно трактовать как сильный сигнал разворота. Для лучших результатов рекомендуется комбинировать с анализом цены и направлением тренда.
Особенности

Друзья, представляем Вашему вниманию наш новый индикатор Forex Gump Laser. Так как у нас в команде нет дизайнеров, а в основном мы математики, финансисты, программисты и трейдеры, то особых изменений в дизайне индикатора мы не делали. С виду он напоминает привычный Вам Forex Gump. С другой стороны Forex Gump стал уже не просто названием индикатора, это бренд. И мы пытаемся во всех его разновидностях сохранить фирменный стиль. Вся суть индикатора в его алгоритмах работы и формулах, которые отвеча
Mars 14 is a Break indicator is a powerful indicator of Pattern trade for any par and any timeframe. It doesn't requires any additional indicators for the trading setup.The indicator gives clear signals about opening and closing trades.This Indicator is a unique, high quality and affordable trading tool. Can be used in combination with other indicators Perfect For New Traders And Expert Traders Low risk entries. Never repaints signal. Never backpaints signal. Never recalculates signal. For M
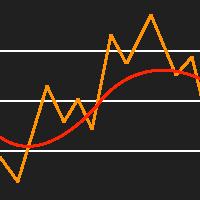
This indicator places a moving average of the specified type over the standard RSI indicator. This is an extremely useful tool for spotting reversal points and RSI divergences. This indicator provides buffers, allowing you to use it in your expert advisor. I like to make the RSI period the same as the moving average period, but it is up to you to set it up however you would like.
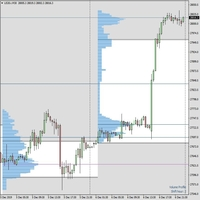
Здравствуйте уважаемые трейдеры. Я торгую с 10 лет, и, по моему мнению, профиль рынка - это путь к успешной долгосрочной торговле без головной боли. Эта система больше похожа на то, как крупные институты торгуют в долгосрочной перспективе. Я широко использую его для построения кумулятивных позиций для таких индексов, как S & P, NASDAQ, DAX и т. Д. Но это также очень хорошо для основных валют и сырьевых товаров. Профиль рынка был впервые представлен Питером Стейдлмайером в Чикаго. Он понял, что о
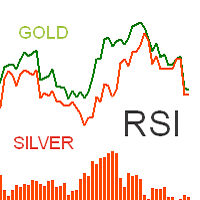
Индикатор отображает две линии RSI разных Символов и гистограмму разницы между ними по модулю. Названия символов задаются в настройках: First Symbol Second Symbol Для линии RSI второго Символа можно включить зеркальное отображение. Это нужно чтобы контролировать расхождение линий RSI для Символов с обратной корреляцией. Например, если вы сравниваете показания RSI Символа EURUSD и USDCHF, для второго нужно включить функцию зеркального отображения линии. Second RSI Mirroring Последняя настройка за

Индикатор тренда, а не первый вид обычный индикатор но его можно использовать с оптимальным коэффициентом риска. Принцып работы прост - индикатор показывает моменты для входа в рынок стрелками, что очень легко воспринимается визуально.
Рекомендуется использовать с дополнительным индикатором осциллятором, например стандартным RSI. Реагировать нужно на уровень 50. Или использовать какую-то другую систему подтверждения.
Индикатор можно использовать как для пипсовкы на мелких периодах, так и для
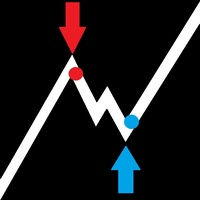
EntryDotPro уникальная разработка для трейдеров которые не уверены в своей торговли и не могут найти рабочую стратегию. Индикатор подходит для всех инструментов и для всех таймфреймов. Индикатор работает во всех рыночных ситуациях в тренде и во флэте. Также индикатор специально сделан очень простым в настройках и в использовании чтобы не отвлекать трейдеров от торговли. Индикатор показывает сигнал в том месте где появляется точка, также чтобы легче торговать вместе с точкой появляется стрелка ко

Индикатор Candle Inside - рисует на графике японские свечи старшего таймфрейма. Теперь, после загрузки индикатора, есть возможность увидеть - что происходит внутри каждой свечи. Помимо стандартных кнопок для выбора таймфрейма в терминале МТ-4, добавлены дополнительные кнопки, при нажатии на которые - выбирается более старший период, для отображения японских свеч или зон. Например, если выбрать стандартный период М1 и период индикатора М5, то на графике будут отображены минутные свечи внутри пяти

Levels Market - это один из самых простых, но от этого не менее эффективных инструментов. От данных уровней можно строить точки разворота, уровни строятся как статистическая значимость на данный момент времени. Торговля по уровням – классика в работе трейдера. Использовать их можно как готовую торговую стратегию или как дополнительный фильтр в своей торговой системе. В настройках вы можете задать смещение для построения уровней. Интерпритация уровней: Линии 8/8 и 0/8. Эти линии самые сильные и
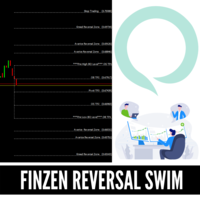
REVERSAL FINZEN LEVELS More than a regular indicator is a complete system with Entry levels, Stoploss, AND TakeProfits Levels. This System indicator is Based on Our Private Strategy that has been using During A while with our Private FUNDS, this indicator can be used in stocks, FOREX CFD but mainly use with amazing results in FOREX Markets.
This indicator will detect in some specific levels when market reversal so you try to sell when market is OVERBOUGHT and Sell when market is OVERSOLD with
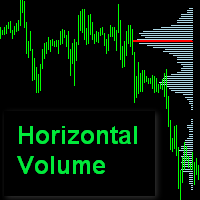
Индикатор Профиль Горизонтального Объема показывает распределение проторгованного объема на заданном интервале. Длина линий пропорциональна проторгованному в данном диапазоне цен объему. Входные параметры : Interval = 0 - индикатор пересчитывается ежедневно в 00:00, Interval = 1..5 -индикатор пересчитывается в заданный день недели (Пн..Пт). CountDays = 1..30 - глубина анализа в днях. PipStep = 10 - Шаг сканирования диапазона, чем он больше, тем быстрее и грубее подсчет. Не имеет смысла устанавл
Индикатор тройной осциллятор " ThreeAngleR " - общий для трёх вычислителей углового отклонения графика цены торгового инструмента.
ВХОДНЫЕ ПАРАМЕТРЫ: Input1 =" AnglerSPeriod "; - DRAWs1 =128 - Количество баров для отображения индикатора в историю графика; - PeriodIND =14 - Расчётный период индикатора в количестве баров; Input2 =" JAngleR "; - DRAWs2 =128 - Количество баров для отображения индикатора в историю графика; - Period_IND =14 - Расчётный период индикатора в количестве баров; - ma_peri
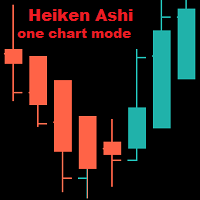
Heiken Ashi On One Chart Mode MT4 Индикатор отображается только на одном из режимов графика: Бары, Свечи, Линия. По умолчанию -- Бары. При переключении режима графика индикатор показывается или пропадает в зависимости от режима графика. Входные параметры: iChartMode: на каком режиме графика отображать индикатор: mBars (Бары) mCandles (Свечи) mLine (Линия) Цвета: LightSeaGreen: бычья свеча Tomato: медвежья свеча

Индикатор тренда Trend New , показывает сигналы для входа. Отображает как точки входа, так и сам тренд. Показывает статистически рассчитанные моменты для входа в рынок стрелками. При использовании индикатора можно оптимально распредилить коеффициент риска.
Настройки: Использует все один параметр для настроек. Подбирая параметр необходимо визуально подобие так чтоб насоответствующем графике была отмальная проекция экстремумов. Параметры: Length - количеств баров для рассчета индикатора.
Исполь

Индикатор показывает направление тренда, сигнализируя об этом используя разворотные точки. Можно использовать с оптимальным коэффициентом риска. Стрелками показывает благоприятные моменты и направления для входа в рынок. Использует один параметр для настройки (регулировать от 1 до 3). Работает на всех валютных парах и на всех таймфреймах.
Индикатор можно использовать как для пипсовкы на мелких периодах, так и для долгосрочной торговли. Работает на всех валютных парах и на всех таймфреймах. При
ZoneFinder is an indicator panel that presents an interactive, multi-timeframe visualisation of trend direction and strength. Trend strength and direction is measured using a modified ADX indicator based on smoothed DI+ and DI- values. High probability trading zones are identified using Fibonacci retracements. Where such zones are found, they are marked on the chart together with a proposed Fibonacci extension target.

После покупки свяжитесь со мной через mql5. Так мы сможем убедиться, что дашборд корректно работает на вашей платформе.
Вложенные зоны Forex предназначены для получения всех ключевых уровней на одном графике, чтобы найти области отскока и прорыва.
Все, что вы можете себе представить, переносится из нескольких таймфреймов на одну панель мониторинга, чтобы определить вложенные области слияния и спроса.
Если приборная панель показывает высокие баллы, это означает четкое определение поддержки и сопр
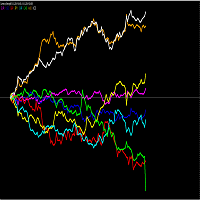
PLEASE NOTE THAT LIKE MANY SUCH INDICATORS ON THIS MARKET, THIS INDICATOR WILL NOT WORK AS A DEMO DOWNLOAD FOR STRATEGY TESTER. Therefore the 1 month option at the lowest cost allowed of $10 is available for you to test. One of the better ways to trade is to analyse individual currencies rather than currency pairs. This is impossible with standard chart indicators on MT4. This currency strength meter allows one to trade the strongest with the weakest currency. The meter includes the curren

Revers Line сигнализирует о перемене угла скользящий средней, параметр LevelZero задает окружность нулевой точки, есть пределы от -LevelZero к LevelZero включая будут считаться нулевой точкой, на гистограммы это можно обозначается красным цветом. Параметры:
LevelZero - нулевая точка [-LevelZero, LevelZero]; Length - длина скользящий средней; Start - отправная точка для расчета угла; End - конечная точка для расчета угла; MetodMA - метод усреднения; AppliedPrice - применить к усреднению
Торговать можно на любом базовом активе, но специалисты проводящие тестирование отдают предпочтение валютной паре USD/JPY, EUR/USD. Наиболее благоприятным временем для работы считается Европейская, Американской сессии. При появлении синей стрелки под свечой приобретается опцион ВВЕРХ. При появлении красной стрелки приобретается опцион ВНИЗ. Следует отметить одну особенность индикатора: сигнал образуется при открытии свечи, открывать сделку стоит этом баре. Сигнал появится на предыдущей свечи в н

With the Market View Indicator , you may monitor in a dedicated panel as many as products as you wish. Just add the indicator to the chart, enter the prodcuts you want to view and the change period to track and that's it. A panel will open up at the bottom of the chart which will show you per product the change in pips, the standard deviation, the return etc. Personally, I use it to track multiple products I have positions with without having multiple charts opened up, it save me bandwith and t
Представляем Awesome Oscillator Alert , мощный технический индикатор, который предоставляет трейдерам ценную информацию о динамике рынка и торговых возможностях. Благодаря своим обширным функциям и удобному интерфейсу этот индикатор является важным инструментом для трейдеров, стремящихся получить преимущество на рынке.
Одной из выдающихся особенностей Awesome Oscillator Alert является его совместимость со всеми валютными парами и таймфреймами. Независимо от того, торгуете ли вы основными па
Индикатор ZigZag строится на показаниях индикатора RSI, что позволяет выделить значимые вершины. Предусмотрены различные варианты расчетов: - индикатора RSI по ценам Close или Hi-Low (1 и 2 буфера соответственно в режиме OnClose - первый буфер, в режиме Hi-Low первый буфер по цене High, второй по Low); - индикатора ZigZag по периоду (стандартный) или отклонению. (Значения индикатора ZigZag всегда находятся в нулевом буфере). При использовании старшего таймфрейма убедитесь в качестве котировок эт
This indicator computes Chaikin Money Flow (CMF) which is very useful to identify price trend. The indicator provides alerts when upper or lower levels (specified by user) are crossed by CMF. You can decide to receive a standard alert on MT4 and/or a push notification on your Metatrader app. You can configure the indicator by also specifying: • CMF periods • Levels at which the alert is provided
Link Telegram Channel for help settings

ForexGumpOopster - этот индикатор разрабатывался для определения направления тренда и точек разворота цены на таймфреймах H1, H4, D1. Настройки по умолчанию стоят для валютной пары GBPUSD. Для валютной пары EURUSD таймфрейм H1, H4, D1 рекомендуем в настройках индикатора изменить параметр "smooth=5". Данный индикатор хорошо подойдет для трейдеров которые торгуют по системе скальпирования. Стрелками на экране индикатор указывает точки разворота цены, а линиями показывает направление тренда.
Алг

Visual Trade History Визуализатор торговой истории. На графику отображается уровеней SL, TP, точки входу и выходу с рынка. Отличительные черты: Есть возможность отображать только ордера с прибылью больше заданного числа. Присутствует возможность отображение только исполненных ордеров или не исполненных, или всех. Для удобства анализу для каждого типа ордера можно настраивать собственной цвет.

Elliott Wave Indicator
Perfect for trading Stocks, Futures, Forex & Crypto The Elliott Wave Indicator Suite is designed around a simple but effective Swing Trading strategy. The Indicator Suite is great for Stocks, Futures and Forex trading on multiple time-frames.
By subscribing to this indicator, you will get: Automatic Elliott Wave Count Elliott Wave Isolation High Probability Pull Back Zones Special 5-35 Oscillator 6/4 Moving Average High and Low's for trade entry and management Automate
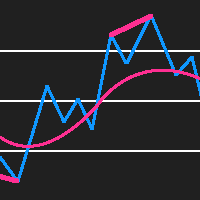
RSI Divergence Detector is an RSI indicator which also detects divergences and plots arrows and trend lines on the chart where you should buy and sell. Please note that this indicator provides 5 buffers and doesn't repaint making it an exceptional indicator for Expert Advisors. The indicator also provides alerts. Buffer 0 = RSI Buffer 1 = Buy Buffer 2 = Sell Buffer 3 = RSIGradient Buffer 4 = PriceGradient
NON REPAINTING
DIVERGENCE DETECTION

прорыв линии шеи / треугольника / флагштока (прорыв линии шеи = подтвержденный сигнал для вершины / оснований и головы и плеч). Индикатор также можно использовать в режиме одиночного графика. Подробнее об этой опции читайте в разделе продукта. блог . В сочетании с вашими собственными правилами и методами этот индикатор позволит вам создать (или улучшить) вашу собственную мощную систему. Функции
Может одновременно отслеживать все символы, отображаемые в окне "Обзор рынка". Примените инд

BeST_123 Strategy is clearly based on the 123_Pattern which is a frequent Reversal Chart Pattern of a very high Success Ratio . It occurs at the end of trends and swings and it’s a serious indication of high probability for a change in trend. Theoretically an 123_pattern is valid when the price closes beyond the level of #2 local top/bottom, a moment when the indicator draws an Entry Arrow, raises an Alert and a corresponding Position can be opened. The BeST 123_Strategy Indicator is non-repai

Power Renko is an indicator which plots Renko bricks underneath the chart using a histogram. You can select the brick size and the timeframe of the Renko bricks as well as whether or not to use the close price or the high/low price of the candles. Renko bricks are based on price alone, not time, therefor the Renko bricks will not be aligned with the chart's time. They are extremely useful for trend trading and many different strategies can be formed from them. Buffers are provided allowing you t

Breakeven calcualtor is a Metatrader 4 indicator which calculates and displays the breakeven value for the open P&L. The value is updated dynamically based on market movements and changes. If the overall P&L is negative, the breakeven point will be displayed as a red value, otherwise green. Besides the breakeven, the following values are also displayed: Pips sum P&L change per minute Pips change per minute P&L total Swap total Commisions total 2019 Roy Meshulam

Period trend indicator calculates and displays the changes in: Trend Pips Standard Deviation Return (%) in the following periods - M1, M5, M15, M30, H1, H4, W1, MN1, MN3, MN6, Y1 and Year to Date. By default, the current product is used, but it can any product when you attached the indicator to the chart.
I used extensively to monitor the product changes accross multiple charts wihtout having the need to open them in paralle. 2019 Roy Meshulam

Future Price Markets - это индикатор, который, посредством динамического анализа цены и времени, проектирует прибыль, фиксируя цены в будущем. Чтобы показать будущие прогнозы цены, он использует определенные горизонтальные линии разного цвета и стиля, будь то сигнал, указывающий на сигнал покупки или сигнал о продаже, или сигнал будущего, чтобы получить выгоду от покупки или продажи. Future Price Markets - eto indikator, kotoryy, posredstvom dinamicheskogo analiza tseny i vremeni, proyektiruyet
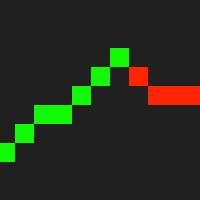
Overlay Renko is an indicator which plots Renko bricks overtop of the chart. You can select the brick size as well as whether or not to use the close price or the high/low price of the candles. Typically Renko bricks are based on price alone, not time, however unlike normal Renko bricks the only difference is this indicator allows you to see the price action going on within each Brick by overlaying the bricks on top of the standard chart. Renko bricks are extremely useful for trend trading and m

Simple moving trend lines with support and resistance moving levels used on any time frame on any symbols input: # of bars for trend lines (10-20- 50-100-200----) as per your time frame and your strategy and moving period ( 10-20 -50-100-200----) as per your time frame and your strategy Direction Arrows : UP and DOWN are drawn when breaking the trend lines ALerts available at Arrows appearance...
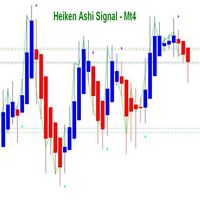
Индикатор Heiken Ashi Signal предназначен для торгового терминала Мт4. За основу был взят стандартный индикатор Heiken Ashi который есть в терминале Мт4.
Индикатор можно применять как в ручной, а также автоматической торговли авторскими советниками. Для применения индикатора Heiken Ashi Signal в торговых экспертах есть сигнальные буферы для входа в рынок и открытия позиций на покупки и продажи.
Об этом читайте ниже подробнее. Возможности и характеристики индикатора Heiken Ashi Signal: Работает
Intraday Signals is a visual and effective semi-automatic trading system, that: generates possible entry points to open BUY and SELL trades; displays recommended Take Profit and Stop Loss; displays current profit on open trade; displays current spread. The profitability of the indicator is shown in the screenshot on the example of the GBPUSD pair Does not redraw and works on opening bar. Time frames - M1-H1. Recommended TimeFrame-M5-M15. Signals are produced based on the used of HMA, Laguerre

5 signal in 1 Product TimeFrame Recommend 1m-5m
Banks Pro Binary Option is Indicator for binary option Can Use Manaul Trade or Robot on Platform Mt2Trading https://www.mt2trading.com/?ref=104 Time Trading good work EU US session Recommend Curency EUR GBP USD careful AUD JPY Recommend Martingale 2-5 Step
Recommend set profit 1%-5%/Day Setting Brake News Event High volatility recommend 15-30 min
Have Problem Contract Telegram @BinaryBanks Email a
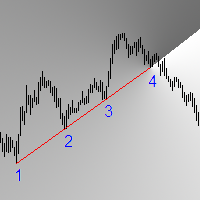
Это полноценная Price Action торговая система, основанная на поиске точек входа в момент пробития ценой трендовых линий. Индикатор находит и рисует линии поддержки, сопротивления и горизонтальные уровни. Когда цена пересекает эти линии, индикатор подаёт звуковой сигнал Алерт и присылает Push-уведомление. Так же вы можете рисовать свои собственные линии, и индикатор тоже будет работать с ними и подавать сигналы Алерт и Push-уведомления о пересечении ценой ваших линий. Ваши собственные линии оста

Трендовый индикатор с подтверждающим сигналом. В нижний части графика строится гистограмма с силой сигнала от 1 до 2 при сигнали на покупку и от -1 до -2 при сигнале на продажу.
Индикатор подходит ко всем периодам графика и ко всем валютным парам. На основном графике отрисовываются стрелки сигнализирующие о вхождения в сделку. В верхнем правом углу отображается инфопанель с ценой входа в сделку текущей ценой прибылью в пунктах информация по текущему сигналу - покупка или продажа. Индикатор на

This scanner is monitoring the entire market for Ichimoku trade opportunities for all symbols and for all time frames. You don't have to look to all the charts, for all symbols and for all time frames. This scanner will alert you on your computer, or on your mobile, when a trade opportunity has been found. You never have to miss a trade opportunity! This indicator is designed to scan all pairs and symbols, for all selected time frames, to find a Tenkan and Kijun Cross or a breakout of the Ich

This indicator is using two moving average , signal will be crated according to preset points on two Moving Average. In general, First signal is immadiate entrence and second order is limit order. color IndLevelColor=clrYellow; // Indicator Level Color extern int ArrowGap=35; // Close+-Arrow Gap Pips extern int SecondOrderEntryLevelPips=500;// Second Limit Order Entry Level Pips extern int HareketliOrtalamaGiris1=5; // 1. Moving Average extern int HareketliOrtalamaGiris2=35;// 2. Moving
Узнайте, как легко и просто купить торгового робота в MetaTrader AppStore - магазине приложений для платформы MetaTrader.
Платежная система MQL5.community позволяет проводить оплату с помощью PayPal, банковских карт и популярных платежных систем. Кроме того, настоятельно рекомендуем протестировать торгового робота перед покупкой, чтобы получить более полное представление о нем.
Вы упускаете торговые возможности:
- Бесплатные приложения для трейдинга
- 8 000+ сигналов для копирования
- Экономические новости для анализа финансовых рынков
Регистрация
Вход
Если у вас нет учетной записи, зарегистрируйтесь
Для авторизации и пользования сайтом MQL5.com необходимо разрешить использование файлов Сookie.
Пожалуйста, включите в вашем браузере данную настройку, иначе вы не сможете авторизоваться.