Работа завершена
Техническое задание
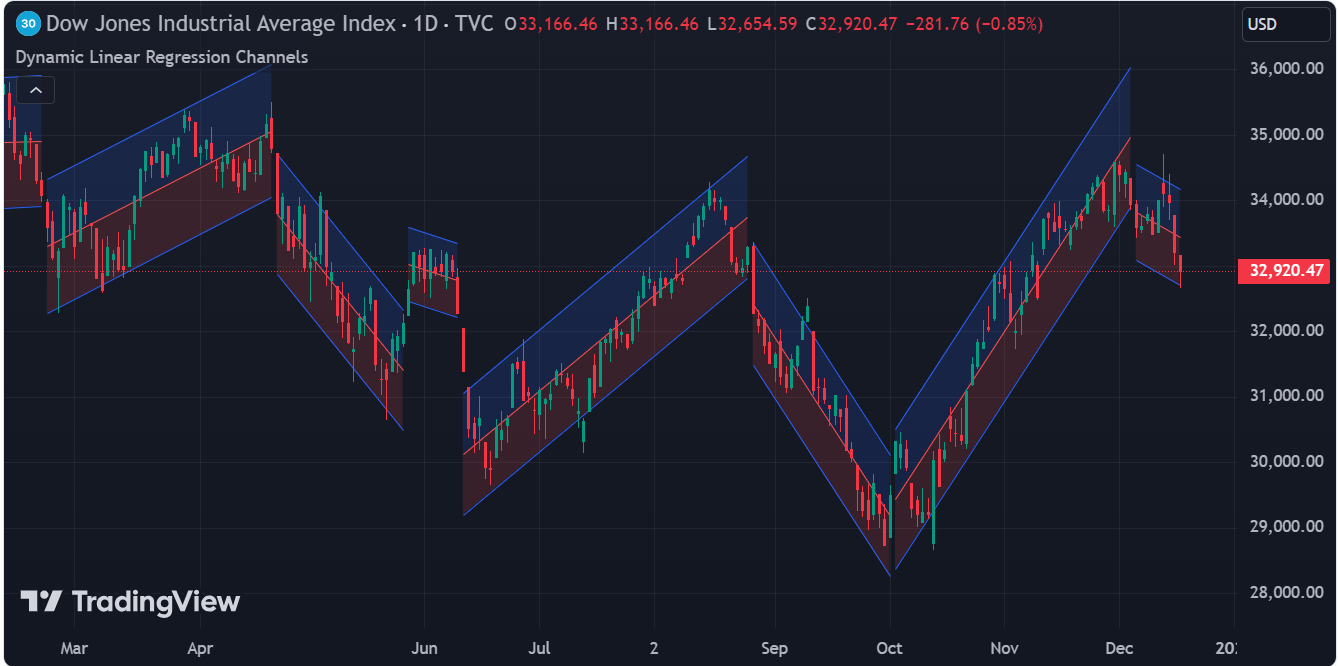
I am looking to convert the "Dynamic Linear Regression Channels" indicator by Iravan, available on TradingView, into an MQL5 indicator. The original TradingView indicator plots new linear regression channels dynamically from points where a previous channel is broken, adjusting the length of bars in the trend. This is particularly useful for detecting trend changes, identifying support and resistance levels, and trading mean reversions.
The MQL5 indicator should replicate the following key features:
- Dynamic linear regression channels that reset from points where the previous channel is broken.
- Adjustable upper and lower deviation settings, with a note that higher values might lead to errors if the price never breaks the channel and references more bars than supported by the platform.
- Accurate plotting of channels to assist in trend analysis and mean reversion trading strategies.
Please ensure that the MQL5 version functions as closely as possible to the TradingView original, with considerations for any platform-specific limitations or optimizations.
Looking forward to your proposals and any recommendations you might have for enhancing the indicator’s performance on MQL5.
//Base source is cloned from built-in technicals - "Linear Regression Channel", v26
//@version=5
indicator("Dynamic Linear Regression Channels", overlay=true, max_lines_count=500, max_boxes_count=500)
upperMultInput = input.float(2.0, title="Upper Deviation", inline = "Upper Deviation")
colorUpper = input.color(color.new(color.blue, 85), "", inline = "Upper Deviation")
lowerMultInput = input.float(2.0, title="Lower Deviation", inline = "Lower Deviation")
colorLower = input.color(color.new(color.red, 85), "", inline = "Lower Deviation")
calcSlope(source, length) =>
max_bars_back(source, 5000)
if barstate.isfirst or length <= 1
[float(na), float(na), float(na)]
else
sumX = 0.0
sumY = 0.0
sumXSqr = 0.0
sumXY = 0.0
for i = 0 to length - 1 by 1
val = source[i]
per = i + 1.0
sumX += per
sumY += val
sumXSqr += per * per
sumXY += val * per
slope = (length * sumXY - sumX * sumY) / (length * sumXSqr - sumX * sumX)
average = sumY / length
intercept = average - slope * sumX / length + slope
[slope, average, intercept]
var start_index = 1
lengthInput = bar_index - start_index + 1
[s, a, i] = calcSlope(close, lengthInput)
startPrice = i + s * (lengthInput - 1)
endPrice = i
calcDev(source, length, slope, average, intercept) =>
if barstate.isfirst or length <= 1
[float(na), float(na), float(na), float(na)]
else
upDev = 0.0
dnDev = 0.0
stdDevAcc = 0.0
dsxx = 0.0
dsyy = 0.0
dsxy = 0.0
periods = length - 1
daY = intercept + slope * periods / 2
val = intercept
for j = 0 to periods by 1
price = high[j] - val
if price > upDev
upDev := price
price := val - low[j]
if price > dnDev
dnDev := price
price := source[j]
dxt = price - average
dyt = val - daY
price -= val
stdDevAcc += price * price
dsxx += dxt * dxt
dsyy += dyt * dyt
dsxy += dxt * dyt
val += slope
stdDev = math.sqrt(stdDevAcc / (periods == 0 ? 1 : periods))
pearsonR = dsxx == 0 or dsyy == 0 ? 0 : dsxy / math.sqrt(dsxx * dsyy)
[stdDev, pearsonR, upDev, dnDev]
[stdDev, pearsonR, upDev, dnDev] = calcDev(close, lengthInput, s, a, i)
upperStartPrice = startPrice + upperMultInput * stdDev
upperEndPrice = endPrice + upperMultInput * stdDev
lowerStartPrice = startPrice - lowerMultInput * stdDev
lowerEndPrice = endPrice - lowerMultInput * stdDev
var baseLine = line.new(na, na, na, na, width=1, color=color.new(colorLower, 0))
var upper = line.new(na, na, na, na, width=1, color=color.new(colorUpper, 0))
var lower = line.new(na, na, na, na, width=1, color=color.new(colorUpper, 0))
linefill.new(upper, baseLine, color = colorUpper)
linefill.new(baseLine, lower, color = colorLower)
if (close > upperEndPrice or close < lowerEndPrice) and (not barstate.islast or barstate.isconfirmed)
_baseLine = line.new(bar_index - lengthInput + 1, startPrice[1], bar_index - 1, endPrice[1], width=1, color=color.new(colorLower, 0))
_upper = line.new(bar_index - lengthInput + 1, upperStartPrice[1], bar_index - 1, upperEndPrice[1], width=1, color=color.new(colorUpper, 0))
_lower = line.new(bar_index - lengthInput + 1, lowerStartPrice[1], bar_index - 1, lowerEndPrice[1], width=1, color=color.new(colorUpper, 0))
linefill.new(_upper, _baseLine, color = colorUpper)
linefill.new(_baseLine, _lower, color = colorLower)
start_index := bar_index
else if barstate.islast
j = close > upperEndPrice or close < lowerEndPrice ? 1: 0
line.set_xy1(baseLine, bar_index - lengthInput + 1, startPrice[j])
line.set_xy2(baseLine, bar_index - j, endPrice[j])
line.set_xy1(upper, bar_index - lengthInput + 1, upperStartPrice[j])
line.set_xy2(upper, bar_index - j, upperEndPrice[j])
line.set_xy1(lower, bar_index - lengthInput + 1, lowerStartPrice[j])
line.set_xy2(lower, bar_index - j, lowerEndPrice[j])