Conversion of "Dynamic Linear Regression Channels" from TradingView to MQL5 Indicator

MQL5 Indikatoren

Auftrag beendet

Ausführungszeit 8 Stunden
Bewertung des Kunden
Very smooth experience, great communication and professional.
Bewertung des Entwicklers
Great and professional customer! Thanks so much! 🤝🤝🤝

Spezifikation

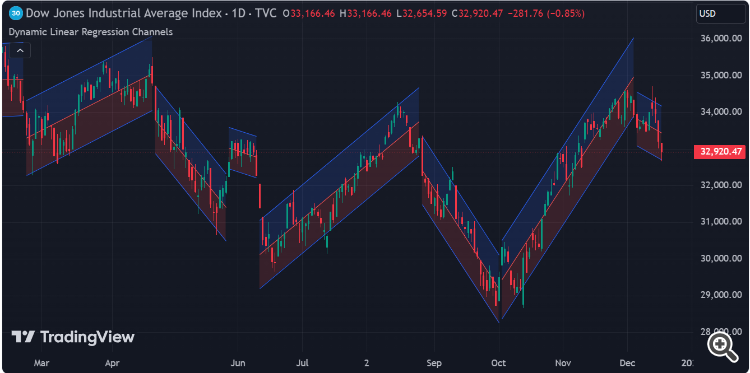
I am looking to convert the "Dynamic Linear Regression Channels" indicator by Iravan, available on TradingView, into an MQL5 indicator. The original TradingView indicator plots new linear regression channels dynamically from points where a previous channel is broken, adjusting the length of bars in the trend. This is particularly useful for detecting trend changes, identifying support and resistance levels, and trading mean reversions.

The MQL5 indicator should replicate the following key features:

  1. Dynamic linear regression channels that reset from points where the previous channel is broken.
  2. Adjustable upper and lower deviation settings, with a note that higher values might lead to errors if the price never breaks the channel and references more bars than supported by the platform.
  3. Accurate plotting of channels to assist in trend analysis and mean reversion trading strategies.

Please ensure that the MQL5 version functions as closely as possible to the TradingView original, with considerations for any platform-specific limitations or optimizations.

Looking forward to your proposals and any recommendations you might have for enhancing the indicator’s performance on MQL5.


//Base source is cloned from built-in technicals - "Linear Regression Channel", v26


//@version=5

indicator("Dynamic Linear Regression Channels", overlay=true, max_lines_count=500, max_boxes_count=500)


upperMultInput = input.float(2.0, title="Upper Deviation", inline = "Upper Deviation")

colorUpper = input.color(color.new(color.blue, 85), "", inline = "Upper Deviation")

lowerMultInput = input.float(2.0, title="Lower Deviation", inline = "Lower Deviation")

colorLower = input.color(color.new(color.red, 85), "", inline = "Lower Deviation")


calcSlope(source, length) =>

    max_bars_back(source, 5000)

    if barstate.isfirst or length <= 1

        [float(na), float(na), float(na)]

    else

        sumX = 0.0

        sumY = 0.0

        sumXSqr = 0.0

        sumXY = 0.0

        for i = 0 to length - 1 by 1

            val = source[i]

            per = i + 1.0

            sumX += per

            sumY += val

            sumXSqr += per * per

            sumXY += val * per

        slope = (length * sumXY - sumX * sumY) / (length * sumXSqr - sumX * sumX)

        average = sumY / length

        intercept = average - slope * sumX / length + slope

        [slope, average, intercept]


var start_index = 1

lengthInput = bar_index -  start_index + 1

[s, a, i] = calcSlope(close, lengthInput)

startPrice = i + s * (lengthInput - 1)

endPrice = i


calcDev(source, length, slope, average, intercept) =>

    if barstate.isfirst or length <= 1

        [float(na), float(na), float(na), float(na)]

    else

        upDev = 0.0

        dnDev = 0.0

        stdDevAcc = 0.0

        dsxx = 0.0

        dsyy = 0.0

        dsxy = 0.0

        periods = length - 1

        daY = intercept + slope * periods / 2

        val = intercept

        for j = 0 to periods by 1

            price = high[j] - val

            if price > upDev

                upDev := price

            price := val - low[j]

            if price > dnDev

                dnDev := price

            price := source[j]

            dxt = price - average

            dyt = val - daY

            price -= val

            stdDevAcc += price * price

            dsxx += dxt * dxt

            dsyy += dyt * dyt

            dsxy += dxt * dyt

            val += slope

        stdDev = math.sqrt(stdDevAcc / (periods == 0 ? 1 : periods))

        pearsonR = dsxx == 0 or dsyy == 0 ? 0 : dsxy / math.sqrt(dsxx * dsyy)

        [stdDev, pearsonR, upDev, dnDev]


[stdDev, pearsonR, upDev, dnDev] = calcDev(close, lengthInput, s, a, i)

upperStartPrice = startPrice + upperMultInput * stdDev

upperEndPrice = endPrice + upperMultInput * stdDev

lowerStartPrice = startPrice - lowerMultInput * stdDev

lowerEndPrice = endPrice - lowerMultInput * stdDev


var baseLine = line.new(na, na, na, na, width=1, color=color.new(colorLower, 0))

var upper = line.new(na, na, na, na, width=1, color=color.new(colorUpper, 0))

var lower = line.new(na, na, na, na, width=1, color=color.new(colorUpper, 0))    

linefill.new(upper, baseLine, color = colorUpper)

linefill.new(baseLine, lower, color = colorLower)


if (close > upperEndPrice or close < lowerEndPrice) and (not barstate.islast or barstate.isconfirmed)

    _baseLine = line.new(bar_index - lengthInput + 1, startPrice[1], bar_index - 1, endPrice[1], width=1, color=color.new(colorLower, 0))

    _upper = line.new(bar_index - lengthInput + 1, upperStartPrice[1], bar_index - 1, upperEndPrice[1], width=1, color=color.new(colorUpper, 0))

    _lower = line.new(bar_index - lengthInput + 1, lowerStartPrice[1], bar_index - 1, lowerEndPrice[1], width=1, color=color.new(colorUpper, 0))    

    linefill.new(_upper, _baseLine, color = colorUpper)

    linefill.new(_baseLine, _lower, color = colorLower)

    start_index := bar_index

else if barstate.islast

    j = close > upperEndPrice or close < lowerEndPrice ? 1: 0

    line.set_xy1(baseLine, bar_index - lengthInput + 1, startPrice[j])

    line.set_xy2(baseLine, bar_index - j, endPrice[j])

    line.set_xy1(upper, bar_index - lengthInput + 1, upperStartPrice[j])

    line.set_xy2(upper, bar_index - j, upperEndPrice[j])

    line.set_xy1(lower, bar_index - lengthInput + 1, lowerStartPrice[j])

    line.set_xy2(lower, bar_index - j, lowerEndPrice[j])
Bewerbungen

1
Entwickler 1
Bewertung
(810)
Projekte
1385
72%
Schlichtung
113
29% / 48%
Frist nicht eingehalten
343
25%
Arbeitet
2
Entwickler 2
Bewertung
(86)
Projekte
112
39%
Schlichtung
0
Frist nicht eingehalten
3
3%
Arbeitet
Ähnliche Aufträge
SNIPER ENTRY 30+ USD
1. Technical Analysis: Support and Resistance Levels: Look for areas where the price has historically bounced or reversed. Entering near these levels can increase the odds of a successful trade. Candlestick Patterns: Identify reversal patterns like pin bars or engulfing candles at support/resistance zones. 2. Indicators: Moving Averages: Use short-term moving averages (like the 50 or 200-day) to identify trends. A
Mega-FX Indicator 30 - 100 USD
Hello the Mega-Fx Indicator is currently running on MT4. I would need it in Mt5 and automatic trading with free setting of parameters. Specifically. When he should make a trade should be adjustable
Hello I need a good programmer to modify the Support and Resistance Indicator. It's an MTF indicator and I need it to draw Support and Resistance only when choosing TFs S/R coincide. For example, if I choose M5, M30, H4 and D1, the indicator will draw Support and Resistance when all these TF support and resistance coinside. In the setting, I must have: Use M1: True/False Use M5: True/False Use M15: True/False
We are seeking an experienced MQL4 developer to create a forecasting indicator with a prediction accuracy above 80%. The indicator must be capable of learning from historical market data starting from the year 2000 to the present. Additionally, it should offer an option to analyze and learn from all available candlesticks on the current timeframe, allowing it to adapt to real-time market conditions. Key Requirements
Hello! I need to create an indicator that is based on data from Cluster Delta. An exact description of the indicator and an example of how it works (there is a similar one) I can provide in detail for those interested. The indicator will be sold. So I would depend on a person who: - can combine the licence from Cluster Delta (licence to buy data from futures) with the indicator - can link to the subscriber database -
We are seeking an experienced MQL4 developer to create a forecasting indicator with a prediction accuracy above 80%. The indicator must be capable of learning from historical market data starting from the year 2000 to the present. Additionally, it should offer an option to analyze and learn from all available candlesticks on the current timeframe, allowing it to adapt to real-time market conditions. Key Requirements
dear coder we need high volume candle color according to session at mt5 indicator. Now we need candlestick color according to closing and we need only high volume bar color candlestick color according to its closing and we will pick high volume bar according to sessions like Asian. London and New York session, We need it at TF H1 , m15 , m5 , m1 high volume color candle according to its closing...if high volume bar
I need to fix the alerts of my SMC Order Blocks indicator, which is a custom indicator created for me some time ago. This custom indicator already has several types of alerts built-in, but I need to fix specific ones while keeping the other existing alerts unchanged, as those do not have any errors. The alert is for a specific Order Blocks pattern. This indicator graphically provides a zigzag, and from there, CHoCH
I use the translator I hope to make myself understood. I'm looking for a cyclical indicator. mt5. I attach videos to understand how it works. to be inserted at any point of the graph. It is possible to change the color and thickness of the line
Hi Guys, I am looking to someone that can generate an indicator for MT4 as explained below. Basically I would need that the indicator point out the price that will close my position in stop out/margin call. The indicator should pick automatically the level of trade out for the broker (which can be different from a broker to another broker) It should write (ideally on the bottom on the left) the following information

Projektdetails

Budget
30+ USD
Für die Entwickler
27 USD
Ausführungsfristen
von 1 bis 5 Tag(e)