Flat finder MT4
- Indicadores
- Yuriy Lyachshenko
- Versão: 1.0
- Ativações: 5
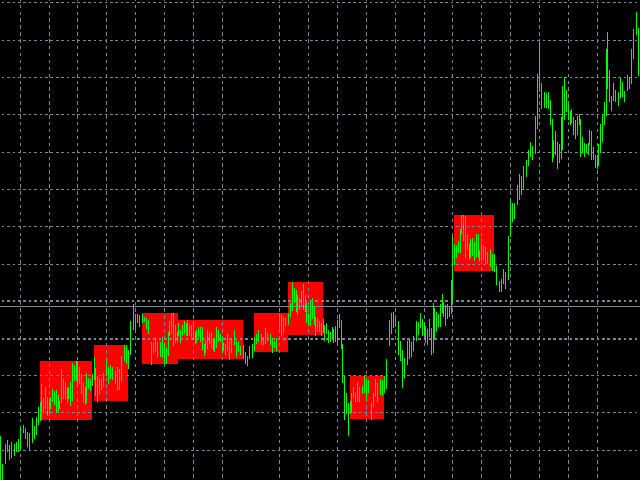
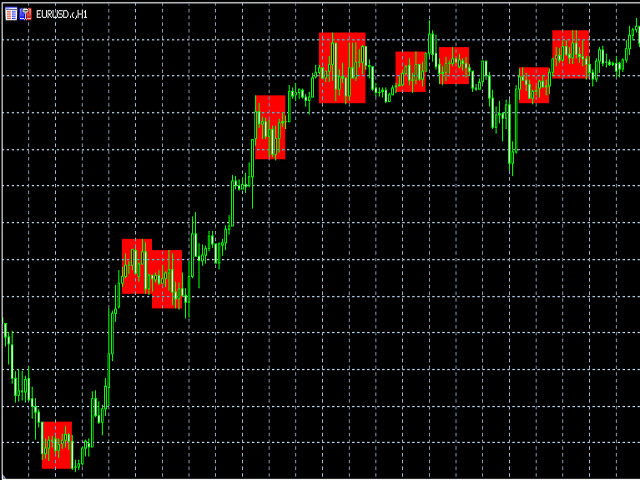
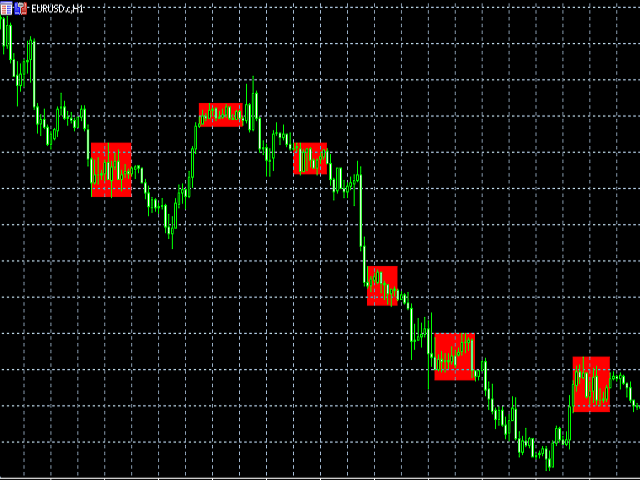
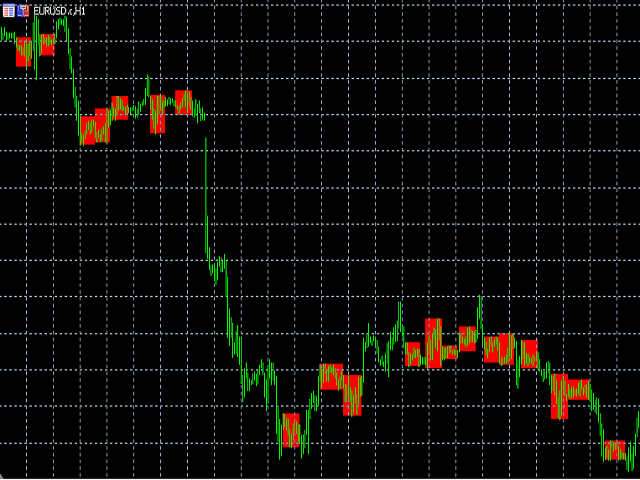
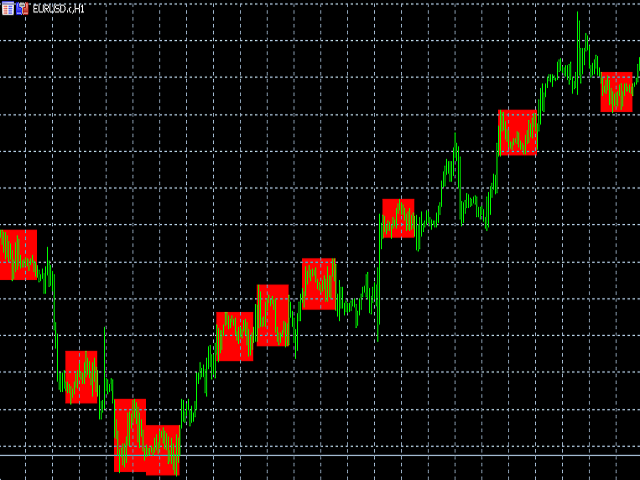
Este indicador detecta um flat e pinta a área encontrada com um retângulo colorido.
A ideia principal deste indicador é detetar um flat quando o preço preenche uma determinada área no gráfico.
Parâmetros de entrada:
Color rectangle - cor do retângulo a ser sombreado.
Bars in rectangle - número mínimo permitido de barras num retângulo.
Density in % - densidade do flat, definida como uma percentagem da área do retângulo.