Flat finder MT4
- 지표
- Yuriy Lyachshenko
- 버전: 1.0
- 활성화: 5
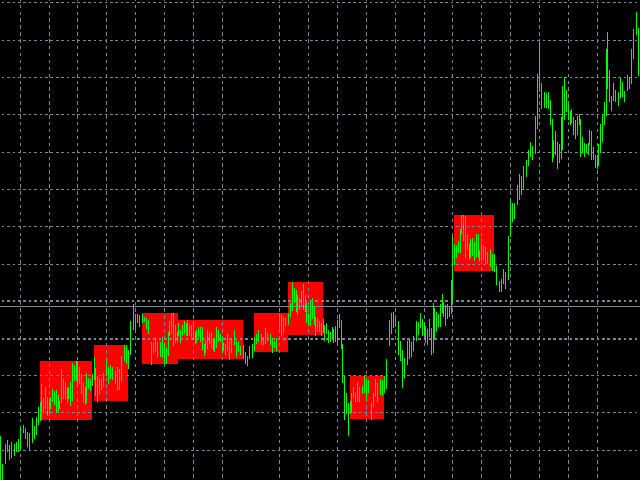
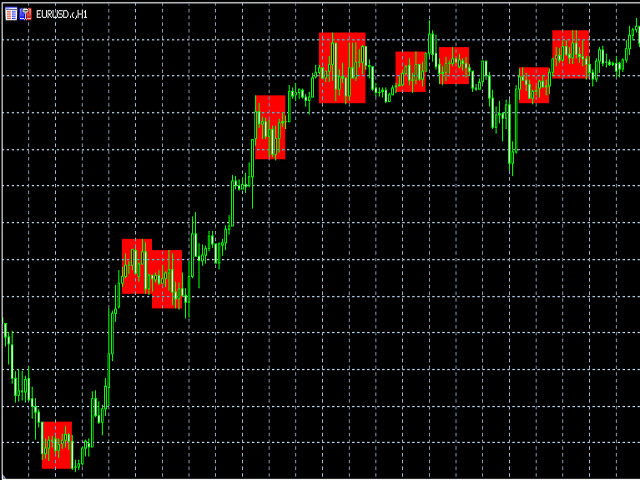
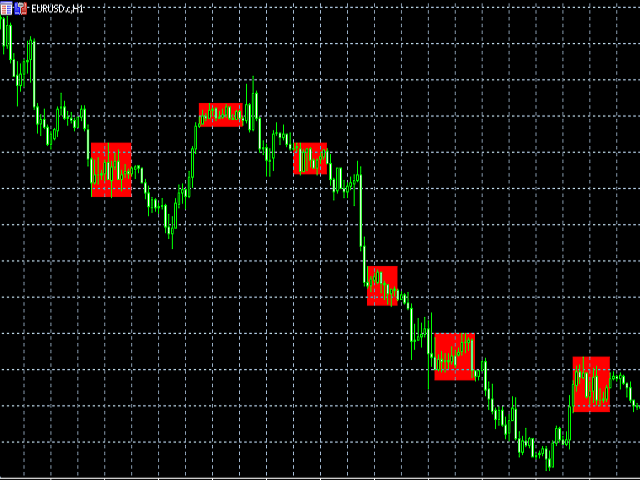
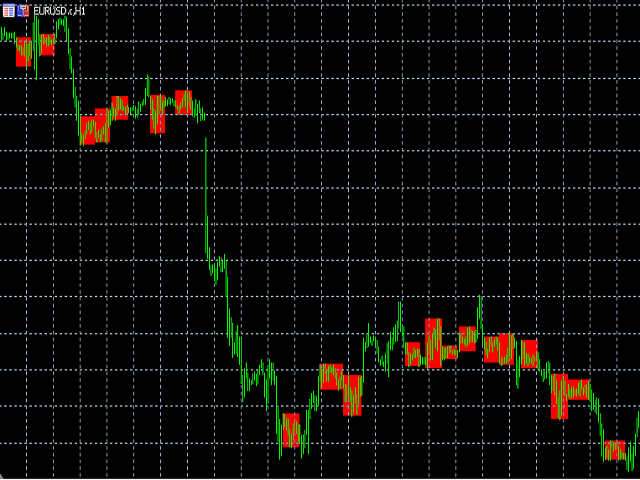
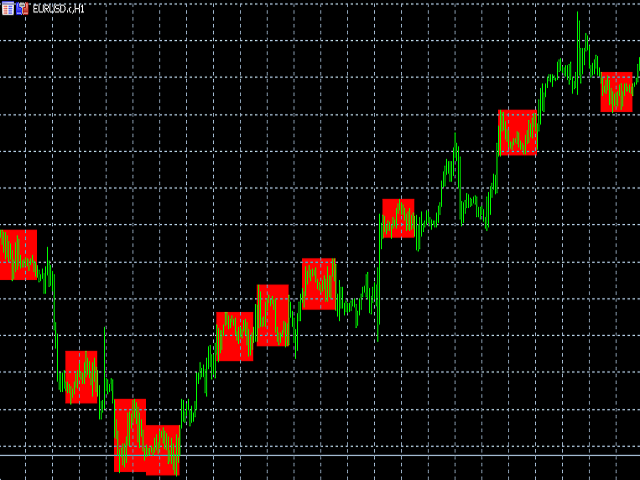
이 인디케이터는 플랫을 감지하고 발견된 영역을 컬러 직사각형으로 칠합니다.
이 인디케이터의 주요 아이디어는 가격이 차트의 특정 영역을 채울 때 플랫을 감지하는 것입니다.
입력 매개변수:
Color rectangle - 음영 처리할 사각형의 색상입니다.
Bars in rectangle - 직사각형에 허용되는 최소 막대 수입니다.
Density in % - 플랫의 밀도로, 사각형 영역의 백분율로 설정합니다.
이 인디케이터의 주요 아이디어는 가격이 차트의 특정 영역을 채울 때 플랫을 감지하는 것입니다.
입력 매개변수:
Color rectangle - 음영 처리할 사각형의 색상입니다.
Bars in rectangle - 직사각형에 허용되는 최소 막대 수입니다.
Density in % - 플랫의 밀도로, 사각형 영역의 백분율로 설정합니다.
__________________________________________________________________
__________________________________________________________________