Flat finder MT4
- Indicators
- Yuriy Lyachshenko
- Version: 1.0
- Activations: 5
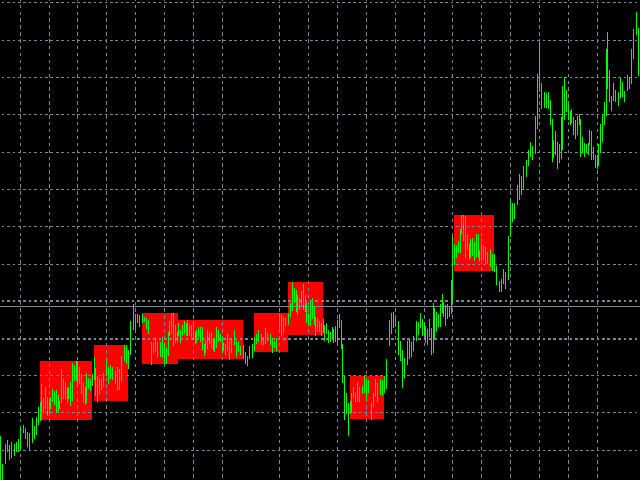
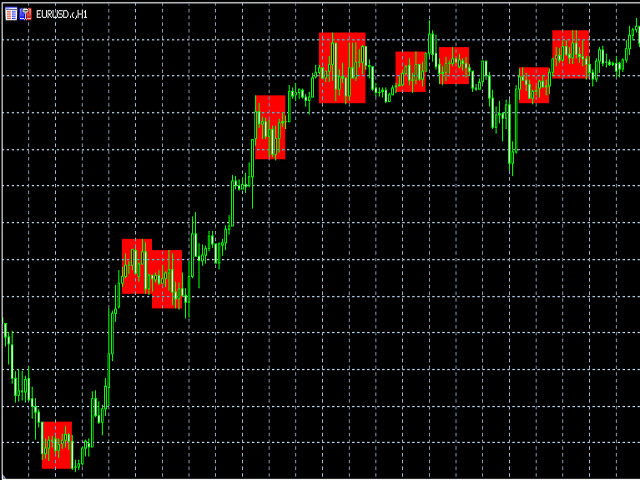
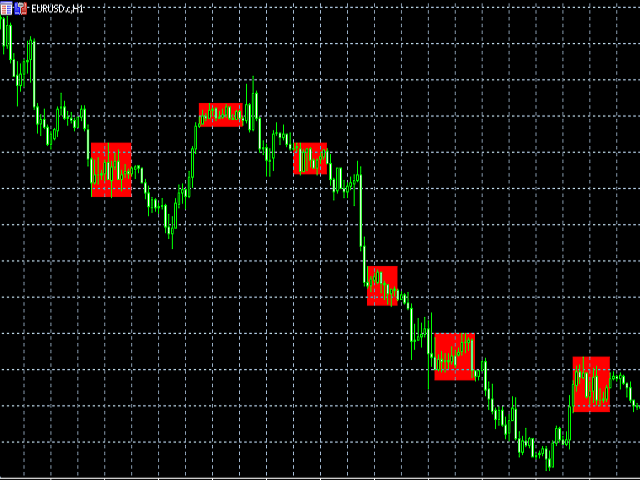
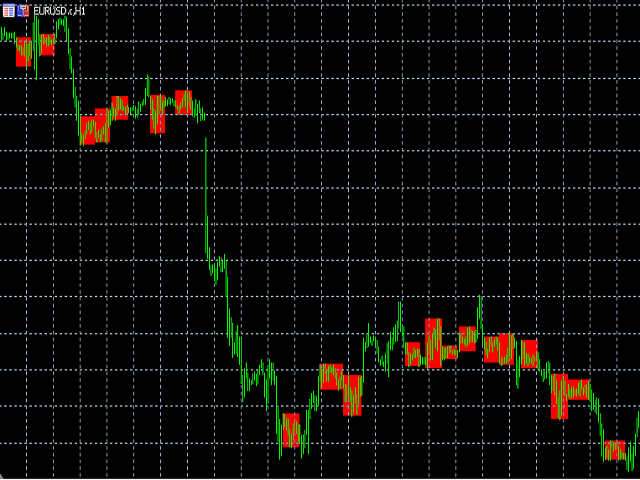
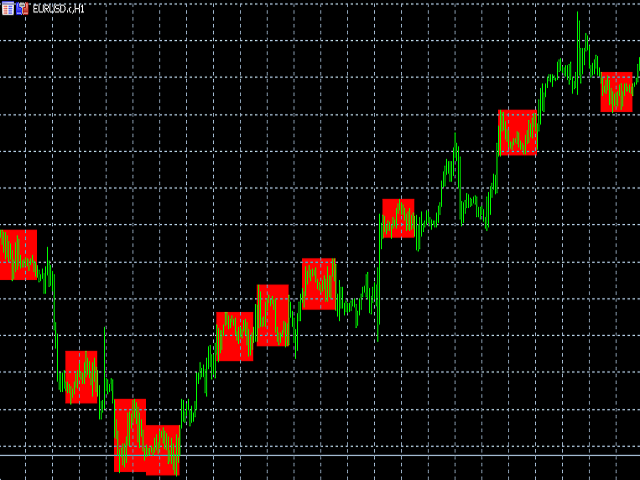
This indicator detects a flat and paints the found area with a colored rectangle.
The main idea of this indicator is to detect a flat as the price fills a certain area on the chart.
Input parameters:
Color rectangle - color of the rectangle to be shaded.
Bars in rectangle - minimum allowed number of bars in a rectangle.
Density in % - density of the flat, set as a percentage of the rectangle area.