• Visão global
  • Comentários
  • Discussão

Bayes Quantum Signals

This is a system that allows you to instantly calculate future predictions about the movement of a listed asset, to better inform your buying or selling decisions and reduce the risk of your operations.  Bayes Quantum Signal can be used in algorithmic trading mode as an Expert Advisor, or also in a complementary way to support your own trading strategy. In this case, the system will display the bullish or bearish probabilities on your Metatrader 5 screen.

How does Bayes Quantum Signal work?

This algorithm is mainly based on a dynamic application of Bayes' theorem, concepts of differential calculus and financial econometrics.

The system steps are as follows:

1. A historical database is taken, whose extension and temporality are defined by the same operator.

2. From this base, the system calculates the bullish and bearish prior probabilities, and weights them based on their standard deviation measured dynamically through an eGARCH model. The basic idea is that larger and more skewed returns will have a larger impact on the calculation of posterior probabilities.

3. At all times the system calculates the real-time return of the candle that is forming and weights it with the previously calculated standard deviation. This is where the system applies Bayes' Theorem to constantly update the conditional probability calculation. In natural language, this can be expressed as "given that return x is occurring right now, what is the probability that the price will go up or down?"

It is important to highlight that both the previous and posterior probabilities are updated in real time, that is,  Bayes Quantum Signal always takes the last n candles for its calculations. This is the key point of the system, and it allows us to offer added value to our clients. Of course, a human cannot do this calculation in real time, or at least his/her margin of error will be much higher.

4. If the posterior probabilities are equal or exceed the inputs given by the user, then a buy or sell order will be activated as appropriate. The system allows you to modify the lot of both bying and selling operations before execution, as well as the take profit and stop loss of said orders (measured in points). Furthermore, these probabilities can be seen on the operator's screen, the color and font of which can be customized.
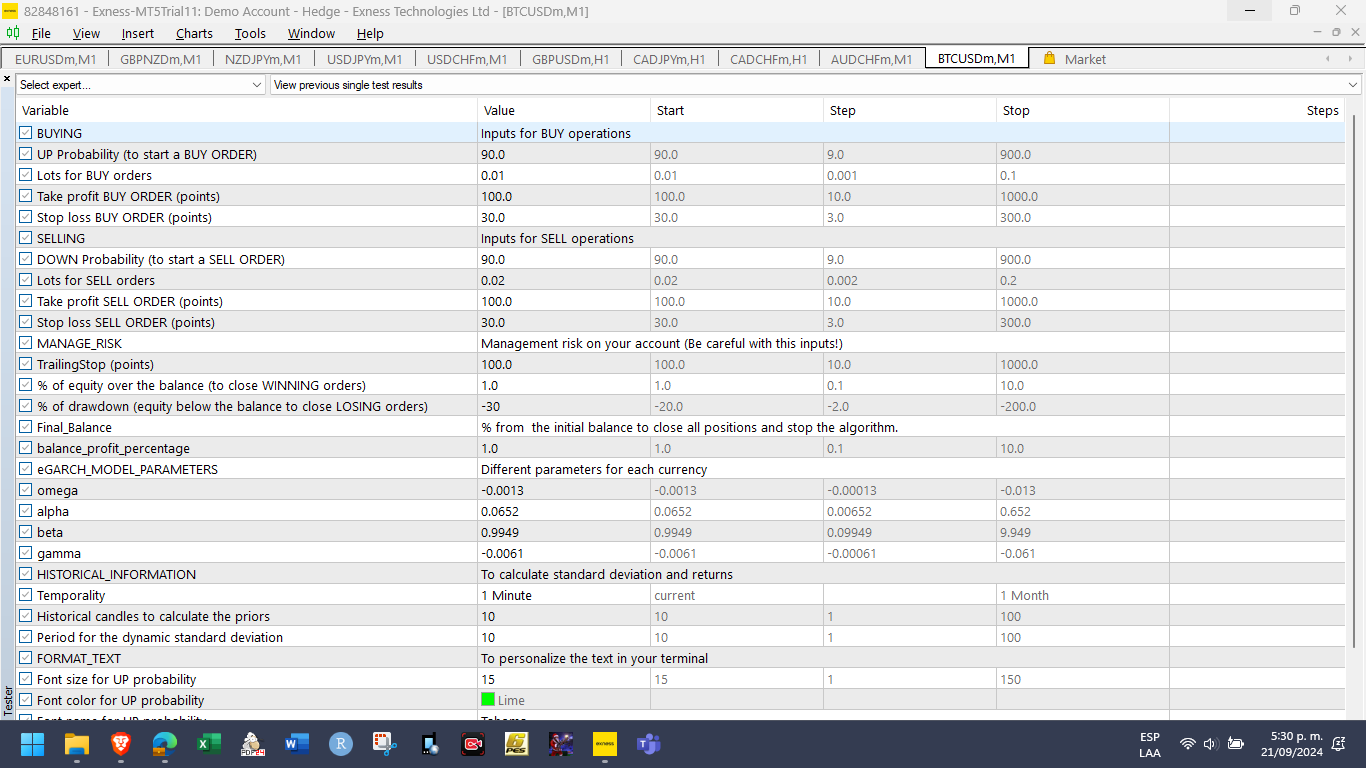
Input parameters: 

For a better visualization, the EA will display a dialog box separated by the following sections, in which the user must define the following inputs for each type of order: 

Buying operations

  • UP Probability (to start a BUY ORDER): Minimum probability value for which the user wants to start a buy order. It is defined as a number from 0 to 100. For example, to enter when the algorithm calculates an 80% UP probability, you enter the number 80 as input (without percentage notation).
  • Lots for BUY orders: Number of lots for each buy order. It is a fixed amount.
  • Take profit BUY ORDER (points): Fixed level of take profit for each buy order. It is defined in points.  
  • Stop loss BUY ORDER (points): Fixed stop loss level for each buy order. It is defined in points. 

Selling operations

  • DOWN Probability (to start a SELL ORDER): Minimum probability value for which the user wants to start a sale order.  It is defined as a number from 0 to 100. For example, to enter a sale order when the algorithm calculates an 80% down probability, you enter the number 80 as input (without percentage notation).
  • Lots for SELL orders: Number of lots for each sale order. It is a fixed amount.
  • Take profit SELL ORDER (points): Fixed take profit level for each sale order. It is defined in points.  
  • Stop loss SELL ORDER (points): Fixed stop loss level for each sale order. It is defined in points.  

Risk management in your account:

Important note:  Bayes Quantum Signal applies take profit and stop loss on some orders, which can be linked to the TrailingStop (points) input, where the user can define the points to apply trailing stops to previously defined levels. 

In those orders that are created without take profit or stop loss, the algorithm manages its profits and losses with the 3 points defined below: 

  • % of equity over the balance (to close WINNING orders): Define the percentage of equity above the balance at which all WINNING orders will be closed.
  • % of drawdown (equity below the balance to close LOSING orders): Define the percentage of equity below the balance at which all LOSING orders will be closed.
  • Balance_profit_percentage: Define the final percentage you expect to obtain on your balance and at which all WINNING and LOSING orders will be closed.

eGARCH Model Specification:

At this point it is important to highlight that each financial asset will have its own parameters. It is recommended to study the fundamentals of the eGARCH model or access reliable sources to obtain these parameters. You can also run your own regressions in some statistical software for this purpose.

  • omega: Long-term volatility
  • alpha: Impact of lagged volatility on current volatility
  • beta: Persistence of volatility over time
  • gamma: Asymmetry or leverage on volatility

Parameters for historical information

  • Temporality: Drop-down list in which the user can choose a temporality from one minute to one month.
  • Historical candles to calculate the priors: Number of candles that the user considers for the model to calculate the prior probabilities. These are related to the previously chosen temporality. For example, if the user chooses a time frame of 1 minute, and in this input defines 10, the model will take prior information from the previous 10 minutes. 
  • Period for the dynamic standard deviation: Number of candles that the user considers for the model to calculate the standard deviation through the eGARCH model.

Inputs to format the text

The user can give the desired format to the text displayed on the screen, like this: 

  • Font size for UP probability: Font size for the bullish probability text.
  • Font color for UP probability: Font color for the bullish probability text.
  • Font name for UP probability: Font name for the bullish probability text.
  • Font size for DOWN probability: Font size for the bearish probability text.
  • Font color for DOWN probability: Font color for bearish probability text
  • Font name for DOWN probability: Font name for the bearish probability text.

Final recommendations:

1. According to the tests carried out, this system is designed to open positions from 1 minute and on. It is important that you test the system to adjust it according to your own needs and investment objectives.

2. Please watch the full video in which I explain how the system works.

Thank you for your time.


Produtos recomendados
Market Profile 3 ForexArby com
Hussien Abdeltwab Hussien Ryad
3.83 (12)
Market Profile 3 MetaTrader 5 indicator  version 4.70— is a classic Market Profile implementation that can show the price density over time, outlining the most important price levels, value area, and control value of a given trading session. This indicator can be attached to timeframes between M1 and D1 and will show the Market Profile for daily, weekly, monthly, or even intraday sessions. Lower timeframes offer higher precision. Higher timeframes are recommended for better visibility. It is als
FREE
Renko Plus
Eadvisors Software Inc.
Com o Renko Plus você consegue utilizar os recursos na funcionalidade Indicador, basta adicioná-lo ao gráfico do Metatrader5.             O gráfico Renko é um tipo de gráfico, desenvolvido pelos japoneses, que é construído usando o movimento de preços em vez de preços e intervalos de tempo padronizados, como a maioria dos gráficos. Acredita-se que tenha o nome da palavra japonesa para tijolos, "renga", já que o gráfico se parece com uma série de tijolos.             Um novo tijolo
Renko Chart
Marcin Konieczny
3.63 (8)
This indicator allows to display Renko charts in the indicator window. Renko charts show only price movements that are bigger than the specified box size. It helps to eliminate noise and allows to focus on main trends. Time is not a factor here. Only price movements are taken into account. That's why Renko chart is not synchronized with the main chart it is attached to. Indicator works in two modes: CLOSE - only close prices are taken into account while building the chart HIGH_LOW - only high/
FREE
O Captador de Tendências: A Estratégia do Captador de Tendências com Indicador de Alerta é uma ferramenta versátil de análise técnica que auxilia os traders na identificação de tendências de mercado e potenciais pontos de entrada e saída. Apresenta uma Estratégia dinâmica do Captador de Tendências, adaptando-se às condições do mercado para uma representação visual clara da direção da tendência. Os traders podem personalizar os parâmetros de acordo com suas preferências e tolerância ao risco.
FREE
O indicador cria cotações atuais, que podem ser comparadas com as históricas e, com base nisso, fazer uma previsão do movimento dos preços. O indicador possui um campo de texto para navegação rápida até a data desejada. Opções: Símbolo - seleção do símbolo que o indicador exibirá; SymbolPeriod - seleção do período do qual o indicador coletará dados; IndicatorColor - cor do indicador; HorisontalShift - deslocamento das cotações desenhadas pelo indicador pelo número especificado de
This indicator uses a mathematical calculation algorithm . This algorithm calculates the remainder between the updated model and the actual values and produces the possible progress of the graph on the graph. It is not a super prophet in trading, but it is very good for the trader when entering the market and to analyze it before entering. Applicable for all currencies. Данный индикатор использует алгоритм математических вычислений . Данный алгоритм вычисляет остаток между обновленной моделью и
Introduction This indicator detects volume spread patterns for buy and sell opportunity. The patterns include demand and supply patterns. You might use each pattern for trading. However, these patterns are best used to detect the demand zone (=accumulation area) and supply zone (=distribution area). Demand pattern indicates generally potential buying opportunity. Supply pattern indicates generally potential selling opportunity. These are the underlying patterns rather than direct price action. T
FREE
Lorentzian AI
Michael Prescott Burney
Lorentzian A.I Indicator System Revolutionize your trading strategy with the Lorentzian A.I Indicator System, an advanced tool designed for traders who demand precision and adaptability. Whether you're trading Crypto, Indices, Forex, or Stocks, this state-of-the-art indicator uses cutting-edge technology to keep you ahead of the market. Key Features: Advanced Lorentzian Classification (LC): Utilize sophisticated LC algorithms to generate precise buy and sell signals, ensuring you make informed
FREE
The indicator detects and displays М. Gartley's Butterfly pattern. The pattern is plotted by the extreme values of the ZigZag indicator (included in the resources, no need to install). After detecting the pattern, the indicator notifies of that by the pop-up window, a mobile notification and an email. The pattern and wave parameters are displayed on the screenshots. The default parameters are used for demonstration purposes only in order to increase the amount of detected patterns. Parameters
Auto Fibonacci
Ali Gokay Duman
5 (2)
This indicator calculates fibonacci levels via moving averages trend and draw these lines. You can change fast and slow Moving Averages settings for customization. Inputs: Fast MA Time Period :  64 Fast MA Shift: 0 Fast MA Method: Smoothed Fast MA Apply To: Median Price Slow MA Time Period: 32 Slow MA Shift: 0 Slow MA Method: Smoothed Slow MA Apply To: Median Price ZigZag: False ZigZag Color: Red ZigZag Type: DashDot ZigZag Width: VeryThin Fibo Settings TrendFibonacci: True FiboTrendColor: Blac
FREE
GoldTrader
Yashar Seyyedin
Please backtest with the exact balance of your live account before applying to real money. ==> If account balance is too low it may not trade at all! For MT4 version please contact via private message. martingale version is available here . Strategy description - Detect trend based on EMA18-EMA50-SMA200 alignment in three time frames: M15, H1, H4 - Trade in trend direction and exit when above alignment is broken. - The bot is tuned to trade XAUUSD(Gold). - The bot output is break even in rangi
FREE
What is this indicator? This indicator is the MACD (Moving Average Convergence/Divergence) supporting Virtual Trading mode of  Knots Compositor . When the mode is turned on, the indicator will be recalculated based on the displayed candlesticks. When the mode is turned off, the indicator will be recalculated based on the original chart candlesticks. Types of the applied price - Close - Open - High - Low - Median Price (HL/2) - Typical Price (HLC/3) - Weighted Price (HLCC/4) KC-Indicators
FREE
Order Book, known also as Market Book, market depth, Level 2, - is a dynamically updated table with current volumes of orders to buy and to sell specific financial instument at price levels near Bid and Ask. MetaTrader 5 provides the means for receiving market book from your broker, but in real time only, without access to its history. The indicator OrderBook Cumulative Indicator accumulates market book data online and visualizes them on the chart. In addition, the indicator can show the market
Advanced 4xZeovo MT5 Indicator (MetaTrader 5)   Product Description  4xZeovo is a powerful trading indicator system monitoring 24/7 financial markets. Metatrader5 tool designed to find the best buying/selling opportunities and notifies the user.    Making life easy for traders in helping with the two most difficult decisions with the use of advanced innovate trading indicators aiming to encourage users to hold the winning positions and take profit at the best times.    Equipped with a unique tra
This is a multi-symbol and multi-timeframe table-based indicator designed for a candlestick patterns detection with 46 patterns for META TRADER 5. Each formation has own image for easier recognition. Here you find most popular formations such as "Engulfing", "Hammer", "Three Line Strike", "Piercing" or Doji - like candles. Check my full list of patterns on my screenshots below. Also you can not only switch all bearish or bullish patterns from input, but also select formation for a specified symb
Basic Harmonic Pattern MT5
Mehran Sepah Mansoor
4.8 (54)
Este indicador identifica os   padrões harmónicos   mais populares que prevêem os pontos de inversão do mercado. Estes padrões harmónicos são formações de preços que se repetem constantemente no mercado forex e sugerem possíveis movimentos de preços futuros /   Versão MT4 gratuita Além disso, este indicador tem um sinal de entrada no mercado incorporado, bem como vários take profits e stop losses. Deve-se notar que, embora o indicador de padrão harmónico possa fornecer sinais de compra / vend
FREE
What is this indicator? This indicator is the RSI (Relative Strength Index) supporting Virtual Trading mode of  Knots Compositor . When the mode is turned on, the indicator will be recalculated based on the displayed candlesticks. When the mode is turned off, the indicator will be recalculated based on the original chart candlesticks. Types of the applied price - Close - Open - High - Low - Median Price (HL/2) - Typical Price (HLC/3) - Weighted Price (HLCC/4) KC-Indicators -   KC-MA   (M
FREE
this little free tool allows you to set 5 vertical lines at specific time. you can use it to mark london open / asia open / comex open and so on... it draws the lines in the future space - so you wont miss an important time / candle you can select color..thickness of the lines you can select only 2 or 3 of the 5 max. lines - you dont have to use the max. 5 lines. i use it myself to never miss the best times to trade.
FREE
Gino Renko
Stephane, Andr Valette
1 (1)
Another renko-based indicator. It returns different usable values ​​for an EA, and is directly displayed on the main chart. Its setting is very simple: The size of the renko The number of bars taken into account The falling color The color on the rise Returned values: Buffer 0 : Value of the middle Buffer 1 : Value of the Top Buffer 2 : Value of the Bottom Buffer 3 : Direction of renko (0.0 for top ; 1.0 for bottom) Buffer 4 : Ratio of the renko, for example, if it is twice, 3 times, ro more of
Important Lines
Terence Gronowski
4.85 (20)
This indicator displays Pivot-Lines, preday high and low, preday close and the minimum and maximum of the previous hour. You just have to put this single indicator to the chart to have all these important lines, no need to setup many single indicators. Why certain lines are important Preday high and low : These are watched by traders who trade in a daily chart. Very often, if price climbs over or falls under a preday low/high there is an acceleration in buying/selling. It is a breakout out of
FREE
Este é um indicador de agressão comprador e vendedor que analisa o formato de cada vela e projeta esses dados em forma de histograma. Há 4 histogramas em um só. Na parte frontal temos dois: Superior - força compradora Inferior - força vendedor Na parte de trás temos também dois histogramas, ambos da mesma cor. Eles medem a força conjunta dos compradores e vendedores. Esses histogramas podem ser desativados nos Parâmetros de Entrada. É possível também ter o volume real ou de tick para fazer essa
FREE
Donchian Pro
Paulo Henrique Faquineli Garcia
5 (2)
O Canal Donchian Os canais são uma das ferramentas de análise técnica mais populares porque transmitem intuitivamente aos analistas as restrições que tendem a ocorrer na maioria das mudanças de preço. Os usuários do canal sabem que informações valiosas podem ser obtidas a qualquer momento, independentemente de o preço estar no centro de uma faixa ou próximo a uma das fronteiras. Uma das técnicas mais famosas para explorar esses conceitos são as bandas de Bollinger. No entanto, John Bollinger não
FREE
High Low Open Close
Alexandre Borela
4.97 (37)
Se você gosta deste projeto, deixe uma revisão de 5 estrelas. Seguir em instagram: borelatech Este indicador desenha os preços abertos, altos, baixos e finais para o especificado período e pode ser ajustado para um fuso horário específico. Estes são níveis importantes olhados por muitos institucional e profissional comerciantes e pode ser útil para você saber os lugares onde eles podem ser mais activa. Os períodos disponíveis são: Dia anterior. Semana anterior. Mês anterior. Quarto anterior
FREE
WH DrawFib Pro MT5
Wissam Hussein
5 (4)
Você está cansado de desenhar manualmente os níveis de Fibonacci em seus gráficos? Você está procurando uma maneira conveniente e eficiente de identificar os principais níveis de suporte e resistência em sua negociação? Não procure mais!   Apresentando o DrawFib Pro, o melhor indicador MetaTrader 5 que faz   níveis   automáticos de fibonacci       desenhando em seus gráficos e fornece alertas oportunos quando esses níveis são violados. Com o DrawFib Pro, você pode aprimorar suas estratégias de n
FREE
Bem-vindo ao HiperCube Renko Velas Este indicador fornece informações reais do mercado e transforma-o em Renko Candle Style. Definição Os gráficos Renko são um tipo de gráfico financeiro que mede e traça as variações de preços, utilizando tijolos (ou barras) para representar os movimentos de preços. Ao contrário dos gráficos de velas tradicionais, os gráficos Renko não exibem informações baseadas no tempo, concentrando-se apenas nas flutuações de preços. Funcionalidades: Indicador em jan
FREE
Owl Smart Levels MT5
Sergey Ermolov
4.07 (28)
Versão MT4  |  FAQ O Indicador Owl Smart Levels é um sistema de negociação completo dentro de um indicador que inclui ferramentas populares de análise de mercado, como fractais avançados de Bill Williams , Valable ZigZag que constrói a estrutura de onda correta do mercado e níveis de Fibonacci que marcam os níveis exatos de entrada no mercado e lugares para obter lucros. Descrição detalhada da estratégia Instruções para trabalhar com o indicador Consultor de negociação Owl Helper Chat privado d
Vela Especial Você gostaria de usar um dos melhores indicadores de câmbio baseado na estratégia Ichimoku, que é muito bem sucedida? Você pode usar um ótimo indicador baseado na estratégia Ichimoku. A versão MT4 está disponível aqui. Primeira estratégia: Esta estratégia inclui identificar intersecções semelhantes e raras e poderosas. Os horários mais adequados para esta estratégia são 30 minutos (30M) e 1 hora (H1). Os símbolos adequados para o gráfico de 30 minutos são: • CAD/JPY • CH
The Candle Countdown Timer for MetaTrader 4 (also available for MT5) is a vital indicator designed to help you manage your trading time effectively. It keeps you updated about market open and close times by displaying the remaining time before the current candle closes and a new one forms. This powerful tool enables you to make well-informed trading decisions. Key Features: Asia Range: Comes with an option to extend the range. Broker Time, New York, London Time: Displays the current broker time
FREE
DALA Forecast
Grigorii Matsnev
About the indicator: DALA Forecast is a universal tool for predicting the dynamics of time series of any nature. For prediction, modified methods of nonlinear dynamics analysis are used, on the basis of which a predictive model is built using machine learning methods.  To get the trial version of the indicator, you can contact me in private messages. How to use the indicator: Apply the indicator to your chosen financial instrument or indicator with the settings you need. The prediction will b
FREE
Follow The Line MT5
Oliver Gideon Amofa Appiah
4.5 (28)
This indicator obeys the popular maxim that: "THE TREND IS YOUR FRIEND" It paints a GREEN line for BUY and also paints a RED line for SELL. (you can change the colors). It gives alarms and alerts of all kinds. IT DOES NOT REPAINT and can be used for all currency pairs and timeframes. Yes, as easy and simple as that. Even a newbie can use it to make great and reliable trades. NB: For best results, get my other premium indicators for more powerful and reliable signals. Get them here: https://www.m
FREE
Os compradores deste produto também adquirem
Attention: this is a multicurrency EA, which trades by several pairs from one chart!  Therefore, in order to avoid duplicate trades, it is necessary to attach EA only to one chart, ---> all trading in all pairs is conducted only from one chart! we can trade simultaneously in three different pairs, as by default (EURUSD + GBPUSD + AUDUSD), which take into account the correlation when entering the market for all three; we can trade only EURUSD (or any currency pair) and at the same time take into
Adam FTMO MT5
Vyacheslav Izvarin
5 (2)
ADAM EA Special Version for FTMO Please use ShowInfo= false for backtesting ! Our 1st EA created using ChatGPT technology Trade only GOOD and checked PROP FIRMS  Default parameters for Challenge $100,000 Tested on EURUSD and GBPUSD only  Use 15MIN Time Frame Close all deals and Auto-trading  before Weekend at 12:00 GMT+3  Friday For Prop Firms MUST use special Protector  https://www.mql5.com/en/market/product/94362 -------------------------------------------------------------------------------
Hedge Ninja
Robert Mathias Bernt Larsson
5 (1)
Make sure to join our Discord community over at www.Robertsfx.com , you can also buy the EA at robertsfx.com WIN NO MATTER IN WHICH DIRECTION THE PRICE MOVES This robot wins no matter in which direction the price moves by following changing direction depending on in which direction price moves. This is the most free way of trading to this date. So you win no matter which direction it moves (when price moves to either of the red lines as seen on the screenshot, it wins with the profit target yo
Gold Pip Sniper MT5
Muhammed Sharookh Chittethukudiyil
Oferta por tempo limitado:  O preço atual de 119 dólares está disponível apenas para as primeiras 5 compras!  Depois disso, o preço aumentará para 999 dólares.  Não perca esta exclusividade  oportunidade - aja rapidamente antes que a oferta termine!  Rich Market Minds Scalper EA: Scalping de precisão para novas tendências de mercado.     O Rich Market Minds Scalper EA foi habilmente concebido para aproveitar as vantagens das novas e emergentes tendências de mercado com velocidade e p
FiboPlusWaves MT5
Sergey Malysh
5 (1)
Uma série de produtos sob marca FiboPlusWave Um sistema comercial pronto baseado nas  ondas de Elliott e níveis de Fibonacci . Simples e de fácil acesso. Exibição de marcação das ondas de Elliott (opção geral ou alternativa) em um gráfico. Construção dos níveis horizontais, linhas de apoio e resistência, canal. Sobreposição dos níveis de Fibonacci para as ondas 1, 3, 5, A Sistema de alerta (no ecrã, E-Mail, Push notificações).    Particularidade s : sem se aprofundar na teoria das ondas de Ellio
Mt5BridgeBinary
Leandro Sanchez Marino
Automatizei as suas estratégias comerciais para o uso do binário em MT5 e com o nosso Mt5BridgeBinary enviei as ordens à sua conta Binária e inclino-me: comece a fazer funcionar este caminho do fácil! Os aconselhadores peritos são fáceis formar, otimizar e realizar testes de robustez; também no teste podemos projetar a sua rentabilidade de longo prazo, por isso criamos Mt5BridgeBinary para unir as suas estratégias melhores ao Binário. Características: - Pode usar tantas estratégias como des
Xrade EA
Yao Maxime Kayi
Xrade EA is an expert advisor as technical indicator. For short period trade it's the best for next previsions of the trend of the market. +--------------------------------------------------------------------------------------- Very Important Our robot(data anylizer) does'nt take a trade procedure. If using only our robot you must take positions by yoursels +--------------------------------------------------------------------------------------- The technical indiator provide for a give
Technical confluence zones is a very popular tool for traders. This EA detects such zones by studying chart patterns, naked price levels, fib levels, SMA/EMA over multiple timeframes and more. The source data is loaded from Mytradingpet.com. To find out what are factored in when determining such zones, visit https://mytradingpet.com - a free service for all traders. The zones are color coded. Purple indicates the highest level of confluence.
PROMOTION!! $499 until 1 Mar. After that, EA will be $1,050 Developed and tested for over 3 years, this is one of the safest EAs on the planet for trading the New York Open. Trading could never be easier.  Trade On NASDAQ US30 (Dow Jones Industrial Average) S&P 500  What Does The EA do? The EA will open a Buy Stop Order and a Sell Stop Order(With SL and TP) on either side of the market just a few seconds before the NY Open.  As soon as 1 of the 2 trades is triggered, the EA automatically delete
Salvando dados do livro de pedidos. Utilitário de repetição de dados: https://www.mql5.com/pt/market/product/71640 Biblioteca para uso no testador de estratégia: https://www.mql5.com/pt/market/product/81409 Talvez, então, apareça uma biblioteca para utilizar os dados salvos no testador de estratégia, dependendo do interesse neste desenvolvimento. Agora, há desenvolvimentos desse tipo usando memória compartilhada, quando apenas uma cópia dos dados está na RAM. Isso não apenas resolve o problem
Gold instrument scanner is the chart pattern scanner to detect the triangle pattern, falling wedge pattern, rising wedge pattern, channel pattern and so on. Gold instrument scanner uses highly sophisticated pattern detection algorithm. However, we have designed it in the easy to use and intuitive manner. Advanced Price Pattern Scanner will show all the patterns in your chart in the most efficient format for your trading. You do not have to do tedious manual pattern detection any more. Plus you
Gold Wire Trader MT5 trades using the RSI Indicator. It offers many customizable RSI trading scenarios and flexible position management settings, plus many useful features like customizable trading sessions, a martingale and inverse martingale mode. The EA implements the following entry strategies, that can be enabled or disabled at will: Trade when the RSI Indicator is oversold or overbought Trade when the RSI comes back from an oversold or overbought condition Four different trading behav
Gold trend indicator MT5 This is a multi-timeframe indicator that detects and plots supports and resistance lines in the chart with the same precision as a human eye would. As price levels are tested over time and its importance increases, the lines become thicker and darker, making price leves easy to glance and evaluate. Boost your technical analysis Customizable timeframe selection Read price levels from the timeframe of your choosing Detect important price levels without browsing through
Gold trend scanner MT5 a multi symbol multi timeframe dashboard that monitors and analyzes Average True Range indicator value in up to 28 symbols and 9 timeframes  in 3 modes :  It shows the ATR indicator value in all pairs and timeframes and signals when the ATR value reaches a maximum or minimum in a given duration. Short term ATR/Long term ATR ratio: It shows ratio of 2 ATRs with different periods. It's useful in detecting short term volatility and explosive moves. ATR Value/Spread ratio:
A triangular arbitrage strategy exploits inefficiencies between three related currency pairs, placing offsetting transactions which cancel each other for a net profit when the inefficiency is resolved. A deal involves three trades, exchanging the initial currency for a second, the second currency for a third, and the third currency for the initial. With the third trade, the arbitrageur locks in a zero-risk profit from the discrepancy that exists when the market cross exchange rate is not aligned
Gold index expert MT5 Wizard uses Multi-timeframe analysis. In simpler terms, the indicator monitors 2 timeframes. A higher timeframe and a lower timeframe. The indicator determines the trend by analyzing order flow and structure on the higher timeframe(4 hour for instance). Once the trend and order flow have been determined the indicator then uses previous market structure and price action to accurately determine high probability reversal zones. Once the high probability reversal zone has be
Golden Route home MT5 calculates the average prices of BUY (LONG) and SELL (SHORT) open positions, taking into account the size of open positions, commissions and swaps. The indicator builds the average line of LONG open positions, after crossing which, from the bottom up, the total profit for all LONG positions for the current instrument becomes greater than 0. The indicator builds the average line of SHORT open positions, after crossing which, from top to bottom, the total profit for all
Do you want an EA with small stoploss? Do you want an EA that is just in and out of market? Gold looks at several MT5 It is ONLY buying when the market opens and with a window of 10 minutes or less. It uses pre-market price so be sure your broker has that.   This strategies (yes, it is 2 different strategies that can be used with 3 different charts) have tight stoplosses and a takeprofit that often will be reached within seconds! The strategies are well proven. I have used them manually
Bekenet Signal Generator
Joseph Adgekawe Bekedemor
Gerador de sinal Bekenet.. este software é um consultor especialista, mas não faz comércio, apenas envia sinal lucrativo para o aplicativo móvel mt5 do usuário uma vez que o metaqote Id é ativado..este software fornece um sinal de compra e venda com um stop loss dado. O software funciona com MT5 e período de tempo de 15 minutos. O gerador de sinal Bekenet é projetado usando apenas a ação do preço. Ele calcula o nível chave no período diário, semanal e de quatro horas e usa 15 minutos para obter
一款实时显示点差的工具.非常好用. 是日常看价格的好帮手. 一款实时显示点差的工具.非常好用. 是日常看价格的好帮手. 一款实时显示点差的工具.非常好用. 是日常看价格的好帮手.   一款实时显示点差的工具.非常好用. 是日常看价格的好帮手. 一款实时显示点差的工具.非常好用. 是日常看价格的好帮手. 一款实时显示点差的工具.非常好用. 是日常看价格的好帮手. 一款实时显示点差的工具.非常好用. 是日常看价格的好帮手. 一款实时显示点差的工具.非常好用. 是日常看价格的好帮手. 一款实时显示点差的工具.非常好用. 是日常看价格的好帮手. 一款实时显示点差的工具.非常好用. 是日常看价格的好帮手. 一款实时显示点差的工具.非常好用. 是日常看价格的好帮手.
Key levels are psychological price levels on the forex chart where many traders base their technical analyses on. These traders are likely to place their bullish or bearish entries, and exit points around these levels. And as a result, key levels tend to be crowded with a high trading volume. Key levels also attract so much trading volume because that is where institutional traders make their trades as well. And thanks to their big-money moves, key levels are often resilient and lasting. How
# If you have any other requirements or are interested in collaboration, please contact  dev.quantech.london@gmail.com . Flash Trade (FT) Most friendly manual trading tool. Easy operation to secure your funds. Features of FT Click the chart to trade fast FT supports market orders and pending orders Click twice to complete the order and set SL and TP Click trice to complete the pending order and set SL and TP Automatically set the stop-loss amount of each order to a fixed percentage of the bal
Отличный помощник для тех кто грамотно распоряжается своими рисками. Данный помощник просто не заменим если у вас всегда должен быть фиксированный риск на сделку. Помогает автоматически высчитывать лот в зависимости от вашего риска. Теперь можно не беспокоиться о том каким будет ваш Stoploss, риск всегда будет одинаковый. Считает объем сделок как для рыночных ордеров так и для отложенных. Удобный и интуитивно понятный интерфейс, так же есть некоторые дополнительные функции для упрощения вашей то
FTMO Sniper 7
Vyacheslav Izvarin
Dedicated for FTMO and other Prop Firms Challenges 2020-2024 Trade only GOOD and checked PROP FIRMS  Default parameters for Challenge $100,000 Best results on GOLD and US100  Use any Time Frame Close all deals and Auto-trading  before  US HIGH NEWS, reopen 2 minutes after Close all deals and Auto-trading  before Weekend at 12:00 GMT+3  Friday Recommended time to trade 09:00-21:00 GMT+3 For Prop Firms MUST use special  Protector  https://www.mql5.com/en/market/product/94362 ------------------
Introducing TEAB Builder - The Ultimate MT5 Expert Advisor for Profoundly Profitable and Customizable Trading!     Are you ready to take your trading to the next level? Meet TEAB Builder, an advanced MT5 Expert Advisor designed to provide unparalleled flexibility, high-profit potential, and an array of powerful features to enhance your trading experience. With TEAB Builder, you can effortlessly trade with any indicator signal, allowing you to capitalize on a wide range of trading strategies.  
The Wall Street Player (Master version). This EA tailored as a Discipline, Money and Risk Management tool is a powerful Trade Station utility designed for Forex, Cryptos, Commodities, Shares, Deriv synthetic pairs and any CFDs Market. It is designed to fit your strategy as a winner, and take your Edge of the market to the NEXT-LEVEL. The only thing to do is to get It on your chart and appreciate the possibilities and chart management abilities it has to offer for realizing that discipline and a
Cheers, traders! In today's video, dive into the world of advanced trading with our exclusive Trade Panel. This Cyber Monday, we're offering a special deal – get access for only $27 instead of the usual $60! In this tutorial, we explore a semi-automated trading system that empowers manual traders to seize opportunities effectively. Watch as we demonstrate using real market scenarios, showing you how to set up trades, manage risk, and maximize profits. Key Features of the Trade P
The Wall Street Player (Ultimatum version). This EA tailored as a Discipline, Money and Risk Management tool is a powerful Trade Station utility designed for Forex, Cryptos, Commodities, Shares, Deriv synthetic pairs and any CFDs Market. It is designed to fit your strategy as a winner, and take your Edge of the market to the NEXT-LEVEL. The only thing to do is to get It on your chart and appreciate the possibilities and chart management abilities it has to offer for realizing that discipline and
Discover a New Wave Trading Strategy - Suitable for Currency Pairs like AUDUSD.s Strategy Highlights : Specially Designed Trend Indicator Graphics : Our strategy offers a unique graphical interface to help traders identify and capitalize on market fluctuations. Backtesting Validation : Traders are encouraged to backtest currency pairs like AUDUSD.s to validate the effectiveness of our strategy. Flexible Time Frames : Default recommendation is to trade in the 15-minute (M15) time frame,
Sabira Reactive
Gounteni Dambe Tchimbiandja
IMPORTANT NOTE THIS EA IS NOT FULLY AUTOMATED, IT ONLY TAKES POSITIONS IN ZONES YOU DEFINE IT ASSISTS YOU. SO YOU NEED TO WATCH THE CHART CLOSELY THE MAIN POINT OF THIS EA IS TO FORCE THE TRADER TO RESPECT ENTRY RULES <<CONFIRMATION IS THE KEY>>. SO THE TRADER WILL ONLY LOOK FOR ZONES THE EA WILL LOOK FOR CONFIRMATION CANDLES AND ENTER IF A CONFIRMATION IS FOUND FOR EXAMPLE: If price is in a Bullish zone. Rule, look for buys. If Bullish Candlestick Pattern  or any other bullish candle pattern s
Mais do autor
Export Intraday Data
Diego Andres Unigarro Andrade
S ystem that allows traders to bulk download closing prices for many listed instruments. Generally, access to this type of information is only possible through financial APIs, which are often very expensive to license. The trader can download his own databases directly from his MT5 terminal, which can then be used as input for quantitative trading models. Input parameters 1. Comma-separated symbols:   the trader must enter the ticker symbol of the instruments, each of them separated by a comm
FREE
Filtro:
Sem comentários
Responder ao comentário