• Información general
  • Comentarios
  • Discusión

Bayes Quantum Signals

Este es un sistema que permite calcular  de forma instantánea probabilidades futuras sobre el movimiento de un activo cotizado, para fundamentar mejor sus decisiones de compra o venta y reducir el riesgo de su operativa. Bayes Quantum Signal puede utilizarse en el modo de Trading algorítmico como Expert Advisor, o también de forma complementaria para apoyar su propia estrategia de trading. En este último caso, el sistema mostrará las probabilidades alcistas o bajistas en su pantalla de Metatrader 5.

¿Cómo funciona Bayes Quantum Signal?

Este algoritmo se basa principalmente en una aplicación dinámica del teorema de Bayes, conceptos de cálculo diferencial y econometría financiera.

Los pasos del sistema son los siguientes:

1. Se toma una base de datos histórica, cuya extensión y temporalidad, son definidas por el mismo usuario.

2. A partir de dicha base, el sistema calcula las probabilidades previas alcistas y bajistas, y las pondera con base en su desviación estándar medida de forma dinámica a través de un modelo eGARCH. La idea básica es que los retornos más grandes y con mayor desviación tendrán un impacto mayor en el cálculo de las probabilidades posteriores.  

3. En todo momento el sistema calcula el retorno en tiempo real de la vela que se está formando y lo pondera con la desviación estándar previamente calculada. Aquí es donde el sistema aplica el Teorema de Bayes para actualizar constantemente el cálculo de la probabilidad condicional. En lenguaje natural, esto se puede expresar como "dado que se está presentando el retorno x ahora mismo, ¿cuál es la probabilidad de que el precio suba o baje?".

Es importante resaltar que tanto las probabilidades previas como las posteriores se van actualizando en tiempo real, es decir,  Bayes Quantum Signal siempre toma las últimas n velas para sus cálculos. Este es el punto clave del sistema, y permite ofrecer un valor agregado a nuestros clientes. Por supuesto, un ser humano no puede hacer este cálculo en tiempo real, o al menos su margen de error será mucho más alto.

4. Si las probabilidades posteriores igualan o superan las entradas dadas por el usuario, entonces se activará una orden de compra o de venta según corresponda. El sistema permite modificar el lotaje tanto de compras como de ventas antes de su ejecución, así como el take profit y el stop loss de dichas órdenes (medidas en puntos). Por otra parte, estas probabilidades se pueden ver en la pantalla del operador, cuyo color y fuente se pueden personalizar.

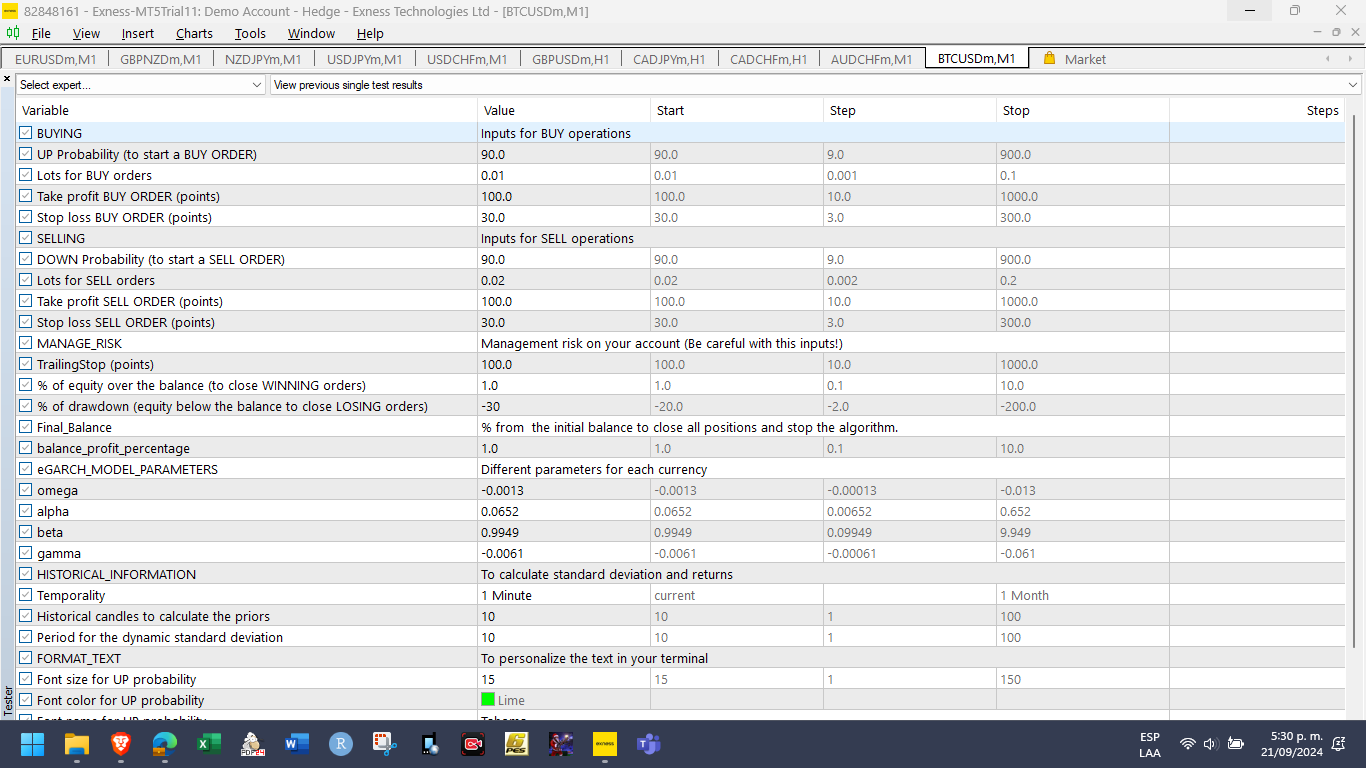
Parámetros de entrada: 

Para una mejor visualización el EA desplegará un cuadro de diálogo separado por las siguientes secciones, en las cuales el usuario debe definir los siguientes inputs para cada tipo de orden: 

Operaciones de compra

  • UP Probability (to start a BUY ORDER): Valor mínimo de probabilidad para el cual el usuario quiere iniciar una compra. Se define como un número de 0 a 100. Por ejemplo, para entrar cuando el algoritmo calcule un 80% de probabilidad alcista, usted ingresa como input el número 80 (sin notación de porcentaje).
  • Lots for BUY orders: Cantidad de lotes por cada compra. Es una cantidad fija.
  • Take profit BUY ORDER (points): Nivel fijo de take profit por cada compra. Se define en puntos.  
  • Stop loss BUY ORDER (points):  Nivel fijo de stop loss por cada compra. Se define en puntos.  

Operaciones de venta

  • DOWN Probability (to start a SELL ORDER):  Valor mínimo de probabilidad para el cual el usuario quiere iniciar una venta.  Se define como un número de 0 a 100. Por ejemplo, para entrar cuando el algoritmo calcule un 80% de probabilidad bajista, usted ingresa como input el número 80 (sin notación de porcentaje).
  • Lots for SELL orders:  Cantidad de lotes por cada venta. Es una cantidad fija.
  • Take profit SELL ORDER (points): Nivel fijo de take profit por cada venta. Se define en puntos.  
  • Stop loss SELL ORDER (points): Nivel fijo de stop loss por cada venta. Se define en puntos.  
Gestión de riesgo en su cuenta:

Nota importante:  Bayes Quantum Signal aplica take profit y stop loss en algunas órdenes, las cuales pueden vincularse al input TrailingStop (points), donde el usuario puede definir los puntos para aplicar trailing stop a los niveles previamente definidos. 

En aquellas órdenes que se crean sin take profit ni stop loss, el algoritmo gestiona sus ganancias y pérdidas con los 3 puntos definidos a continuación: 

  • % of equity over the balance (to close WINNING orders):  Defina el porcentaje de equity por encima del balance en el cual se cerrarán todas las órdenes GANADORAS.
  • % of drawdown (equity below the balance to close LOSING orders):  Defina el porcentaje de equity por debajo del balance en el cual se cerrarán todas las órdenes PERDEDORAS.
  • Balance_profit_percentage: Defina el porcentaje final que espera obtener en su balance y en el cual se cerrarán todas las órdenes tanto GANADORAS como PERDEDORAS.
Especificación del modelo eGARCH:

En este punto es importante resaltar que cada activo financiero tendrá sus propios parámetros. Se recomienda estudiar los fundamentos del modelo eGARCH o acceder a fuentes confiables para obtener estos parámetros. Usted también puede ejecutar sus propias regresiones en algún software estadístico para tal fin.

  • omega:Volatilidad de largo plazo
  • alpha: Impacto de la volatilidad rezagada sobre la volatilidad actual
  • beta: Persistencia de la volatilidad en  el tiempo
  • gamma: Asimetría o apalancamiento sobre la volatilidad
Parámetros para la información histórica
  • Temporality: Lista desplegable en la cual el usuario puede escoger una temporalidad desde un minuto hasta un mes.
  • Historical candles to calculate the priors: Número de velas que el usuario considera para que el modelo calcule las probabilidades previas. Éstas se relacionan con la temporalidad escogida previamente. Por ejemplo, si el usuario escoge temporalidad de 1 minuto, y en este input define 10, el modelo tomará información previa de los 10 minutos anteriores. 
  • Period for the dynamic standard deviation:  Número de velas que el usuario considera para que el modelo calcule la desviación estándar a través del modelo eGARCH.

Inputs para dar formato al texto

El usuario puede darle el formato deseado al texto que se muestra en la pantalla, así: 
  • Font size for UP probability:  Tamaño de fuente para el texto de probabilidad alcista.
  • Font color for UP probability:  Color de fuente para el texto de probabilidad alcista.
  • Font name for UP probability:  Tipo de fuente para el texto de probabilidad alcista.
  • Font size for DOWN probability:  Tamaño de fuente para el texto de probabilidad alcista.
  • Font color for DOWN probability: Color de fuente para el texto de probabilidad alcista
  • Font name for DOWN probability:  Tipo de fuente para el texto de probabilidad alcista.

Recomendaciones finales:

1. De acuerdo con las pruebas realizadas, este sistema está diseñado para abrir posiciones de 1 minuto en adelante. Es importante que usted ponga a prueba el sistema para ajustarlo según sus propias necesidades y objetivos de inversión.

2. Por favor mire el video completo en el cual explico el funcionamiento del sistema.

Gracias por su atención.

Productos recomendados
Market Profile 3 ForexArby com
Hussien Abdeltwab Hussien Ryad
3.83 (12)
Market Profile 3 MetaTrader 5 indicator  version 4.70— is a classic Market Profile implementation that can show the price density over time, outlining the most important price levels, value area, and control value of a given trading session. This indicator can be attached to timeframes between M1 and D1 and will show the Market Profile for daily, weekly, monthly, or even intraday sessions. Lower timeframes offer higher precision. Higher timeframes are recommended for better visibility. It is als
FREE
Renko Plus
Eadvisors Software Inc.
With Renko Plus you can use the features in the Indicator functionality, just add it to the Metatrader5 chart.             The Renko chart is a type of chart, developed by the Japanese, that is constructed using price movement rather than standardized prices and time intervals like most charts. It is believed to be named after the Japanese word for bricks, "renga", as the graphic looks like a series of bricks.             A new brick is created when the price moves a specified p
Renko Chart
Marcin Konieczny
3.63 (8)
This indicator allows to display Renko charts in the indicator window. Renko charts show only price movements that are bigger than the specified box size. It helps to eliminate noise and allows to focus on main trends. Time is not a factor here. Only price movements are taken into account. That's why Renko chart is not synchronized with the main chart it is attached to. Indicator works in two modes: CLOSE - only close prices are taken into account while building the chart HIGH_LOW - only high/
FREE
El Capturador de Tendencias: La Estrategia del Capturador de Tendencias con Indicador de Alerta es una herramienta versátil de análisis técnico que ayuda a los traders a identificar las tendencias del mercado y los posibles puntos de entrada y salida. Presenta una Estrategia dinámica del Capturador de Tendencias, adaptándose a las condiciones del mercado para una clara representación visual de la dirección de la tendencia. Los traders pueden personalizar los parámetros para que se ajusten a s
FREE
El indicador construye cotizaciones actuales, que se pueden comparar con las históricas y, sobre esta base, hacer un pronóstico de movimiento de precios. El indicador tiene un campo de texto para una navegación rápida a la fecha deseada. Opciones: Símbolo - selección del símbolo que mostrará el indicador; SymbolPeriod - selección del período del cual el indicador tomará datos; IndicatorColor - color del indicador; HorisontalShift: cambio de cotizaciones dibujadas por el indicador
This indicator uses a mathematical calculation algorithm . This algorithm calculates the remainder between the updated model and the actual values and produces the possible progress of the graph on the graph. It is not a super prophet in trading, but it is very good for the trader when entering the market and to analyze it before entering. Applicable for all currencies. Данный индикатор использует алгоритм математических вычислений . Данный алгоритм вычисляет остаток между обновленной моделью и
Introduction This indicator detects volume spread patterns for buy and sell opportunity. The patterns include demand and supply patterns. You might use each pattern for trading. However, these patterns are best used to detect the demand zone (=accumulation area) and supply zone (=distribution area). Demand pattern indicates generally potential buying opportunity. Supply pattern indicates generally potential selling opportunity. These are the underlying patterns rather than direct price action. T
FREE
Lorentzian AI
Michael Prescott Burney
Lorentzian A.I Indicator System Revolutionize your trading strategy with the Lorentzian A.I Indicator System, an advanced tool designed for traders who demand precision and adaptability. Whether you're trading Crypto, Indices, Forex, or Stocks, this state-of-the-art indicator uses cutting-edge technology to keep you ahead of the market. Key Features: Advanced Lorentzian Classification (LC): Utilize sophisticated LC algorithms to generate precise buy and sell signals, ensuring you make informed
FREE
The indicator detects and displays М. Gartley's Butterfly pattern. The pattern is plotted by the extreme values of the ZigZag indicator (included in the resources, no need to install). After detecting the pattern, the indicator notifies of that by the pop-up window, a mobile notification and an email. The pattern and wave parameters are displayed on the screenshots. The default parameters are used for demonstration purposes only in order to increase the amount of detected patterns. Parameters
Auto Fibonacci
Ali Gokay Duman
5 (2)
This indicator calculates fibonacci levels via moving averages trend and draw these lines. You can change fast and slow Moving Averages settings for customization. Inputs: Fast MA Time Period :  64 Fast MA Shift: 0 Fast MA Method: Smoothed Fast MA Apply To: Median Price Slow MA Time Period: 32 Slow MA Shift: 0 Slow MA Method: Smoothed Slow MA Apply To: Median Price ZigZag: False ZigZag Color: Red ZigZag Type: DashDot ZigZag Width: VeryThin Fibo Settings TrendFibonacci: True FiboTrendColor: Blac
FREE
Please backtest with the exact balance of your live account before applying to real money. ==> If account balance is too low it may not trade at all! For MT4 version please contact via private message. martingale version is available here . Strategy description - Detect trend based on EMA18-EMA50-SMA200 alignment in three time frames: M15, H1, H4 - Trade in trend direction and exit when above alignment is broken. - The bot is tuned to trade XAUUSD(Gold). - The bot output is break even in rangi
FREE
What is this indicator? This indicator is the MACD (Moving Average Convergence/Divergence) supporting Virtual Trading mode of  Knots Compositor . When the mode is turned on, the indicator will be recalculated based on the displayed candlesticks. When the mode is turned off, the indicator will be recalculated based on the original chart candlesticks. Types of the applied price - Close - Open - High - Low - Median Price (HL/2) - Typical Price (HLC/3) - Weighted Price (HLCC/4) KC-Indicators
FREE
Order Book, known also as Market Book, market depth, Level 2, - is a dynamically updated table with current volumes of orders to buy and to sell specific financial instument at price levels near Bid and Ask. MetaTrader 5 provides the means for receiving market book from your broker, but in real time only, without access to its history. The indicator OrderBook Cumulative Indicator accumulates market book data online and visualizes them on the chart. In addition, the indicator can show the market
Advanced 4xZeovo MT5 Indicator (MetaTrader 5)   Product Description  4xZeovo is a powerful trading indicator system monitoring 24/7 financial markets. Metatrader5 tool designed to find the best buying/selling opportunities and notifies the user.    Making life easy for traders in helping with the two most difficult decisions with the use of advanced innovate trading indicators aiming to encourage users to hold the winning positions and take profit at the best times.    Equipped with a unique tra
This is a multi-symbol and multi-timeframe table-based indicator designed for a candlestick patterns detection with 46 patterns for META TRADER 5. Each formation has own image for easier recognition. Here you find most popular formations such as "Engulfing", "Hammer", "Three Line Strike", "Piercing" or Doji - like candles. Check my full list of patterns on my screenshots below. Also you can not only switch all bearish or bullish patterns from input, but also select formation for a specified symb
Basic Harmonic Pattern MT5
Mehran Sepah Mansoor
4.8 (54)
Este indicador identifica los   patrones armónicos   más populares que predicen los puntos de reversión del mercado. Estos patrones armónicos son formaciones de precios que se repiten constantemente en el mercado de divisas y sugieren posibles movimientos futuros de los precios /   Free MT4 Version Además, este indicador tiene incorporada una señal de entrada en el mercado, así como varios take profits y stop losses. Debe tenerse en cuenta que aunque el indicador de patrón armónico puede propor
FREE
What is this indicator? This indicator is the RSI (Relative Strength Index) supporting Virtual Trading mode of  Knots Compositor . When the mode is turned on, the indicator will be recalculated based on the displayed candlesticks. When the mode is turned off, the indicator will be recalculated based on the original chart candlesticks. Types of the applied price - Close - Open - High - Low - Median Price (HL/2) - Typical Price (HLC/3) - Weighted Price (HLCC/4) KC-Indicators -   KC-MA   (M
FREE
this little free tool allows you to set 5 vertical lines at specific time. you can use it to mark london open / asia open / comex open and so on... it draws the lines in the future space - so you wont miss an important time / candle you can select color..thickness of the lines you can select only 2 or 3 of the 5 max. lines - you dont have to use the max. 5 lines. i use it myself to never miss the best times to trade.
FREE
Gino Renko
Stephane, Andr Valette
1 (1)
Another renko-based indicator. It returns different usable values ​​for an EA, and is directly displayed on the main chart. Its setting is very simple: The size of the renko The number of bars taken into account The falling color The color on the rise Returned values: Buffer 0 : Value of the middle Buffer 1 : Value of the Top Buffer 2 : Value of the Bottom Buffer 3 : Direction of renko (0.0 for top ; 1.0 for bottom) Buffer 4 : Ratio of the renko, for example, if it is twice, 3 times, ro more of
Important Lines
Terence Gronowski
4.85 (20)
Indicador de líneas importantes (M1 - M15) Este indicador muestra Líneas pivote, Día anterior alta y baja, Cierre día anterior y el mínimo y máximo de la hora anterior. Simplemente tiene que arrastrar ese único indicador al diagrama para tener todas esas líneas importantes. Puede evitar cargar muchos indicadores individuales. ¿Por qué ciertas líneas son tan importantes cuando se comercia? El día a día, alto y bajo: estos son observados por los comerciantes que comercian en un gráfico dia
FREE
This is a buyer and seller aggression indicator that analyzes the shape of each candle and project this data in a histogram form. There are 4 histograms in one. On the front we have two: Upper - Buyer force. Lower - Seller force. At the background we also have two histogram, both with same color. They measure the combined strenght of buyers and sellers. This histograms can be turned off in Input Parameters. It is also possible to have the real or tick volume to help on this force measurement. IN
FREE
Donchian Pro
Paulo Henrique Faquineli Garcia
5 (2)
The Donchian Channel Channels are among the most popular tools of technical analysis, as they visually convey to the analyst the limits within which most price movement tends to occur. Channel users know that valuable information can be obtained at any time, whether prices are in the central region of a band or close to one of the border lines. One of the best known techniques to explore these concepts is Bollinger Bands. However, John Bollinger was not the only one to research the applicatio
FREE
High Low Open Close
Alexandre Borela
4.97 (37)
Si te gusta este proyecto, deja una revisión de 5 estrellas. Seguir en instagram: borelatech Este indicador dibuja los precios abiertos, altos, bajos y finales para los especificados período y se puede ajustar para una zona horaria específica. Estos son niveles importantes considerados por muchos institucionales y profesionales comerciantes y puede ser útil para que usted sepa los lugares donde podrían ser más activo. Los períodos disponibles son: Día previo. Semana anterior. Mes anteri
FREE
WH DrawFib Pro MT5
Wissam Hussein
5 (4)
¿Estás cansado de dibujar manualmente los niveles de Fibonacci en tus gráficos? ¿Está buscando una forma conveniente y eficiente de identificar los niveles clave de soporte y resistencia en sus operaciones? ¡No busque más!   Presentamos DrawFib Pro, el último indicador de MetaTrader 5 que realiza   niveles   automáticos de F ibonacci       basándose en sus gráficos y proporciona alertas oportunas cuando se superan estos niveles. Con DrawFib Pro, puede mejorar sus estrategias comerciales, ahorrar
FREE
Bienvenido a HiperCube Renko Candles Este indicador le proporciona información real del mercado y lo transforma al estilo de vela Renko. Definición Los gráficos Renko son un tipo de gráfico financiero que mide y traza los cambios de precios, utilizando ladrillos (o barras) para representar los movimientos de precios. A diferencia de los gráficos de velas tradicionales, los gráficos Renko no muestran información basada en el tiempo, centrándose únicamente en las fluctuaciones de precios. Caracte
FREE
Owl Smart Levels MT5
Sergey Ermolov
4.07 (28)
Versión MT4  |  FAQ El Indicador Owl Smart Levels es un sistema comercial completo dentro de un indicador que incluye herramientas de análisis de mercado tan populares como los fractales avanzados de Bill Williams , Valable ZigZag que construye la estructura de onda correcta del mercado y los niveles de Fibonacci que marcan los niveles exactos de entrada. en el mercado y lugares para tomar ganancias. Descripción detallada de la estrategia Instrucciones para trabajar con el indicador Asesor de c
Vela especial ¿Quieres utilizar uno de los mejores indicadores de Forex con una exitosa estrategia Ichimoku? Puedes utilizar este impresionante indicador que está basado en la estrategia Ichimoku. La versión MT4 está disponible aquí. Primera estrategia: Esta estrategia consiste en identificar cruces fuertes similares que raramente ocurren. Los mejores marcos de tiempo para esta estrategia son 30 minutos (30M) y 1 hora (H1). Los símbolos apropiados para el marco de tiempo de 30 minutos i
The Candle Countdown Timer for MetaTrader 4 (also available for MT5) is a vital indicator designed to help you manage your trading time effectively. It keeps you updated about market open and close times by displaying the remaining time before the current candle closes and a new one forms. This powerful tool enables you to make well-informed trading decisions. Key Features: Asia Range: Comes with an option to extend the range. Broker Time, New York, London Time: Displays the current broker time
FREE
DALA Forecast
Grigorii Matsnev
About the indicator: DALA Forecast is a universal tool for predicting the dynamics of time series of any nature. For prediction, modified methods of nonlinear dynamics analysis are used, on the basis of which a predictive model is built using machine learning methods.  To get the trial version of the indicator, you can contact me in private messages. How to use the indicator: Apply the indicator to your chosen financial instrument or indicator with the settings you need. The prediction will b
FREE
Follow The Line MT5
Oliver Gideon Amofa Appiah
4.5 (28)
This indicator obeys the popular maxim that: "THE TREND IS YOUR FRIEND" It paints a GREEN line for BUY and also paints a RED line for SELL. (you can change the colors). It gives alarms and alerts of all kinds. IT DOES NOT REPAINT and can be used for all currency pairs and timeframes. Yes, as easy and simple as that. Even a newbie can use it to make great and reliable trades. NB: For best results, get my other premium indicators for more powerful and reliable signals. Get them here: https://www.m
FREE
Los compradores de este producto también adquieren
Attention: this is a multicurrency EA, which trades by several pairs from one chart!  Therefore, in order to avoid duplicate trades, it is necessary to attach EA only to one chart, ---> all trading in all pairs is conducted only from one chart! we can trade simultaneously in three different pairs, as by default (EURUSD + GBPUSD + AUDUSD), which take into account the correlation when entering the market for all three; we can trade only EURUSD (or any currency pair) and at the same time take into
Adam FTMO MT5
Vyacheslav Izvarin
5 (2)
ADAM EA Special Version for FTMO Please use ShowInfo= false for backtesting ! Our 1st EA created using ChatGPT technology Trade only GOOD and checked PROP FIRMS  Default parameters for Challenge $100,000 Tested on EURUSD and GBPUSD only  Use 15MIN Time Frame Close all deals and Auto-trading  before Weekend at 12:00 GMT+3  Friday For Prop Firms MUST use special Protector  https://www.mql5.com/en/market/product/94362 -------------------------------------------------------------------------------
Hedge Ninja
Robert Mathias Bernt Larsson
5 (1)
Asegúrate de unirte a nuestra comunidad Discord en www.Robertsfx.com , también puedes comprar el EA en robertsfx.com GANE SIN IMPORTAR EN QUÉ DIRECCIÓN SE MUEVA EL PRECIO Este robot gana sin importar en qué dirección se mueva el precio al seguir la dirección cambiante dependiendo de en qué dirección se mueva el precio. Esta es la forma más libre de operar hasta la fecha. Por lo tanto, gana sin importar en qué dirección se mueva (cuando el precio se mueve a cualquiera de las líneas rojas como s
Gold Pip Sniper MT5
Muhammed Sharookh Chittethukudiyil
Oferta por tiempo limitado: ¡El precio actual de $119 está disponible solo para las primeras 5 compras! Después de eso, el precio aumentará a $999. ¡No te pierdas esta oportunidad exclusiva! ¡Actúe rápido antes de que finalice la oferta! Rich Market Minds Scalper EA: Scalping de precisión para nuevas tendencias del mercado.   Rich Market Minds Scalper EA está diseñado por expertos para aprovechar las tendencias de mercado nuevas y emergentes con velocidad y precisión. Esta herramienta de
FiboPlusWaves MT5
Sergey Malysh
5 (1)
Una línea de productos de la serie FiboPlusWave Sistema de comercio basado en ondas de Elliott y niveles de Fibonacci . Una solución simple y asequible. Visualización de marcación de ondas de Elliott (principal o alternativa) en el gráfico. Formación de niveles horizontales, líneas de soporte y resistencia, canal. Superposición de los niveles de Fibonacci en las ondas 1, 3, 5, A Sistema de alerta (en pantalla, correo electrónico, notificaciones push).    Peculiaridades : sin profundizarse en la
Mt5BridgeBinary
Leandro Sanchez Marino
Automaticé sus estrategias comerciales para uso de binarias en MT5 y con nuestro Mt5BridgeBinary envié las órdenes a su cuenta de Binary y listo, ¡comience a operar así de fácil! Los asesores expertos son fáciles de configurar, optimizar y realizar pruebas de robustez; además en el test podemos proyectar su rentabilidad a largo plazo, por eso hemos creado Mt5BridgeBinary para conectar sus mejores estrategias a Binary. Características: -Puede utilizar tantas estrategias como desee. (Expert A
Xrade EA
Yao Maxime Kayi
Xrade EA is an expert advisor as technical indicator. For short period trade it's the best for next previsions of the trend of the market. +--------------------------------------------------------------------------------------- Very Important Our robot(data anylizer) does'nt take a trade procedure. If using only our robot you must take positions by yoursels +--------------------------------------------------------------------------------------- The technical indiator provide for a give
Technical confluence zones is a very popular tool for traders. This EA detects such zones by studying chart patterns, naked price levels, fib levels, SMA/EMA over multiple timeframes and more. The source data is loaded from Mytradingpet.com. To find out what are factored in when determining such zones, visit https://mytradingpet.com - a free service for all traders. The zones are color coded. Purple indicates the highest level of confluence.
PROMOTION!! $499 until 1 Mar. After that, EA will be $1,050 Developed and tested for over 3 years, this is one of the safest EAs on the planet for trading the New York Open. Trading could never be easier.  Trade On NASDAQ US30 (Dow Jones Industrial Average) S&P 500  What Does The EA do? The EA will open a Buy Stop Order and a Sell Stop Order(With SL and TP) on either side of the market just a few seconds before the NY Open.  As soon as 1 of the 2 trades is triggered, the EA automatically delete
Market book saver
Aliaksandr Hryshyn
Saving data from the order book. Data replay utility: https://www.mql5.com/en/market/product/71640 Library for use in the strategy tester: https://www.mql5.com/en/market/product/81409 Perhaps, then a library will appear for using the saved data in the strategy tester, depending on the interest in this development. Now there are developments of this kind using shared memory, when only one copy of the data is in RAM. This not only solves the memory issue, but gives faster initialization on each
Gold instrument scanner is the chart pattern scanner to detect the triangle pattern, falling wedge pattern, rising wedge pattern, channel pattern and so on. Gold instrument scanner uses highly sophisticated pattern detection algorithm. However, we have designed it in the easy to use and intuitive manner. Advanced Price Pattern Scanner will show all the patterns in your chart in the most efficient format for your trading. You do not have to do tedious manual pattern detection any more. Plus you
Gold Wire Trader MT5 trades using the RSI Indicator. It offers many customizable RSI trading scenarios and flexible position management settings, plus many useful features like customizable trading sessions, a martingale and inverse martingale mode. The EA implements the following entry strategies, that can be enabled or disabled at will: Trade when the RSI Indicator is oversold or overbought Trade when the RSI comes back from an oversold or overbought condition Four different trading behav
Gold trend indicator MT5 This is a multi-timeframe indicator that detects and plots supports and resistance lines in the chart with the same precision as a human eye would. As price levels are tested over time and its importance increases, the lines become thicker and darker, making price leves easy to glance and evaluate. Boost your technical analysis Customizable timeframe selection Read price levels from the timeframe of your choosing Detect important price levels without browsing through
Gold trend scanner MT5 a multi symbol multi timeframe dashboard that monitors and analyzes Average True Range indicator value in up to 28 symbols and 9 timeframes  in 3 modes :  It shows the ATR indicator value in all pairs and timeframes and signals when the ATR value reaches a maximum or minimum in a given duration. Short term ATR/Long term ATR ratio: It shows ratio of 2 ATRs with different periods. It's useful in detecting short term volatility and explosive moves. ATR Value/Spread ratio:
A triangular arbitrage strategy exploits inefficiencies between three related currency pairs, placing offsetting transactions which cancel each other for a net profit when the inefficiency is resolved. A deal involves three trades, exchanging the initial currency for a second, the second currency for a third, and the third currency for the initial. With the third trade, the arbitrageur locks in a zero-risk profit from the discrepancy that exists when the market cross exchange rate is not aligned
Gold index expert MT5 Wizard uses Multi-timeframe analysis. In simpler terms, the indicator monitors 2 timeframes. A higher timeframe and a lower timeframe. The indicator determines the trend by analyzing order flow and structure on the higher timeframe(4 hour for instance). Once the trend and order flow have been determined the indicator then uses previous market structure and price action to accurately determine high probability reversal zones. Once the high probability reversal zone has be
Golden Route home MT5 calculates the average prices of BUY (LONG) and SELL (SHORT) open positions, taking into account the size of open positions, commissions and swaps. The indicator builds the average line of LONG open positions, after crossing which, from the bottom up, the total profit for all LONG positions for the current instrument becomes greater than 0. The indicator builds the average line of SHORT open positions, after crossing which, from top to bottom, the total profit for all
Do you want an EA with small stoploss? Do you want an EA that is just in and out of market? Gold looks at several MT5 It is ONLY buying when the market opens and with a window of 10 minutes or less. It uses pre-market price so be sure your broker has that.   This strategies (yes, it is 2 different strategies that can be used with 3 different charts) have tight stoplosses and a takeprofit that often will be reached within seconds! The strategies are well proven. I have used them manually
Bekenet Signal Generator
Joseph Adgekawe Bekedemor
Generador de señales Bekenet.. este software es un asesor experto, pero no coloca el comercio, solo envía una señal rentable a la aplicación mt5 móvil del usuario una vez que se activa la identificación del metaqote.. este software da una señal de compra y venta con un stop loss dado. El software funciona con MT5 y un marco de tiempo de 15 minutos. El generador de señales Bekenet está diseñado utilizando solo la acción del precio. Calcula el nivel clave en un marco de tiempo diario, semanal y de
一款实时显示点差的工具.非常好用. 是日常看价格的好帮手. 一款实时显示点差的工具.非常好用. 是日常看价格的好帮手. 一款实时显示点差的工具.非常好用. 是日常看价格的好帮手.   一款实时显示点差的工具.非常好用. 是日常看价格的好帮手. 一款实时显示点差的工具.非常好用. 是日常看价格的好帮手. 一款实时显示点差的工具.非常好用. 是日常看价格的好帮手. 一款实时显示点差的工具.非常好用. 是日常看价格的好帮手. 一款实时显示点差的工具.非常好用. 是日常看价格的好帮手. 一款实时显示点差的工具.非常好用. 是日常看价格的好帮手. 一款实时显示点差的工具.非常好用. 是日常看价格的好帮手. 一款实时显示点差的工具.非常好用. 是日常看价格的好帮手.
Key levels are psychological price levels on the forex chart where many traders base their technical analyses on. These traders are likely to place their bullish or bearish entries, and exit points around these levels. And as a result, key levels tend to be crowded with a high trading volume. Key levels also attract so much trading volume because that is where institutional traders make their trades as well. And thanks to their big-money moves, key levels are often resilient and lasting. How
# If you have any other requirements or are interested in collaboration, please contact  dev.quantech.london@gmail.com . Flash Trade (FT) Most friendly manual trading tool. Easy operation to secure your funds. Features of FT Click the chart to trade fast FT supports market orders and pending orders Click twice to complete the order and set SL and TP Click trice to complete the pending order and set SL and TP Automatically set the stop-loss amount of each order to a fixed percentage of the bal
Отличный помощник для тех кто грамотно распоряжается своими рисками. Данный помощник просто не заменим если у вас всегда должен быть фиксированный риск на сделку. Помогает автоматически высчитывать лот в зависимости от вашего риска. Теперь можно не беспокоиться о том каким будет ваш Stoploss, риск всегда будет одинаковый. Считает объем сделок как для рыночных ордеров так и для отложенных. Удобный и интуитивно понятный интерфейс, так же есть некоторые дополнительные функции для упрощения вашей то
FTMO Sniper 7
Vyacheslav Izvarin
Dedicated for FTMO and other Prop Firms Challenges 2020-2024 Trade only GOOD and checked PROP FIRMS  Default parameters for Challenge $100,000 Best results on GOLD and US100  Use any Time Frame Close all deals and Auto-trading  before  US HIGH NEWS, reopen 2 minutes after Close all deals and Auto-trading  before Weekend at 12:00 GMT+3  Friday Recommended time to trade 09:00-21:00 GMT+3 For Prop Firms MUST use special  Protector  https://www.mql5.com/en/market/product/94362 ------------------
Introducing TEAB Builder - The Ultimate MT5 Expert Advisor for Profoundly Profitable and Customizable Trading!     Are you ready to take your trading to the next level? Meet TEAB Builder, an advanced MT5 Expert Advisor designed to provide unparalleled flexibility, high-profit potential, and an array of powerful features to enhance your trading experience. With TEAB Builder, you can effortlessly trade with any indicator signal, allowing you to capitalize on a wide range of trading strategies.  
The Wall Street Player (Master version). This EA tailored as a Discipline, Money and Risk Management tool is a powerful Trade Station utility designed for Forex, Cryptos, Commodities, Shares, Deriv synthetic pairs and any CFDs Market. It is designed to fit your strategy as a winner, and take your Edge of the market to the NEXT-LEVEL. The only thing to do is to get It on your chart and appreciate the possibilities and chart management abilities it has to offer for realizing that discipline and a
Cheers, traders! In today's video, dive into the world of advanced trading with our exclusive Trade Panel. This Cyber Monday, we're offering a special deal – get access for only $27 instead of the usual $60! In this tutorial, we explore a semi-automated trading system that empowers manual traders to seize opportunities effectively. Watch as we demonstrate using real market scenarios, showing you how to set up trades, manage risk, and maximize profits. Key Features of the Trade P
The Wall Street Player (Ultimatum version). This EA tailored as a Discipline, Money and Risk Management tool is a powerful Trade Station utility designed for Forex, Cryptos, Commodities, Shares, Deriv synthetic pairs and any CFDs Market. It is designed to fit your strategy as a winner, and take your Edge of the market to the NEXT-LEVEL. The only thing to do is to get It on your chart and appreciate the possibilities and chart management abilities it has to offer for realizing that discipline and
Discover a New Wave Trading Strategy - Suitable for Currency Pairs like AUDUSD.s Strategy Highlights : Specially Designed Trend Indicator Graphics : Our strategy offers a unique graphical interface to help traders identify and capitalize on market fluctuations. Backtesting Validation : Traders are encouraged to backtest currency pairs like AUDUSD.s to validate the effectiveness of our strategy. Flexible Time Frames : Default recommendation is to trade in the 15-minute (M15) time frame,
Sabira Reactive
Gounteni Dambe Tchimbiandja
IMPORTANT NOTE THIS EA IS NOT FULLY AUTOMATED, IT ONLY TAKES POSITIONS IN ZONES YOU DEFINE IT ASSISTS YOU. SO YOU NEED TO WATCH THE CHART CLOSELY THE MAIN POINT OF THIS EA IS TO FORCE THE TRADER TO RESPECT ENTRY RULES <<CONFIRMATION IS THE KEY>>. SO THE TRADER WILL ONLY LOOK FOR ZONES THE EA WILL LOOK FOR CONFIRMATION CANDLES AND ENTER IF A CONFIRMATION IS FOUND FOR EXAMPLE: If price is in a Bullish zone. Rule, look for buys. If Bullish Candlestick Pattern  or any other bullish candle pattern s
Otros productos de este autor
Export Intraday Data
Diego Andres Unigarro Andrade
Sistema que permite a los operadores exportar de forma masiva los  precios de cierre  de los distintos instrumentos cotizados. En general, el acceso a este tipo de información solo es posible a través de APIs financieras, cuya licencia suele ser muy costosa. El operador puede descargar sus propias bases de datos directamente desde su terminal de MT5, las cuales podrán ser utilizadas posteriormente como insumo para modelos cuantitativos de negociación. Parámetros de entrada 1. Símbolos separados
FREE
Filtro:
No hay comentarios
Respuesta al comentario