• Visão global
  • Comentários (4)
  • Discussão (6)
  • O que há de novo

Smart Support and Resistance Trading System MT5

3.67
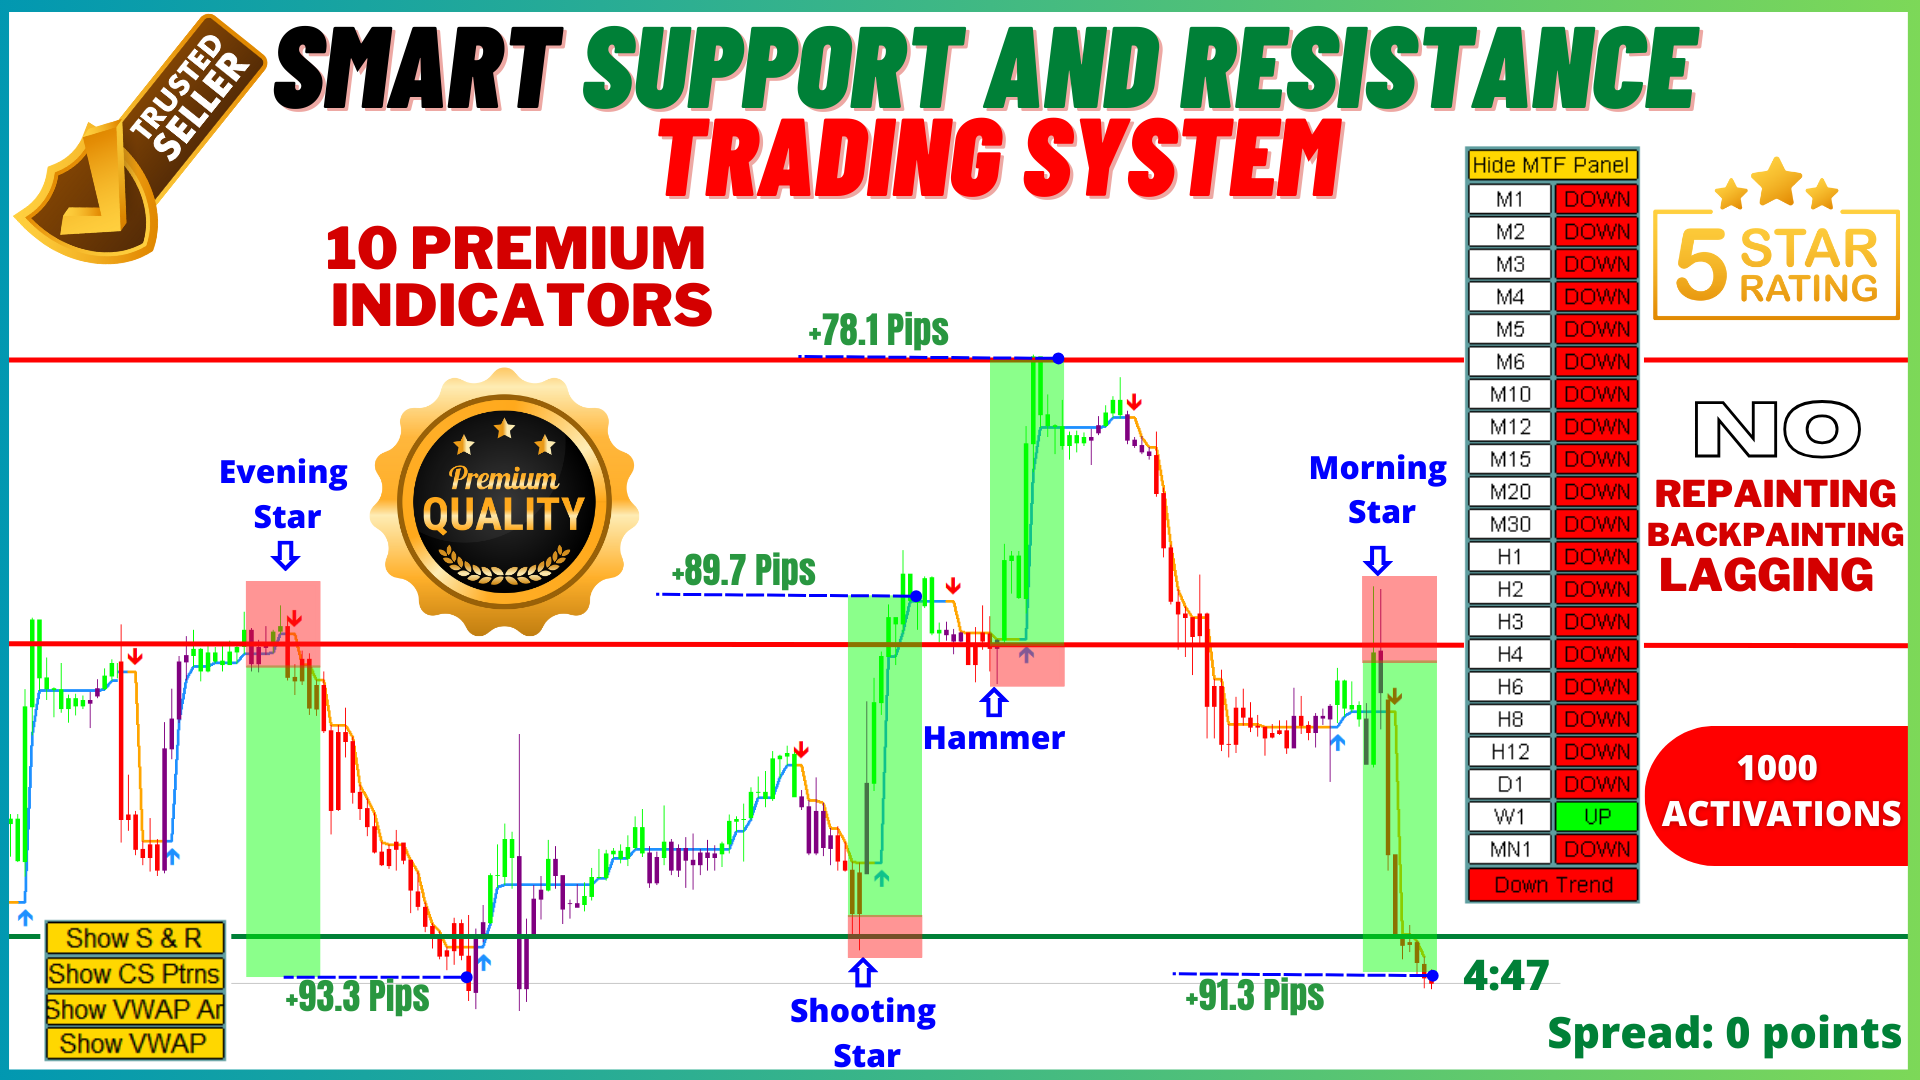
Antes de mais nada, vale ressaltar que este Sistema de Negociação é um Indicador Não Repintado, Não Redesenhado e sem Atrasos, o que o torna ideal para negociações profissionais.
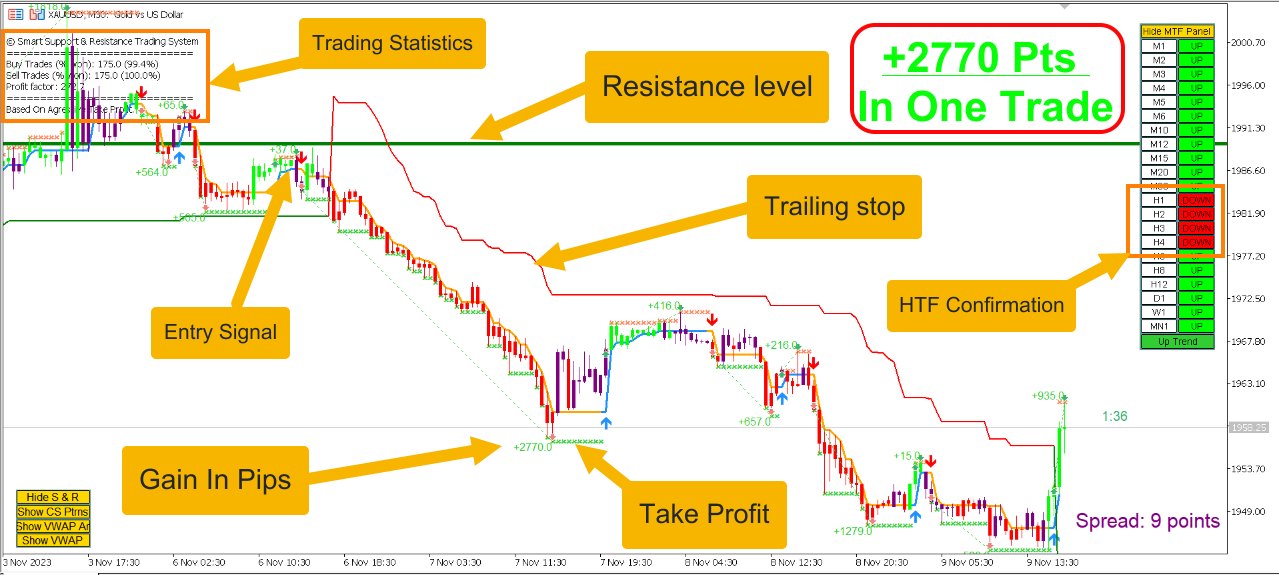
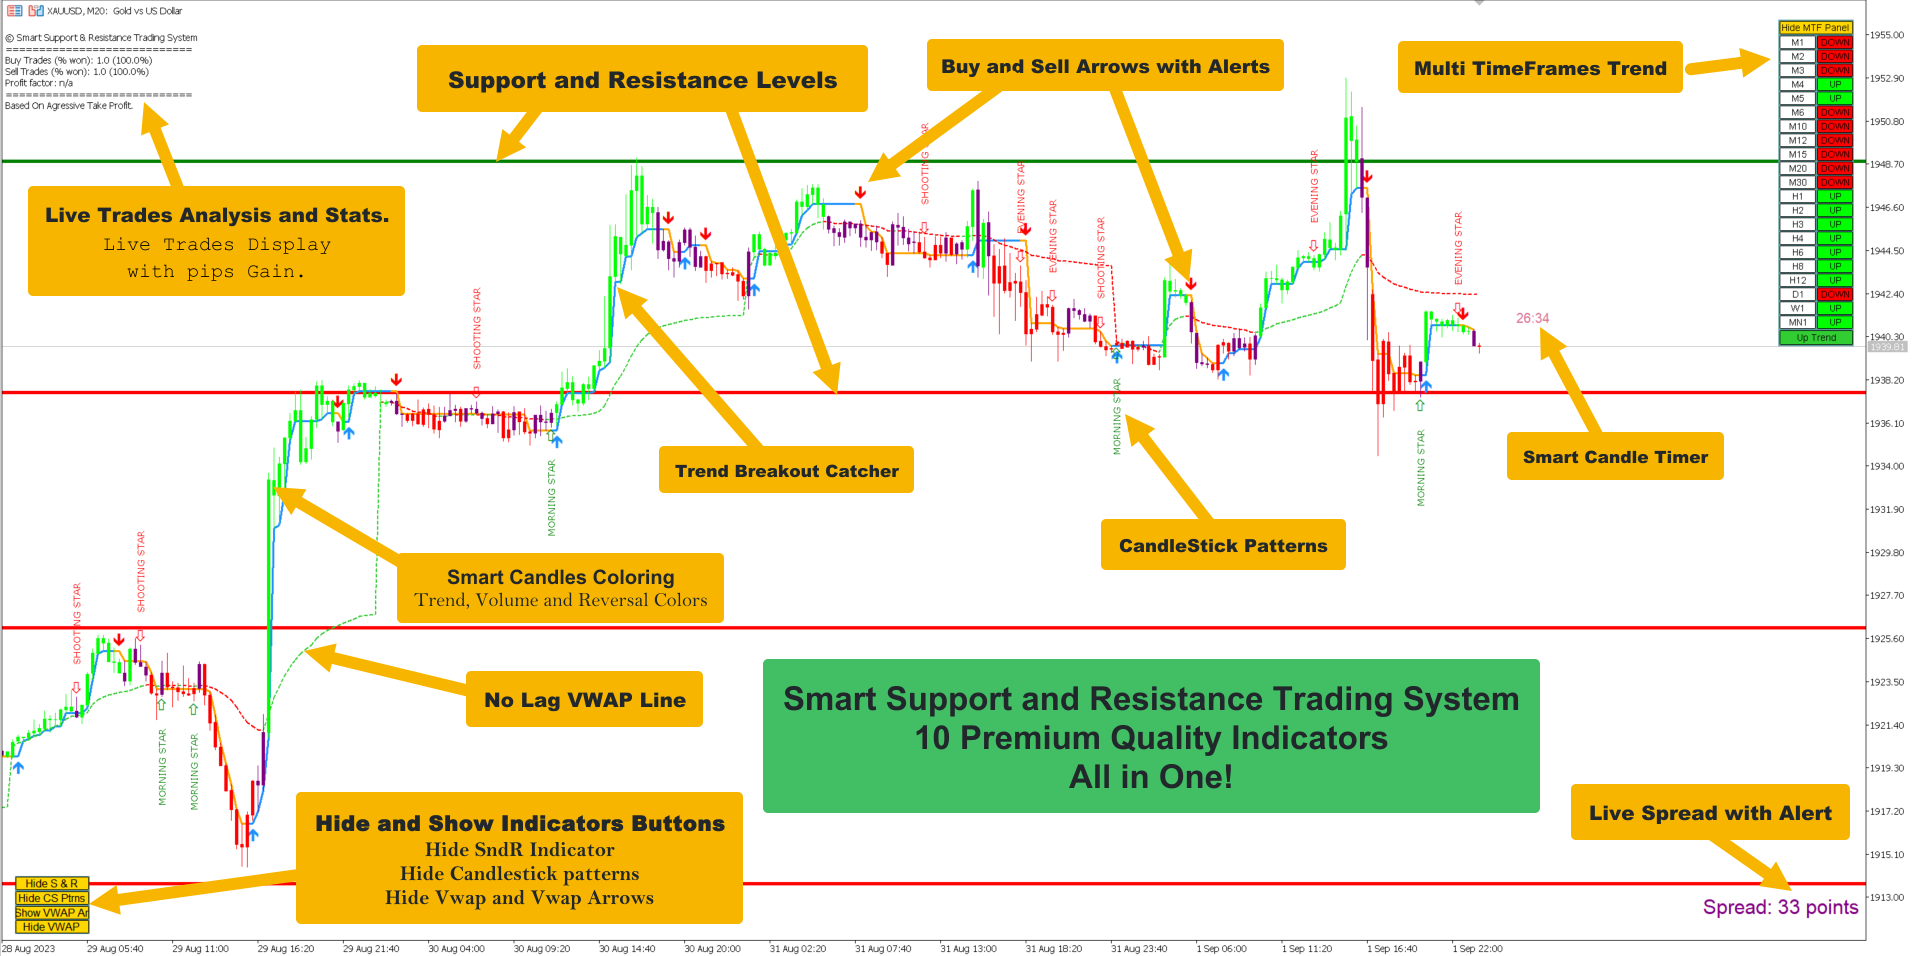
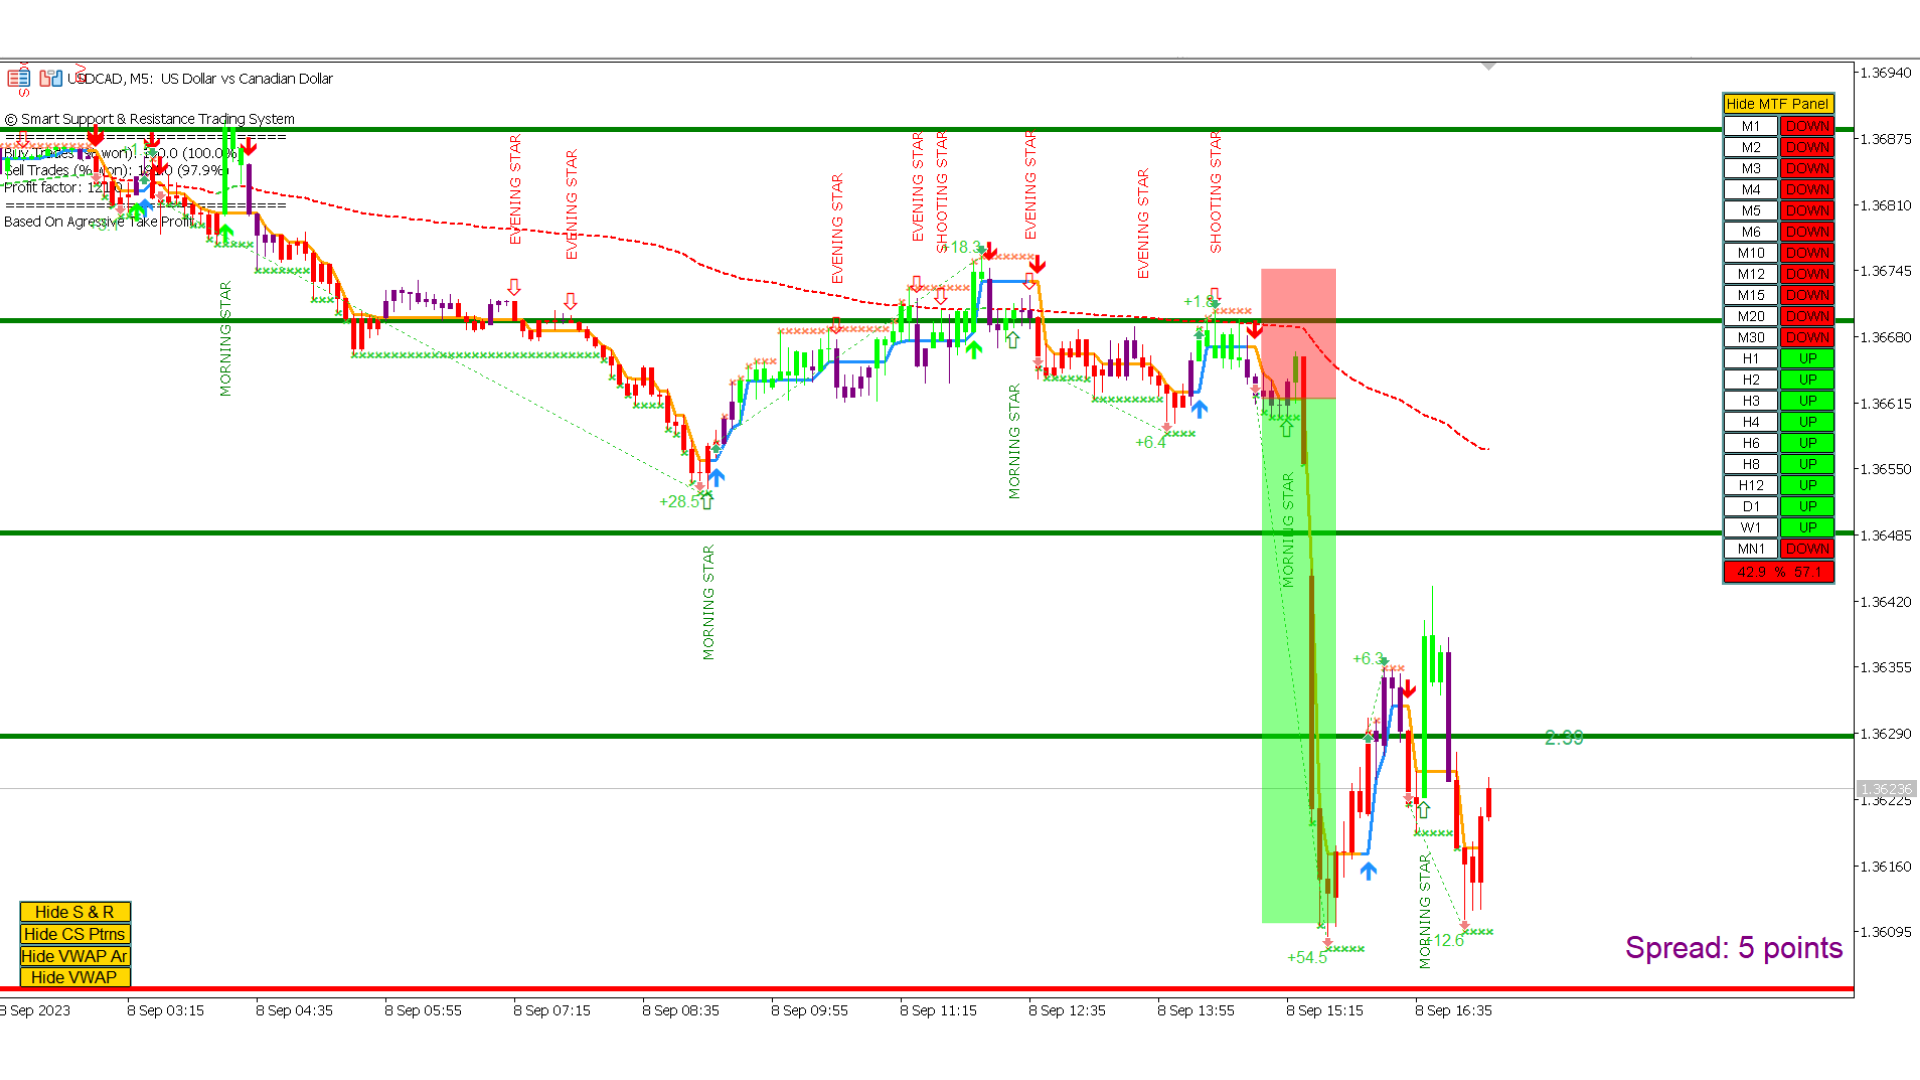
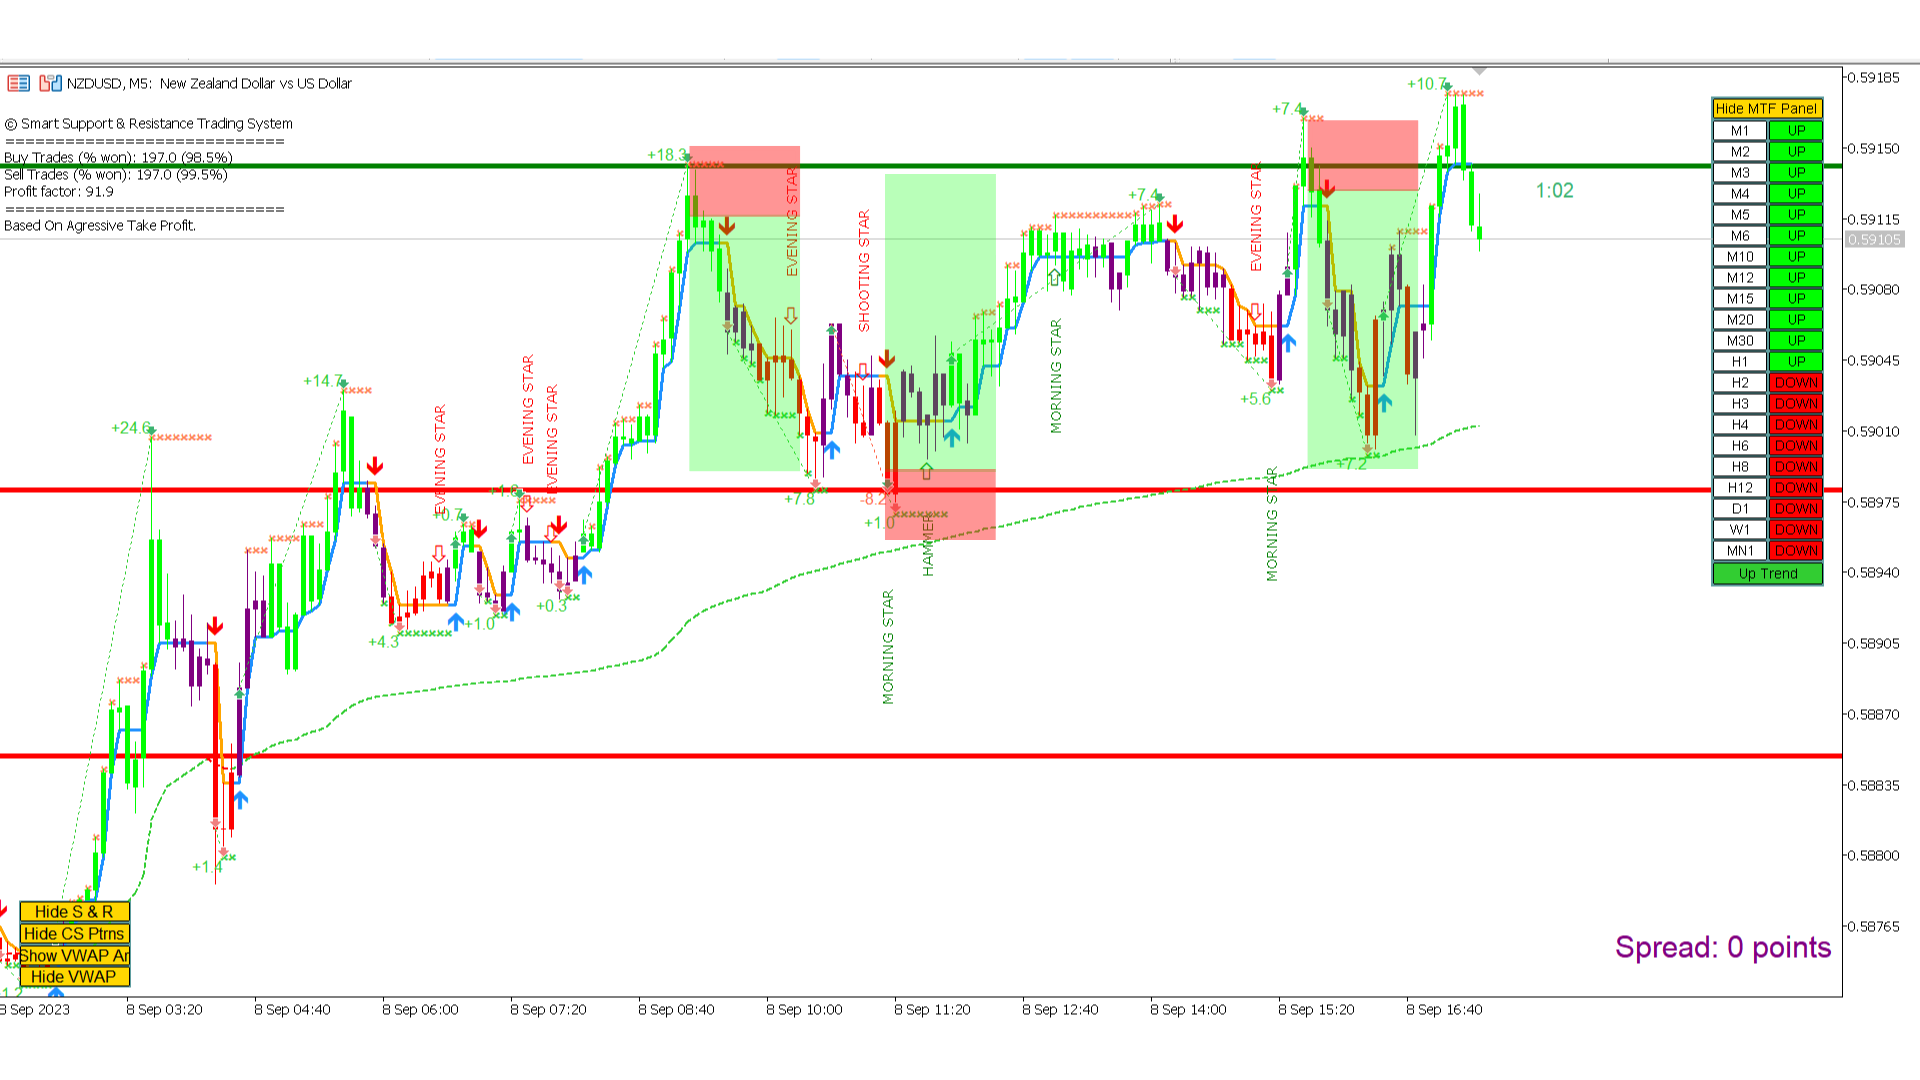
O "Sistema de Negociação de Suporte e Resistência Inteligente" é um indicador avançado projetado para traders novos e experientes. Empodera os traders com precisão e confiança no mercado forex. Este sistema abrangente combina mais de 7 estratégias, 10 indicadores e vários métodos de negociação, incluindo estratégias de negociação diária, estratégias de negociação de swing, estratégias de suporte e resistência, estratégias de padrões de candlestick, estratégias VWAP, estratégias de tendência em vários intervalos de tempo e muito mais. Ele fornece sinais de setas, pontos de entrada e saída, alertas de negociação, análise de tendência em períodos de tempo mais altos, monitoramento de negociações em tempo real e iluminação de velas de tendência e volume. Com detecção automática de suporte e resistência, é um indicador multifacetado que ajuda os traders a tomar decisões informadas em diversas condições de mercado.

O Sistema de Negociação de Suporte e Resistência Inteligente é uma abordagem robusta de análise técnica que incorpora uma série de indicadores e ferramentas premium e poderosas. Em seu núcleo, este sistema identifica níveis-chave de suporte e resistência, que servem como zonas críticas para possíveis reversões ou continuidades do mercado. O sistema integra perfeitamente um Painel de Tendências em Múltiplos Intervalos de Tempo, aprimorando a capacidade dos traders de avaliar a direção da tendência predominante em diferentes intervalos de tempo. Além disso, o Detector de Padrões de Candlestick escaneia os gráficos de preços em busca de padrões de candlestick essenciais, fornecendo insights valiosos sobre movimentos potenciais do mercado. Além disso, a inclusão do VWAP (Preço Médio Ponderado por Volume) ajuda os traders a avaliar o sentimento do mercado e as tendências intradiárias, ideal para negociações diárias.

O Sistema de Negociação de Suporte e Resistência Inteligente também oferece o Apanhador de Rompimentos de Tendência, que identifica e confirma rompimentos de tendência, ajudando os traders a realizar entradas e saídas oportunas. Este sistema também utiliza a Iluminação de Velas de Tendência e Volume, que melhora a visualização ao colorir dinamicamente as velas com base na força da tendência e nas características do volume. Para empoderar os traders com informações em tempo real, o sistema inclui um Indicador de Spread Ao Vivo com alertas, alertando os traders sobre mudanças nas condições de mercado. Um Temporizador de Velas Inteligente garante que os traders estejam cientes dos horários de fechamento das velas, auxiliando na tomada de decisões.

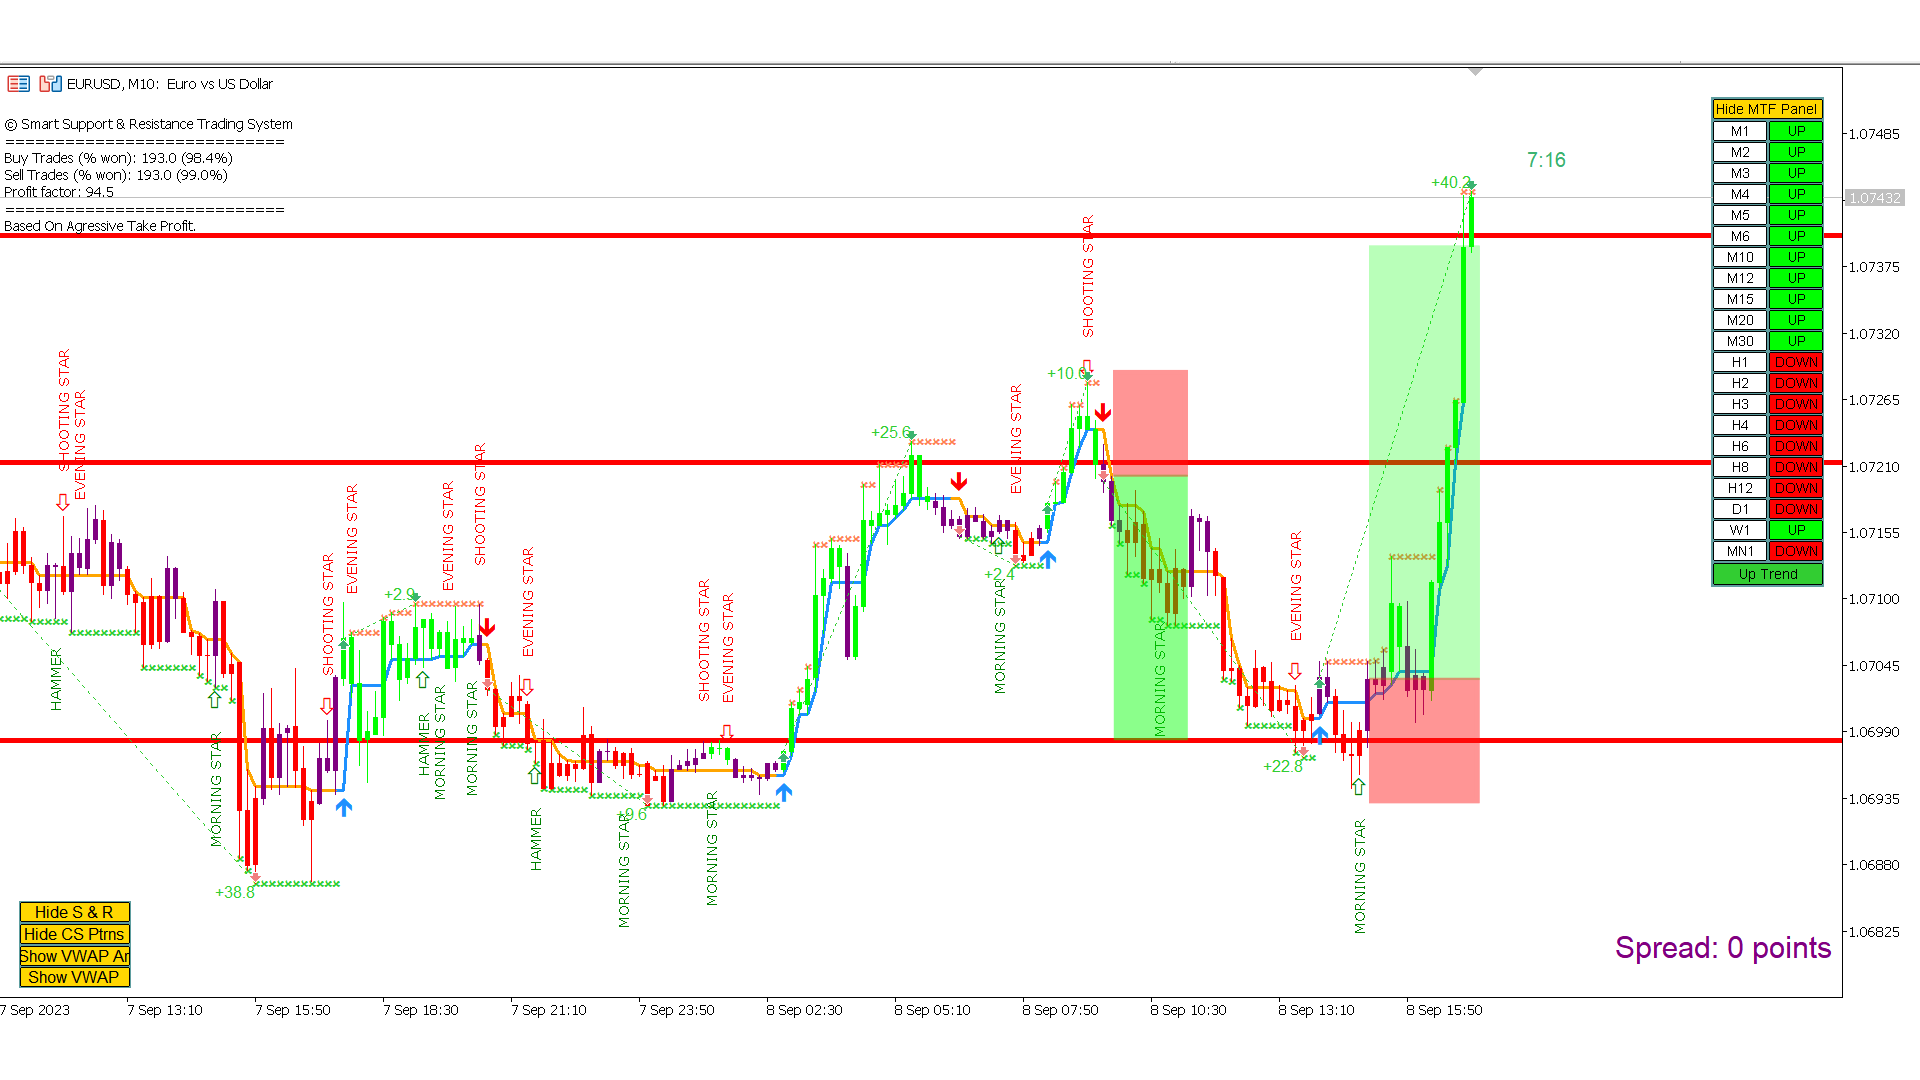
Por fim, a função de Análise de Negociações Ao Vivo imprime estatísticas comerciais essenciais diretamente no gráfico, fornecendo aos traders insights acionáveis sobre seu desempenho comercial. Ao integrar esses indicadores e ferramentas avançados, o Sistema de Negociação de Suporte e Resistência Inteligente oferece uma solução abrangente para traders que buscam navegar efetivamente e com confiança nos mercados.

Recursos:

- Indicadores não repintados, não redesenhados e sem atrasos
- Mais de 7 estratégias
- 10 indicadores em um só
- Estratégias de negociação diária e de swing
- Estratégias de acompanhamento de tendências, reversão e scalping
- Estratégias personalizadas
- Estratégias de empresas prop
- Pontos de entrada e saída e setas
- Alertas por telefone e e-mail
- Análise de múltiplos intervalos de tempo
- Detecção automática de suporte e resistência
- Todos os tipos de padrões de candlestick
- Zonas de reversão
- Trailing stop
- Iluminação de velas com base em volume, tendência e reversão
- Temporizador de velas e indicadores de limite de spread
- Análise de negociações ao vivo


Comentários 4
Suherdi St
274
Suherdi St 2025.01.24 07:19 
 

sangat membantu, untuk startegi support dan resisten

nasar78613
135
nasar78613 2024.02.13 10:37 
 

Very good indicator for support and resistance but we have some issues this indicator not work below 15m timeframe please you can fix this and second candlestick accuracy is 60% please increase

Produtos recomendados
Antes de tudo, vale ressaltar que esta Ferramenta de Negociação é um Indicador Não Repintante, Não Redesenhante e Não Atrasado, o que a torna ideal para negociação profissional. Curso online, manual do utilizador e demonstração. O Indicador de Conceitos de Ação de Preço Inteligente é uma ferramenta muito poderosa tanto para traders novos quanto experientes. Ele combina mais de 20 indicadores úteis em um único, combinando ideias avançadas de negociação como Análise do Trader do Círculo Interno
Noize Absorption Index - is the manual trading system that measures the difference of pressure between bears forces and bulls forces. Green line - is a noize free index that showing curent situation. Zero value of index shows totally choppy/flat market.Values above zero level shows how powerfull bullish wave is and values below zero measures bearish forces.Up arrow appears on bearish market when it's ready to reverse, dn arrow appears on weak bullish market, as a result of reverse expectation.
An indicator of pattern #31 ("Long Island") from Encyclopedia of Chart Patterns by Thomas N. Bulkowski. The second gap is in the opposite direction. Parameters: Alerts - show alert when an arrow appears   Push - send a push notification when an arrow appears (requires configuration in the terminal) GapSize - minimum gap size in points ArrowType - a symbol from 1 to 17 ArrowVShift - vertical shift of arrows in points   ShowLevels - show levels ColUp - color of an upward line ColDn - color of a d
The Penta-O is a 6-point retracement harmonacci pattern which usually precedes big market movements. Penta-O patterns can expand and repaint quite a bit. To make things easier this indicator implements a twist: it waits for a donchian breakout in the right direction before signaling the trade. The end result is an otherwise repainting indicator with a very reliable trading signal. The donchian breakout period is entered as an input. [ Installation Guide | Update Guide | Troubleshooting | FAQ | A
Atomic Analyst MT5
Issam Kassas
4.32 (19)
Primeiramente, vale ressaltar que este Indicador de Negociação não repinta, não redesenha e não apresenta atrasos, tornando-o ideal tanto para negociação manual quanto automatizada. Manual do utilizador: configurações, entradas e estratégia. O Analista Atômico é um Indicador de Ação de Preço PA que utiliza a força e o momentum do preço para encontrar uma vantagem melhor no mercado. Equipado com filtros avançados que ajudam a remover ruídos e sinais falsos, e aumentam o potencial de negociação.
Your Trend Friend
Luigi Nunes Labigalini
5 (1)
A tendência é sua amiga! Veja a cor do indicador e faça suas operações nessa direção. Ele não repinta. Ou seja, depois que cada candle se fecha, a cor dele é definitiva e não irá se alterar. Você pode focar em movimentos mais curtos e rápidos ou tendências mais longas, basta testar o que melhor se encaixa no seu operacional de acordo com o ativo e tempo gráfico usado. Altere o parâmetro de entrada "Length" e o indicador irá se adaptar automaticamente (quanto maior ele for, maior a tendência an
Trading Utility for Forex Currency Pairs Only not for Gold  Functions Auto Lot Calculation based on Risk Auto stoploss  Auto TakeProfit Breakeven Auto Close Half % Close in percentage with respect to the PIPs Pending Orders BuyLimit Sell Limit with distances BuyStop Sell Stop    with distances Trading Informations Risk in percentage For Multiple trades Combine Takeprofit and Combine Stoplosses
Owl Smart Levels MT5
Sergey Ermolov
4.07 (28)
Versão MT4  |  FAQ O Indicador Owl Smart Levels é um sistema de negociação completo dentro de um indicador que inclui ferramentas populares de análise de mercado, como fractais avançados de Bill Williams , Valable ZigZag que constrói a estrutura de onda correta do mercado e níveis de Fibonacci que marcam os níveis exatos de entrada no mercado e lugares para obter lucros. Descrição detalhada da estratégia Instruções para trabalhar com o indicador Consultor de negociação Owl Helper Chat privado d
Crash 1000 Scalping Indicator for the Crash 1000 Deriv Synthetic Index. Introduction The Crash 1000 Scalping Indicator is a specialized tool designed for the Crash 1000 index on the Deriv Synthetic market. This indicator is particularly useful for scalping on the M1 timeframe, helping traders to identify precise entry and exit points for buy positions. It is designed to be non-repainting, providing clear signals with audible alerts and push notifications, and is compatible with mobile devices th
O nível Premium é um indicador único com mais de 80% de precisão nas previsões corretas! Este indicador foi testado pelos melhores Especialistas em Negociação por mais de dois meses! O indicador do autor você não encontrará em nenhum outro lugar! A partir das imagens você pode ver por si mesmo a precisão desta ferramenta! 1 é ótimo para negociar opções binárias com um tempo de expiração de 1 vela. 2 funciona em todos os pares de moedas, ações, commodities, criptomoedas Instruções: Assim
Double HMA MTF for MT5
Pavel Zamoshnikov
4 (4)
This is an advanced multi-timeframe version of the popular Hull Moving Average (HMA) Features Two lines of the Hull indicator of different timeframes on the same chart. The HMA line of the higher timeframe defines the trend, and the HMA line of the current timeframe defines the short-term price movements. A graphical panel with HMA indicator data from all timeframes at the same time . If the HMA switched its direction on any timeframe, the panel displays a question or exclamation mark with a tex
Indicador financeiro SolarTrade Suite: Indicador de mercado Júpiter - o seu guia fiável no mundo dos mercados financeiros! Este é um indicador de tendência que utiliza algoritmos especiais inovadores e avançados para calcular o seu valor e tem também um design atraente. É muito fácil compreender as leituras deste indicador: azul - compra, vermelho - venda. Veja os nossos outros produtos da série SolarTrade Suite na parte inferior da descrição. Quer navegar com confiança no mundo dos investi
This indicator presents an alternative approach to identify Market Structure. The logic used is derived from learning material created by   DaveTeaches (on X) Upgrade v1.10: + add option to put protected high/low value to buffer (figure 11, 12) + add  Retracements  value to buffer when Show Retracements When quantifying Market Structure, it is common to use fractal highs and lows to identify "significant" swing pivots. When price closes through these pivots, we may identify a Market Structure S
To download MT4 version please click here . - This is the exact conversion from TradingView: "Trend Direction Force Index - TDFI [wm]" By "causecelebre". - The screenshot shows similar results from tradingview and Metatrader when tested on ICMarkets on both platforms. - This indicator uses multiple levels of averaging to detect trend strength. - You can optimize filter low and filter high levels to achieve best results. - You have access to buffers to use in EAs. - This is a light-load processin
Wave Trend MT5
Diego Arribas Lopez
MT4 Version Wave Trend MT5 Wave Trend is an oscillator, which helps identifing in a extremely accurate manner market reversals. The Oscillator being obove the overbought level and a cross down of the fast into the slow MA usually indicates a good SELL signal. If the oscillators is below the oversold level and the fast MA crosses over the slower MA usually highlights a good BUY signal. The Wave Trend indicator can be also used when divergences appear against the price, indicating the current move
To get access to MT4 version please click here . - This is the exact conversion from TradingView: "Stochastic Momentum Index" By "UCSgears". - This is a popular version of stochastic oscillator on tradingview. - This is a light-load processing and non-repaint indicator. - Buffers are available for the lines on chart. - You can message in private chat for further changes you need. Thanks for downloading
Was: $249  Now: $149   Market Profile defines a number of day types that can help the trader to determine market behaviour. A key feature is the Value Area, representing the range of price action where 70% of trading took place. Understanding the Value Area can give traders valuable insight into market direction and establish the higher odds trade. It is an excellent addition to any system you may be using. Inspired by Jim Dalton’s book “Mind Over Markets”, this indicator is designed to suit the
Laguerre SuperTrend Clouds   adds an Adaptive Laguerre averaging algorithm and alerts to the widely popular SuperTrend indicator. As the name suggests,   Laguerre SuperTrend Clouds (LSC)   is a trending indicator which works best in trendy (not choppy) markets. The SuperTrend is an extremely popular indicator for intraday and daily trading, and can be used on any timeframe. Incorporating Laguerre's equation to this can facilitate more robust trend detection and smoother filters. The LSC uses the
Magic Finger can help you identify trends and trading opportunities clearly. The finger points to the open position signal, and the discoloration line is confirmed by the trend. If you are a day trader, you can choose to trade during a period of active trading, referring to the discoloration line as the basis for the next order, finger signal as a filter. If you are a trend trader, you can choose a period above H1, wait for the appearance of the finger signal in the key price area, and enter th
Este é um indicador MTF dos níveis de suporte e resistência com base nos   extremos do indicador Advanced ZigZag Dynamic   e / ou   Extended Fractals   com etiquetas de preço (pode ser desativado). TFs mais altos podem ser selecionados para o modo MTF. Por padrão, os níveis são gerados com base nos pontos do indicador ZigZag. Os pontos indicadores fractais também podem ser usados em conjunto com o ZigZag ou em vez dele. Para simplificar o uso e economizar tempo de CPU, o cálculo é realizado uma
Este indicador encontra os padrões de retração AB = CD. O padrão AB = CD Retracement é uma estrutura de preço de 4 pontos em que o segmento de preço inicial é parcialmente retraído e seguido por um movimento equidistante da conclusão da retirada, e é a base básica para todos os padrões harmônicos. [ Guia de instalação | Guia de atualização | Solução de problemas | FAQ | Todos os produtos ] Tamanhos de padrão personalizáveis Proporções AC e BD personalizáveis Períodos de interrupção personali
Nosso indicador   Basic Support and Resistance   é a solução necessária para aumentar sua análise técnica.Este indicador permite que você forneça níveis de suporte e resistência no gráfico/   versão MT4 grátis Recursos Integração dos níveis de Fibonacci: Com a opção de exibir níveis de Fibonacci, juntamente com os níveis de suporte e resistência, nosso indicador fornece uma visão ainda mais profunda do comportamento do mercado e possíveis áreas de reversão. Otimização de desempenho: Com a opçã
Welcome to the Ultimate Harmonic Patterns recognition indicator that is focused to detect advanced patterns. The Gartley pattern, Bat pattern, and Cypher pattern  are popular technical analysis tools used by traders to identify potential reversal points in the market. Our Ultimate Harmonic Patterns recognition Indicator is a powerful tool that uses advanced algorithms to scan the markets and identify these patterns in real-time. With our Ultimate Harmonic Patterns recognition Indicator, you ca
STRICTLY FOR BOOM INDEX ONLY!!!!! Here I bring the Maximum Trend Arrows OT1.0 MT5 indicator. This indicator is made up of a combination of different trend indicators for entries and exits, for entries an orange arrow will paint on the chart below the current market and a red flag for closing of trades and it produces buy arrows only. When the orange arrow appears, it will appear along with it's sound to notify you. The 1H timeframe is recommended, don't use it anywhere else than on the 1H timefr
Flow Bookmap
Thalles Nascimento De Carvalho
Flow Bookmap: Visualize o Fluxo de Mercado e Proteja Seu Operacional ️ QUER DOMINAR O MERCADO COM INFORMAÇÕES PRECISAS SOBRE COMPRADORES E VENDEDORES? O Flow Bookmap é a ferramenta definitiva para traders que buscam entender o comportamento do mercado em profundidade. Ele transforma os dados do fluxo de ordens em uma interface intuitiva no gráfico do MT5, destacando regiões de interesse crítico para decisões rápidas e seguras. Como Funciona? O Flow Bookmap interpreta a interação entre
Renko Gold
Ignacio Agustin Mene Franco
Renko Gold! clearly indicates the floors and ceilings where it goes from 4 lines, the line below that marks the floor in green confirming with the thinnest line clarifies the purchase entry, the same is for sale, the top line marks the ceiling and the thinnest red line marks the sale, This indicator works for all temporalities! For Forex and Synthetic Indices markets! It also works for crypto markets! Good profit! World Investor.
Fibonacci Auto
Makarii Gubaydullin
Automatically plots Fibo levels, based on the High & Low prices from the specified time frame Multiple bars   may be united: e.g. you can get a Fibo based on the 10-days Highs and Lows My   #1   Utility : 65+ features, including this indicator  |   Contact me  for any questions  |    MT4 version Helps to see potential reversal levels; Patterns formed at the Fibo levels tend to be stronger; Significantly   reduces   the   time   spent   on   manual  plotting ; Settings: Timeframe to calculate the
Uma das sequências numéricas é chamada de "Forest Fire Sequence". Foi reconhecida como uma das mais belas novas sequências. Sua principal característica é que essa sequência evita tendências lineares, mesmo as mais curtas. É esta propriedade que formou a base deste indicador. Ao analisar uma série temporal financeira, este indicador tenta rejeitar todas as opções de tendência possíveis. E somente se ele falhar, ele reconhece a presença de uma tendência e dá o sinal apropriado. Esta abordagem pe
An indicator of patterns #24 and #26 ("Head and Shoulders") from Encyclopedia of Chart Patterns by Thomas N. Bulkowski. Parameters: Alerts - show alert when an arrow appears   Push - send a push notification when an arrow appears (requires configuration in the terminal) PeriodBars - indicator period K - an additional parameter that influences the accuracy of pattern shape recognition ArrowType - a symbol from 1 to 17 ArrowVShift - vertical shift of arrows in pixels   ShowLevels - show levels Col
Cumulative delta indicator As most traders believe, the price moves under the pressure of market buying or selling. When someone redeems an offer standing in the cup, the deal is a "buy". If someone pours into the bid standing in the cup - the deal goes with the direction of "sale". The delta is the difference between purchases and sales. A cumulative delta - the difference between the cumulative sum of purchases and sales for a certain period of time. It allows you to see who is currently contr
Os compradores deste produto também adquirem
Golden Trend Indicator MT5
Noha Mohamed Fathy Younes Badr
4.88 (16)
Golden Trend indicator  is The best indicator for predicting trend movement this indicator never lags and never repaints and never back paints    and give  arrow buy and sell    before the candle appear  and it will help you and  will make your trading decisions clearer its work on all currencies and  gold and crypto and all time frame This unique  indicator uses very secret algorithms to catch the  trends, so you can trade using this indicator and see the trend clear on charts  manual guide and
CBT Quantum Maverick Sistema de Negociação de Opções Binárias de Alta Eficiência O CBT Quantum Maverick é um sistema de opções binárias de alto desempenho, projetado para traders que buscam precisão, simplicidade e um enfoque disciplinado. Não exige personalização: o sistema está otimizado para resultados eficazes desde o início. Basta seguir os sinais, que podem ser dominados com um pouco de prática. Principais características: Precisão nos sinais: Sinais baseados na próxima vela, utilizando
Este é um indicador para MT5 que fornece sinais precisos para entrar em uma negociação sem redesenhar. Ele pode ser aplicado a qualquer ativo financeiro: forex, criptomoedas, metais, ações, índices. Ele fornecerá estimativas bastante precisas e informará quando é melhor abrir e fechar um negócio. Assista o vídeo (6:22) com um exemplo de processamento de apenas um sinal que compensou o indicador! A maioria dos traders melhora seus resultados de negociação durante a primeira semana de negociação c
Quantum TrendPulse
Bogdan Ion Puscasu
5 (13)
Apresentando   Quantum TrendPulse   , a ferramenta de negociação definitiva que combina o poder do   SuperTrend   ,   RSI   e   Stochastic   em um indicador abrangente para maximizar seu potencial de negociação. Projetado para traders que buscam precisão e eficiência, este indicador ajuda você a identificar tendências de mercado, mudanças de momentum e pontos de entrada e saída ideais com confiança. Principais características: Integração SuperTrend:   siga facilmente a tendência predominante do
TPSproTREND PrO MT5
Roman Podpora
4.69 (16)
TPSpro TREND PRO  - is a trend indicator that automatically analyzes the market and provides information about the trend and each of its changes, as well as giving signals for entering trades without redrawing! The indicator uses each candle, analyzing them separately. referring to different impulses - up or down impulse. Exact entry points into transactions for currencies, crypto, metals, stocks, indices!  ИНСТРУКЦИЯ RUS         INSTRUCTIONS  ENG       R ecommended to use with an indicator   -
TPSpro RFI Levels MT5
Roman Podpora
4.53 (19)
INSTRUÇÕES         Russo   -        ENG       R   ecomendado para uso com um indicador       -       TPSpro   TREND PRO -   Versão MT4         Um elemento-chave na negociação são as zonas ou níveis a partir dos quais as decisões de comprar ou vender um instrumento de negociação são tomadas. Apesar das tentativas dos principais participantes de esconder sua presença no mercado, eles inevitavelmente deixam rastros. Nossa tarefa era aprender como identificar esses rastros e interpretá-los corretame
Bill Williams Advanced
Siarhei Vashchylka
5 (9)
Bill Williams Advanced is designed for automatic chart analysis using Bill Williams' "Profitunity" system. The indicator analyzes four timeframes at once. Manual (Be sure to read before purchasing) Advantages 1. Automatically analyzes the chart using the "Profitunity" system of Bill Williams. The found signals are placed in a table in the corner of the screen. 2. Equipped with a trend filter based on the Alligator indicator. Most of the system signals are recommended to be used only according t
Apresentando       Quantum Breakout PRO   , o inovador Indicador MQL5 que está transformando a maneira como você negocia Breakout Zones! Desenvolvido por uma equipe de traders experientes com experiência comercial de mais de 13 anos,       Quantum Breakout PRO       foi projetado para impulsionar sua jornada comercial a novos patamares com sua estratégia de zona de fuga inovadora e dinâmica. O Quantum Breakout Indicator lhe dará setas de sinal em zonas de breakout com 5 zonas-alvo de lucro e su
RelicusRoad Pro MT5
Relicus LLC
4.78 (18)
Agora US $ 147 (aumentando para US $ 499 após algumas atualizações) - Contas ilimitadas (PCs ou Macs) Manual do usuário do RelicusRoad + vídeos de treinamento + acesso ao grupo de discórdia privado + status VIP UMA NOVA FORMA DE OLHAR PARA O MERCADO O RelicusRoad é o indicador de negociação mais poderoso do mundo para forex, futuros, criptomoedas, ações e índices, oferecendo aos traders todas as informações e ferramentas necessárias para se manterem rentáveis. Fornecemos análises técnicas e
FxaccurateLS
Shiv Raj Kumawat
WHY IS OUR FXACCCURATE LS MT5 THE PROFITABLE ? PROTECT YOUR CAPITAL WITH RISK MANAGEMENT Gives entry, stop and target levels from time to time. It finds Trading opportunities by analyzing what the price is doing during established trends. POWERFUL INDICATOR FOR A RELIABLE STRATEGIES We have made these indicators with a lot of years of hard work. It is made at a very advanced level. Established trends provide dozens of trading opportunities, but most trend indicators completely ignore them! The
O Indicador de Quadrados de Gann é uma poderosa ferramenta de análise de mercado baseada no artigo "Fórmula Matemática para Previsões de Mercado" escrito por W.D. Gann, que se baseia em conceitos matemáticos para análise. Ele incorpora elementos das técnicas de Gann relacionadas com os quadrados de 144, 90 e 52, bem como o quadrado de 9. Além disso, inclui o método do  sobre como combinar o quadrado de 9 com canais e padrões de estrela. Manual do Usuário e Modo de Uso: Antes de usar este indicad
BookMap HeatMap
Roberto Spadim
1 (2)
This Indicator creates a heatmap based on depth of market of the current symbol or another symbol. Other symbol is useful when you trade futures market and a contract has 'mini' and 'full' split. For example, in Brazil (B3 - BMF&Bovespa), WDO and DOL are future Forex contract of BRL/USD (where 1 DOL = 5 WDO) and big banks work mostly with DOL (where liquidity is important). Please use with M1 timeframe , objects are too small to be displayed at higher timeframes (MT5 limit). The number of level
Berma Bands
Muhammad Elbermawi
5 (3)
O indicador Berma Bands (BBs) é uma ferramenta valiosa para traders que buscam identificar e capitalizar tendências de mercado. Ao analisar a relação entre o preço e os BBs, os traders podem discernir se um mercado está em uma fase de tendência ou de variação. Visite o [ Blog Berma Home ] para saber mais. As Bandas de Berma são compostas por três linhas distintas: a Banda de Berma Superior, a Banda de Berma Média e a Banda de Berma Inferior. Essas linhas são plotadas em torno do preço, criando u
Royal Scalping Indicator M5
Vahidreza Heidar Gholami
5 (6)
Royal Scalping Indicator is an advanced price adaptive indicator designed to generate high-quality trading signals. Built-in multi-timeframe and multi-currency capabilities make it even more powerful to have configurations based on different symbols and timeframes. This indicator is perfect for scalp trades as well as swing trades. Royal Scalping is not just an indicator, but a trading strategy itself. Features Price Adaptive Trend Detector Algorithm Multi-Timeframe and Multi-Currency Trend Low
CONTACT US  after purchase to get the Indicator Manual. Try Now—Limited 50% Discount for First 10 Buyers! Download the  Metatrader 4 Version Read the product description carefully before purchasing the product.  Due to regulatory restrictions, our service is unavailable in certain countries such as India, Pakistan, and Bangladesh. William Delbert Gann (W.D. Gann) was an exceptional market analyst, whose trading technique was based on a complex blend of mathematics, geometry, astrology, and anc
Advanced Supply Demand MT5
Bernhard Schweigert
4.5 (14)
Atualmente com 33% de desconto! A melhor solução para qualquer Trader Novato ou especialista! Este indicador é uma ferramenta de negociação exclusiva, de alta qualidade e acessível porque incorporamos uma série de recursos proprietários e uma nova fórmula. Com esta atualização, você poderá mostrar fusos horários duplos. Você não só será capaz de mostrar um TF mais alto, mas também mostrar ambos, o TF do gráfico, MAIS o TF mais alto: MOSTRANDO ZONAS ANINHADAS. Todos os traders de Oferta e Demanda
Indicador único que implementa uma abordagem profissional e quantitativa para significar negociação de reversão. Ele capitaliza o fato de que o preço desvia e retorna à média de maneira previsível e mensurável, o que permite regras claras de entrada e saída que superam amplamente as estratégias de negociação não quantitativas. [ Installation Guide | Update Guide | Troubleshooting | FAQ | All Products ] Sinais de negociação claros Incrivelmente fácil de negociar Cores e tamanhos personalizáveis
KT Renko Patterns MT5
KEENBASE SOFTWARE SOLUTIONS
KT Renko Patterns scans the Renko chart brick by brick to find some famous chart patterns that are frequently used by traders across the various financial markets. Compared to the time-based charts, patterns based trading is easier and more evident on Renko charts due to their uncluttered appearance. KT Renko Patterns features multiple Renko patterns, and many of these patterns are extensively explained in the book titled Profitable Trading with Renko Charts by Prashant Shah. A 100% automated
Golden Spikes Detector
Batsirayi L Marango
3.25 (4)
Golden Spikes Detector Este indicador é baseado em uma estratégia avançada principalmente para picos de negociação nos índices Boom e Crash. Algoritmos complexos foram implementados para detectar apenas entradas de alta probabilidade. Ele alerta sobre possíveis entradas de compra e venda. Para negociar picos na corretora Deriv ou Binária, receba apenas os alertas Buy Boom e Sell Cash. Ele foi otimizado para ser carregado em um período de 5 minutos, embora a análise de vários períodos de tempo se
Volume Horizon is a horizontal volume indicator that allows you to observe the density of market participants' volumes across various price and time intervals. Volume histograms can be constructed based on ascending or descending market waves, as well as individual bars. This tool enables more precise determination of entry or exit points, relying on levels of maximum volumes or volume-weighted average prices (VWAP). What makes Volume Horizon unique? 1. Segmentation into ascending and descendi
Quantum Trend Sniper
Bogdan Ion Puscasu
4.73 (51)
Apresentando       Quantum Trend Sniper Indicator   , o inovador Indicador MQL5 que está transformando a maneira como você identifica e negocia as reversões de tendência! Desenvolvido por uma equipe de traders experientes com experiência comercial de mais de 13 anos,       Indicador de Atirador de Tendência Quântica       foi projetado para impulsionar sua jornada de negociação a novos patamares com sua forma inovadora de identificar reversões de tendência com precisão extremamente alta. ***Com
TPA True Price Action indicator reveals the true price action of the market makers through 100% non-repainting signals strictly at the close of a candle! TPA shows entries and re-entries, every time the bulls are definitely stronger than the bears and vice versa. Not to confuse with red/green candles. The shift of power gets confirmed at the earliest stage and is ONE exit strategy of several. There are available now two free parts of the TPA User Guide for our customers. The first "The Basics"
AT Forex Indicator MT5
Marzena Maria Szmit
5 (5)
The AT Forex Indicator MT5 is a sophisticated trading tool designed to provide traders with a comprehensive analysis of multiple currency pairs. This powerful indicator simplifies the complex nature of the forex market, making it accessible for both novice and experienced traders. AT Forex Indicator uses advanced algorithms to detect trends, patterns and is an essential tool for traders aiming to enhance their forex trading performance. With its robust features, ease of use, and reliable signal
Royal Wave Pro M5
Vahidreza Heidar Gholami
3.5 (4)
Royal Wave is a Trend-Power oscillator which has been programmed to locate and signal low-risk entry and exit zones. Its core algorithm statistically analyzes the market and generates trading signals for overbought, oversold and low volatile areas. By using a well-designed alerting system, this indicator makes it easier to make proper decisions regarding where to enter and where to exit trades. Features Trend-Power Algorithm Low risk Entry Zones and Exit Zones Predictions for Overbought and Over
Blahtech Supply Demand MT5
Blahtech Limited
4.54 (13)
Was: $299  Now: $149  Supply Demand uses previous price action to identify potential imbalances between buyers and sellers. The key is to identify the better odds zones, not just the untouched ones. Blahtech Supply Demand indicator delivers functionality previously unavailable on any trading platform. This 4-in-1 indicator not only highlights the higher probability zones using a multi-criteria strength engine, but also combines it with multi-timeframe trend analysis, previously confirmed swings
TrendMaestro5
Stefano Frisetti
note: this indicator is for METATRADER4, if you want the version for METATRADER5 this is the link:  https://www.mql5.com/it/market/product/108106 TRENDMAESTRO ver 2.4 TRENDMAESTRO recognizes a new TREND in the bud, he never makes mistakes. The certainty of identifying a new TREND is priceless. DESCRIPTION TRENDMAESTRO identifies a new TREND in the bud, this indicator examines the volatility, volumes and momentum to identify the moment in which there is an explosion of one or more of these data a
Este é sem dúvida o indicador de reconhecimento automático de formação de preço harmônico mais completo que você pode encontrar para a MetaTrader Platform. Ele detecta 19 padrões diferentes, leva as projeções de Fibonacci tão a sério quanto você, exibe a Zona de Reversão Potencial (PRZ) e encontra níveis adequados de stop loss e take-profit. [ Guia de instalação | Guia de atualização | Solução de problemas | FAQ | Todos os produtos ] Detecta 19 formações harmônicas de preços diferentes Traça
Trend Forecaster
Alexey Minkov
5 (6)
!SPECIAL SALE!  The Trend Forecaster indicator utilizes a unique proprietary algorithm to determine entry points for a breakout trading strategy. The indicator identifies price clusters, analyzes price movement near levels, and provides a signal when the price breaks through a level. The Trend Forecaster indicator is suitable for all financial assets, including currencies (Forex), metals, stocks, indices, and cryptocurrencies. You can also adjust the indicator to work on any time frames, althoug
MetaForecast M5
Vahidreza Heidar Gholami
5 (2)
MetaForecast prevê e visualiza o futuro de qualquer mercado com base nas harmonias nos dados de preços. Embora o mercado nem sempre seja previsível, se houver um padrão nos preços, o MetaForecast pode prever o futuro com a maior precisão possível. Em comparação com outros produtos similares, o MetaForecast pode gerar resultados mais precisos ao analisar as tendências do mercado. Parâmetros de entrada Past size (Tamanho do passado) Especifica o número de barras que o MetaForecast usa para criar
O indicador mostra a direção da tendência de vários períodos de tempo numa janela. Se a tendência de vários períodos de tempo coincidir, são desenhadas setas. Também pode mudar para o histograma, indicando a tendência no período de tempo atual. O indicador desenha pontos de entrada e pontos de saída aproximados no gráfico. Aviso: uma vez que o indicador é multi-timeframe, quando utilizado no testador de estratégias, as cotações para todos os timeframes necessários devem ser descarregadas antec
Mais do autor
O Captador de Tendências: A Estratégia do Captador de Tendências com Indicador de Alerta é uma ferramenta versátil de análise técnica que auxilia os traders na identificação de tendências de mercado e potenciais pontos de entrada e saída. Apresenta uma Estratégia dinâmica do Captador de Tendências, adaptando-se às condições do mercado para uma representação visual clara da direção da tendência. Os traders podem personalizar os parâmetros de acordo com suas preferências e tolerância ao risco. O
FREE
O Localizador de Níveis de Suporte e Resistência: O Localizador de Níveis de Suporte e Resistência é uma ferramenta avançada projetada para aprimorar a análise técnica no trading. Com níveis dinâmicos de suporte e resistência, ele se adapta em tempo real conforme novos pontos-chave se desdobram no gráfico, fornecendo uma análise dinâmica e responsiva. Sua capacidade única de múltiplos intervalos de tempo permite aos usuários exibir níveis de suporte e resistência de diferentes intervalos de te
FREE
Antes de tudo, vale ressaltar que esta Ferramenta de Negociação é um Indicador Não Repintante, Não Redesenhante e Não Atrasado, o que a torna ideal para negociação profissional. Curso online, manual do utilizador e demonstração. O Indicador de Conceitos de Ação de Preço Inteligente é uma ferramenta muito poderosa tanto para traders novos quanto experientes. Ele combina mais de 20 indicadores úteis em um único, combinando ideias avançadas de negociação como Análise do Trader do Círculo Interno
Ferramenta de Posição de Negociação e Backtesting: A "Ferramenta de Posição de Negociação e Backtesting", também conhecida como "Ferramenta de Risco e Recompensa", é um indicador abrangente e inovador projetado para aprimorar sua análise técnica e estratégias de negociação. A Ferramenta de Risco é uma solução completa e fácil de usar para gestão eficaz de riscos na negociação forex. Com a capacidade de visualizar posições de negociação, incluindo preço de entrada, stop-loss (SL) e take-profit
FREE
O Indicador de Tempo das Sessões de Negociação: O "Indicador de Tempo das Sessões de Negociação" é uma poderosa ferramenta de análise técnica projetada para aprimorar sua compreensão das diferentes sessões de negociação no mercado Forex. Este indicador integrado de forma transparente fornece informações cruciais sobre os horários de abertura e fechamento das principais sessões, incluindo Tóquio, Londres e Nova York. Com o ajuste automático do fuso horário, ele atende aos traders globalmente, a
FREE
Primeiramente, vale ressaltar que este Sistema de Trading é um Indicador Não Repintado, Não Redesenho e Não Atrasado, o que o torna ideal tanto para o trading manual quanto para o automatizado. Curso online, manual e download de predefinições. O "Sistema de Trading Inteligente MT5" é uma solução completa de trading projetada para traders novos e experientes. Ele combina mais de 10 indicadores premium e apresenta mais de 7 estratégias de trading robustas, tornando-o uma escolha versátil para dive
O Localizador de Níveis de Suporte e Resistência: O Localizador de Níveis de Suporte e Resistência é uma ferramenta avançada projetada para aprimorar a análise técnica no trading. Com níveis dinâmicos de suporte e resistência, ele se adapta em tempo real conforme novos pontos-chave se desdobram no gráfico, fornecendo uma análise dinâmica e responsiva. Sua capacidade única de múltiplos intervalos de tempo permite aos usuários exibir níveis de suporte e resistência de diferentes intervalos de te
FREE
O Indicador de Tempo das Sessões de Negociação: O "Indicador de Tempo das Sessões de Negociação" é uma poderosa ferramenta de análise técnica projetada para aprimorar sua compreensão das diferentes sessões de negociação no mercado Forex. Este indicador integrado de forma transparente fornece informações cruciais sobre os horários de abertura e fechamento das principais sessões, incluindo Tóquio, Londres e Nova York. Com o ajuste automático do fuso horário, ele atende aos traders globalmente, a
FREE
Ferramenta de Posição de Negociação e Backtesting: A "Ferramenta de Posição de Negociação e Backtesting", também conhecida como "Ferramenta de Risco e Recompensa", é um indicador abrangente e inovador projetado para aprimorar sua análise técnica e estratégias de negociação. A Ferramenta de Risco é uma solução completa e fácil de usar para gestão eficaz de riscos na negociação forex. Com a capacidade de visualizar posições de negociação, incluindo preço de entrada, stop-loss (SL) e take-profit
FREE
Description:  For a comprehensive understanding of our indicators, we invite you to explore the entire Q&A section within this MQL5 blog post   here . The "VWAP Indicator Strategy" is a cutting-edge technical analysis tool designed to provide traders with a competitive advantage in the financial markets. By incorporating the Volume Weighted Average Price (VWAP) indicator, this tool offers valuable insights into market trends, price levels, and potential turning points. Understanding the VWAP Ind
Get FREE Advanced Online Course and Learn About Our Advanced Trading System, Link in the Bio!  Click Here.  Our Mission and Vision:   Why Am I Even Here?    Here is The Deal Brother, We Offer:Premium Quality Indicators: The Highest Quality Possible Algorithms. Unlimited Activations: Can be used on Unlimited number of Computers, MT4s and MT5s for lifetime. Inexpensive Prices: 30$ is the lowest price possible, Knowing that more than 50% of our Indicators are 100% FREE. But Why Am I telling You th
Description:  The "ABC Pattern Strategy With Fibonacci" Indicator is a sophisticated technical analysis tool meticulously designed to recognize and leverage the power of the ABC chart patterns in combination with Fibonacci levels. This cutting-edge strategy empowers traders to make well-informed decisions in the dynamic forex market. By making spotting ABC patterns on price charts an easy task, the indicator offers insights into potential trend reversals or continuations. It seamlessly incorpora
Get FREE Advanced Online Course and Learn About Our Advanced Trading System, Link in the Bio!  Click Here.  Our Mission and Vision:   Why Am I Even Here? Here is The Deal Brother, We Offer:Premium Quality Indicators: The Highest Quality Possible Algorithms. Unlimited Activations: Can be used on Unlimited number of Computers, MT4s and MT5s for lifetime. Inexpensive Prices: 30$ is the lowest price possible, Knowing that more than 50% of our Indicators are 100% FREE. But Why Am I telling You this?
Description:  For a comprehensive understanding of our indicators, we invite you to explore the entire Q&A section within this MQL5 blog post   here . The "Moving Average Lines Crossover with Alert" is a valuable technical analysis tool designed to help traders identify potential trend reversals and trading opportunities. Seamlessly integrated into your trading platform, this indicator empowers you with essential data to make well-informed trading decisions. Spot Trend Reversals: Utilize the pow
FREE
Price Alert Panel MT4
Issam Kassas
4.75 (12)
Get FREE Advanced Online Course and Learn About Our Advanced Trading System, Link in the Bio!  Click Here.  Our Mission and Vision: Why Am I Even Here?Here is The Deal Brother, We Offer: Premium Quality Indicators: The Highest Quality Possible Algorithms. Unlimited Activations: Can be used on Unlimited number of Computers, MT4s and MT5s for lifetime. Inexpensive Prices: 30$ is the lowest price possible, Knowing that more than 50% of our Indicators are 100% FREE. But Why Am I telling You this?
FREE
Description:  For a comprehensive understanding of our indicators, we invite you to explore the entire Q&A section within this MQL5 blog post   here . The "Show TP and SL Values" Indicator is a valuable technical analysis tool designed to enhance your trading experience by displaying the  (TP) and  (SL) levels directly on your chart. This simple yet effective tool provides traders with crucial information, allowing for better decision-making and risk management. Key Features: TP and SL Display:
FREE
Description:  The Range Breakout Catcher Indicator is a powerful tool known for its non-repainting, non-redrawing, and non-lagging capabilities, making it suitable for both manual and robot trading. This indicator utilizes a smart algorithm to calculate ranges and generate early signals for Buy and Sell positions at the breakout of these ranges, facilitating the capture of trends during ranging consolidations. The range calculation involves a comprehensive system based on various elements, prov
Description:  For a comprehensive understanding of our indicators, we invite you to explore the entire Q&A section within this MQL5 blog post   here . The Moving Average 5EMA Indicator is a valuable tool designed to provide comprehensive insights into market trends and potential entry and exit points. It incorporates five exponential moving average (EMA) lines, each representing the average price over different periods. This powerful combination offers a deeper understanding of price movements a
FREE
Description:  For a comprehensive understanding of our indicators, we invite you to explore the entire Q&A section within this MQL5 blog post   here . The "Live Account Statistics" Indicator is a powerful technical analysis tool that provides real-time insights into the performance of your trading account. With this indispensable tool, you can access crucial account statistics, such as balance, equity, drawdown, and more, allowing you to make data-driven trading decisions. Key Features: Real-Ti
FREE
Show TP and SL Values
Issam Kassas
4.56 (9)
Description:  For a comprehensive understanding of our indicators, we invite you to explore the entire Q&A section within this MQL5 blog post   here . The "Show TP and SL Values" Indicator is a valuable technical analysis tool designed to enhance your trading experience by displaying the  (TP) and  (SL) levels directly on your chart. This simple yet effective tool provides traders with crucial information, allowing for better decision-making and risk management. Key Features: TP and SL Display:
FREE
Description:  For a comprehensive understanding of our indicators, we invite you to explore the entire Q&A section within this MQL5 blog post   here . The "VWAP Indicator Strategy" is a cutting-edge technical analysis tool designed to provide traders with a competitive advantage in the financial markets. By incorporating the Volume Weighted Average Price (VWAP) indicator, this tool offers valuable insights into market trends, price levels, and potential turning points. Understanding the VWAP Ind
Description:  For a comprehensive understanding of our indicators, we invite you to explore the entire Q&A section within this MQL5 blog post   here . The "High Spread Alert" Indicator is a valuable tool for traders, providing real-time information about spread fluctuations in the forex market. As a technical analysis tool, it helps traders make informed decisions by alerting them to periods of high spread, which can impact trading conditions and execution. Key Features: Spread Monitoring: The
FREE
Description:  The "Trend Finder Multi Time Frames multi pairs" indicator is a new technical analysis tool designed to assist traders in identifying and confirming trends across multiple timeframes and multiple pairs at the same time. By combining the strengths of various timeframes, this indicator offers a comprehensive view of the market's direction, helping traders make more informed decisions. Features: Multi-Timeframe Analysis: The indicator analyzes trends on different timeframes (e.g., M1
Description:  For a comprehensive understanding of our indicators, we invite you to explore the entire Q&A section within this MQL5 blog post   here . The "High Spread Alert" Indicator is a valuable tool for traders, providing real-time information about spread fluctuations in the forex market. As a technical analysis tool, it helps traders make informed decisions by alerting them to periods of high spread, which can impact trading conditions and execution. Key Features: Spread Monitoring: The i
FREE
Description:  For a comprehensive understanding of our indicators, we invite you to explore the entire Q&A section within this MQL5 blog post   here . The "Currency Strength Meter Strategy" Indicator is a cutting-edge technical analysis tool that offers traders a unique perspective on the forex market. By analyzing the relative strength of different currencies, this indicator provides valuable insights into the market's dynamics, allowing traders to make informed decisions. Understanding Curren
Description:  For a comprehensive understanding of our indicators, we invite you to explore the entire Q&A section within this MQL5 blog post   here . The "Candlestick Pattern Finder with Alerts and Hide Button" is a sophisticated technical analysis tool designed to elevate your trading experience by identifying key candlestick patterns in the market. This powerful indicator offers valuable insights into price action, enabling you to make well-informed trading decisions. Unlock Candlestick Insi
Description:  For a comprehensive understanding of our indicators, we invite you to explore the entire Q&A section within this MQL5 blog post   here . The "MACD Crossover with Alert and Button" is a valuable technical analysis tool designed to help traders spot potential trend changes and trading opportunities in the market. This indicator provides essential insights into the market's momentum, enabling you to make well-informed trading decisions. Master the MACD Indicator: The Moving Average Co
Description:  For a comprehensive understanding of our indicators, we invite you to explore the entire Q&A section within this MQL5 blog post   here . The "Moving Average Lines Crossover with Alert" is a valuable technical analysis tool designed to help traders identify potential trend reversals and trading opportunities. Seamlessly integrated into your trading platform, this indicator empowers you with essential data to make well-informed trading decisions. Spot Trend Reversals: Utilize the po
Description:  For a comprehensive understanding of our indicators, we invite you to explore the entire Q&A section within this MQL5 blog post   here . The Moving Average Cross Price Alert Indicator is a technical tool designed to simplify your trading decisions. With a single moving average line, this indicator effectively identifies trend changes and potential trade opportunities. Its core function is to provide real-time alerts when the price crosses above or below the moving average line, sig
Description:  The "Trend Finder Multi Time Frames multi pairs" indicator is a new technical analysis tool designed to assist traders in identifying and confirming trends across multiple timeframes and multiple pairs at the same time. By combining the strengths of various timeframes, this indicator offers a comprehensive view of the market's direction, helping traders make more informed decisions. Features: Multi-Timeframe Analysis: The indicator analyzes trends on different timeframes (e.g., M1
Filtro:
Suherdi St
274
Suherdi St 2025.01.24 07:19 
 

sangat membantu, untuk startegi support dan resisten

jacksoh01
47
jacksoh01 2024.09.10 23:21 
 

Why you haven't replied to me for so many days when you indicator got problum ? ? ?

krzys1973
426
krzys1973 2024.05.17 20:40 
 

O usuário não deixou nenhum comentário para sua avaliação

Issam Kassas
355798
Resposta do desenvolvedor Issam Kassas 2024.05.19 13:09
So many people dont know the purpose of this Indicator! Pls guys watch the online course first.
This Indicator is a trading system dedicated for experienced traders who trade support and resistance strategies and who do technical analysis! This is indicator is packed with multiple indicators that can be used alone or mixed to create your own strategy! Please learn support and resistance strategies and price action.
nasar78613
135
nasar78613 2024.02.13 10:37 
 

Very good indicator for support and resistance but we have some issues this indicator not work below 15m timeframe please you can fix this and second candlestick accuracy is 60% please increase

Responder ao comentário
Versão 1.10 2023.11.09
- Fixed some bugs and optimized the performance.