• Overview
  • Reviews (4)
  • Comments (6)
  • What's new

Smart Support and Resistance Trading System MT5

3.67

First of all Its worth emphasizing here that this Trading System is Non-Repainting, Non-Redrawing and Non-Lagging Indicator, Which makes it ideal for professional trading.

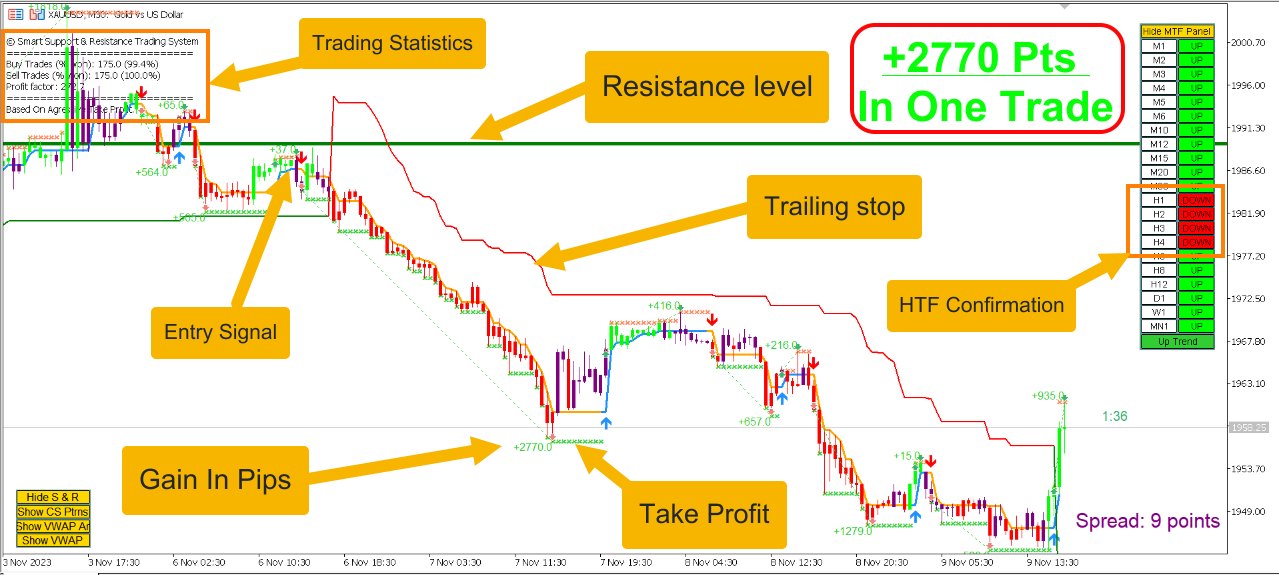
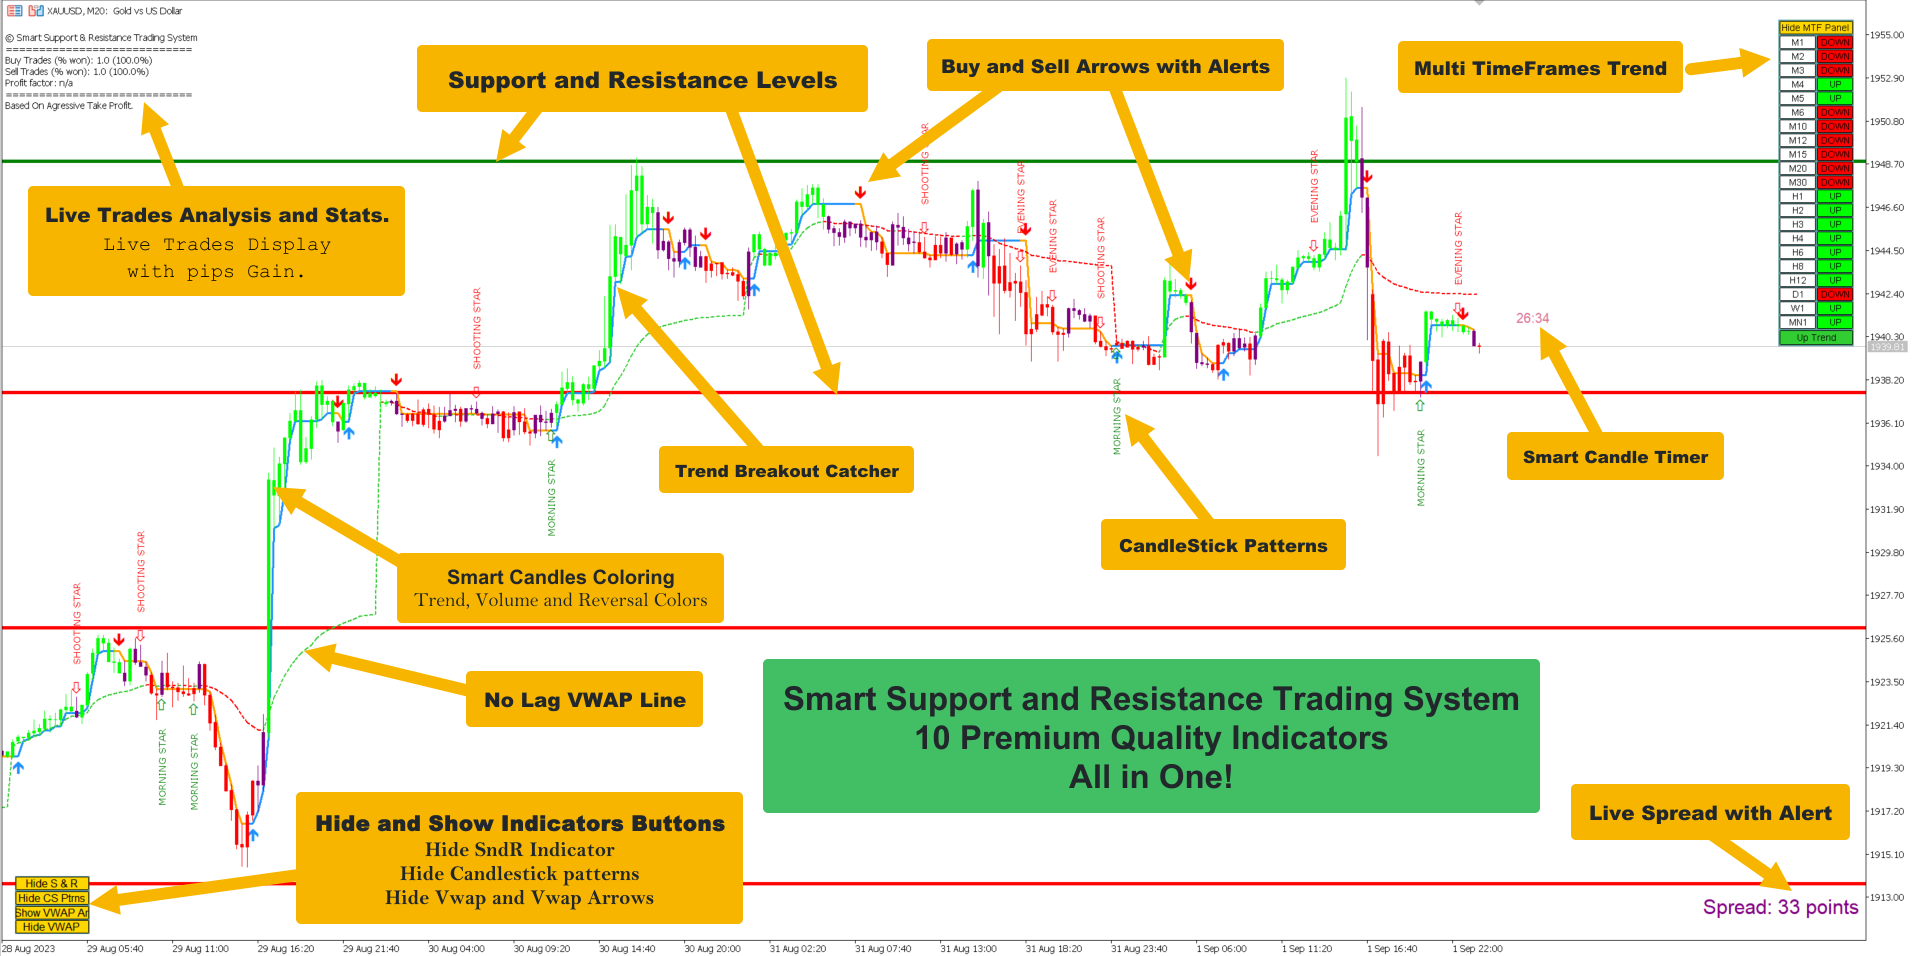
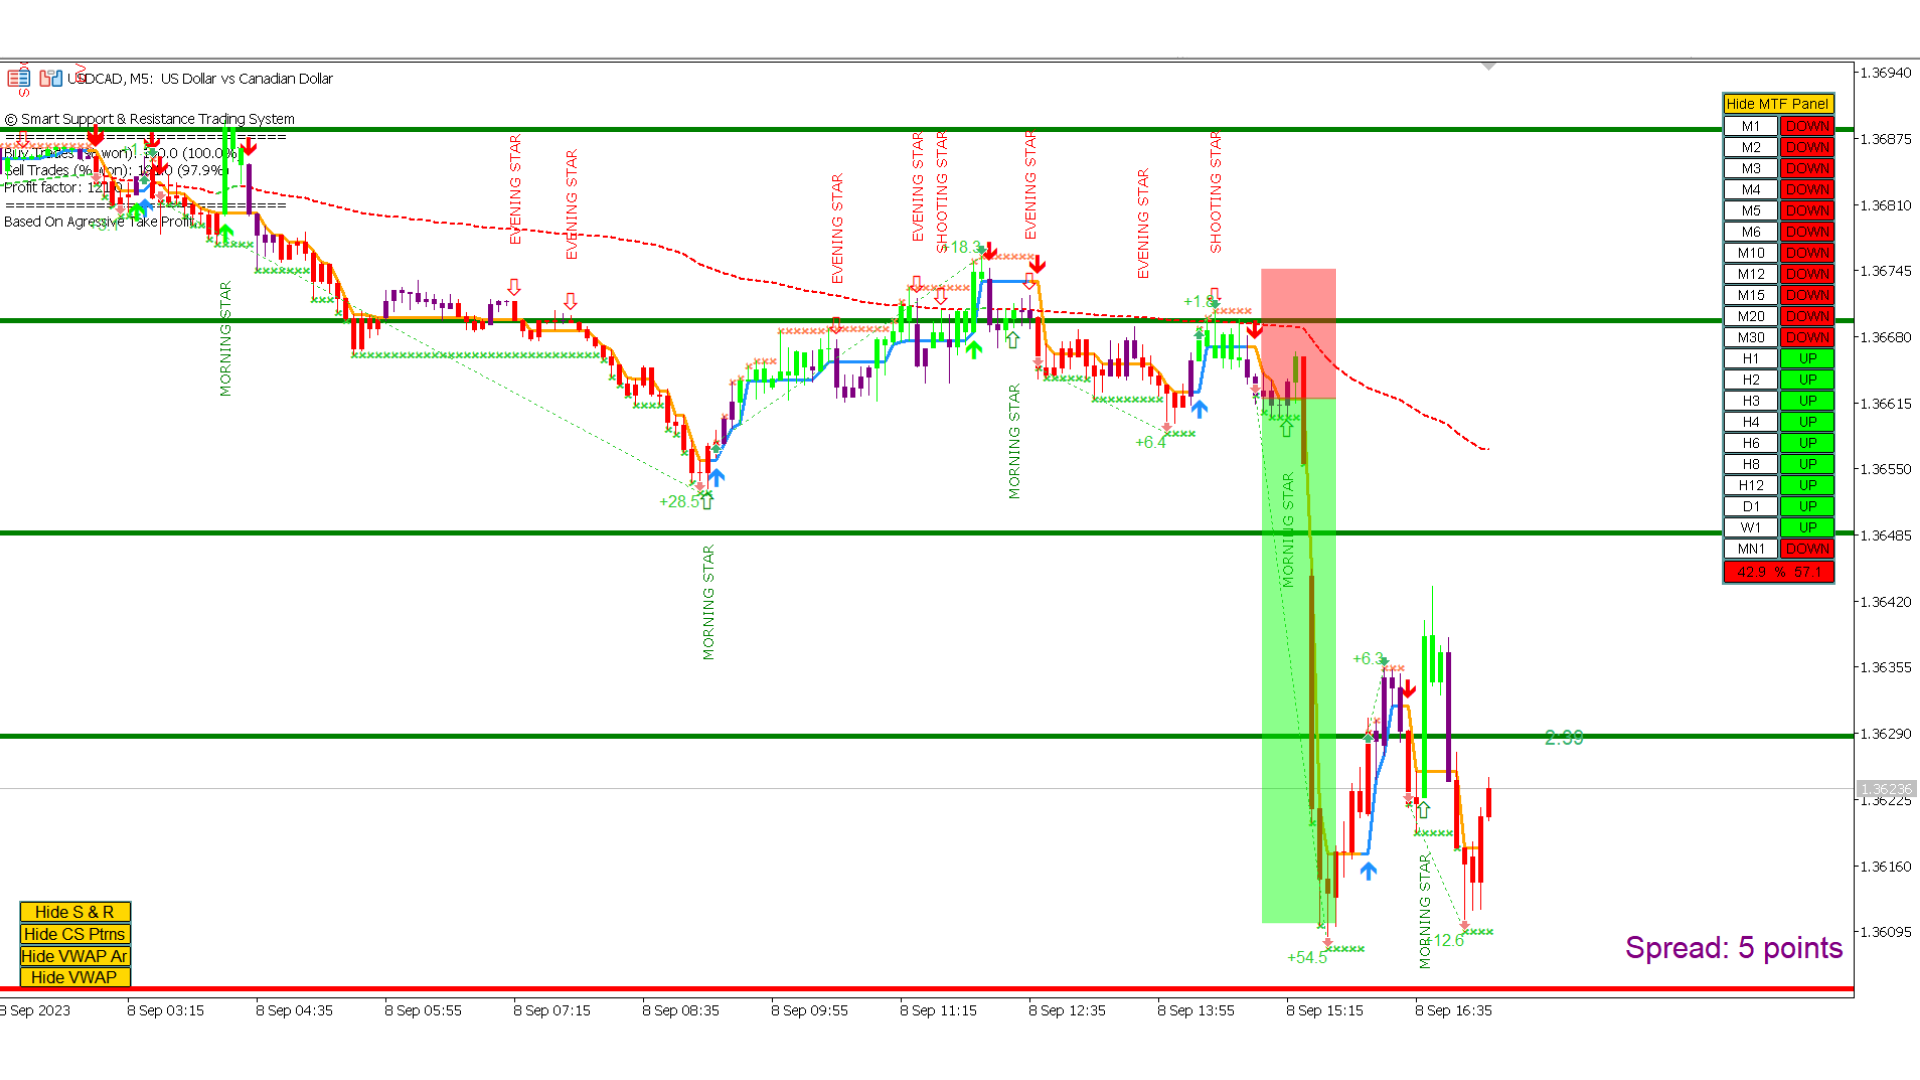
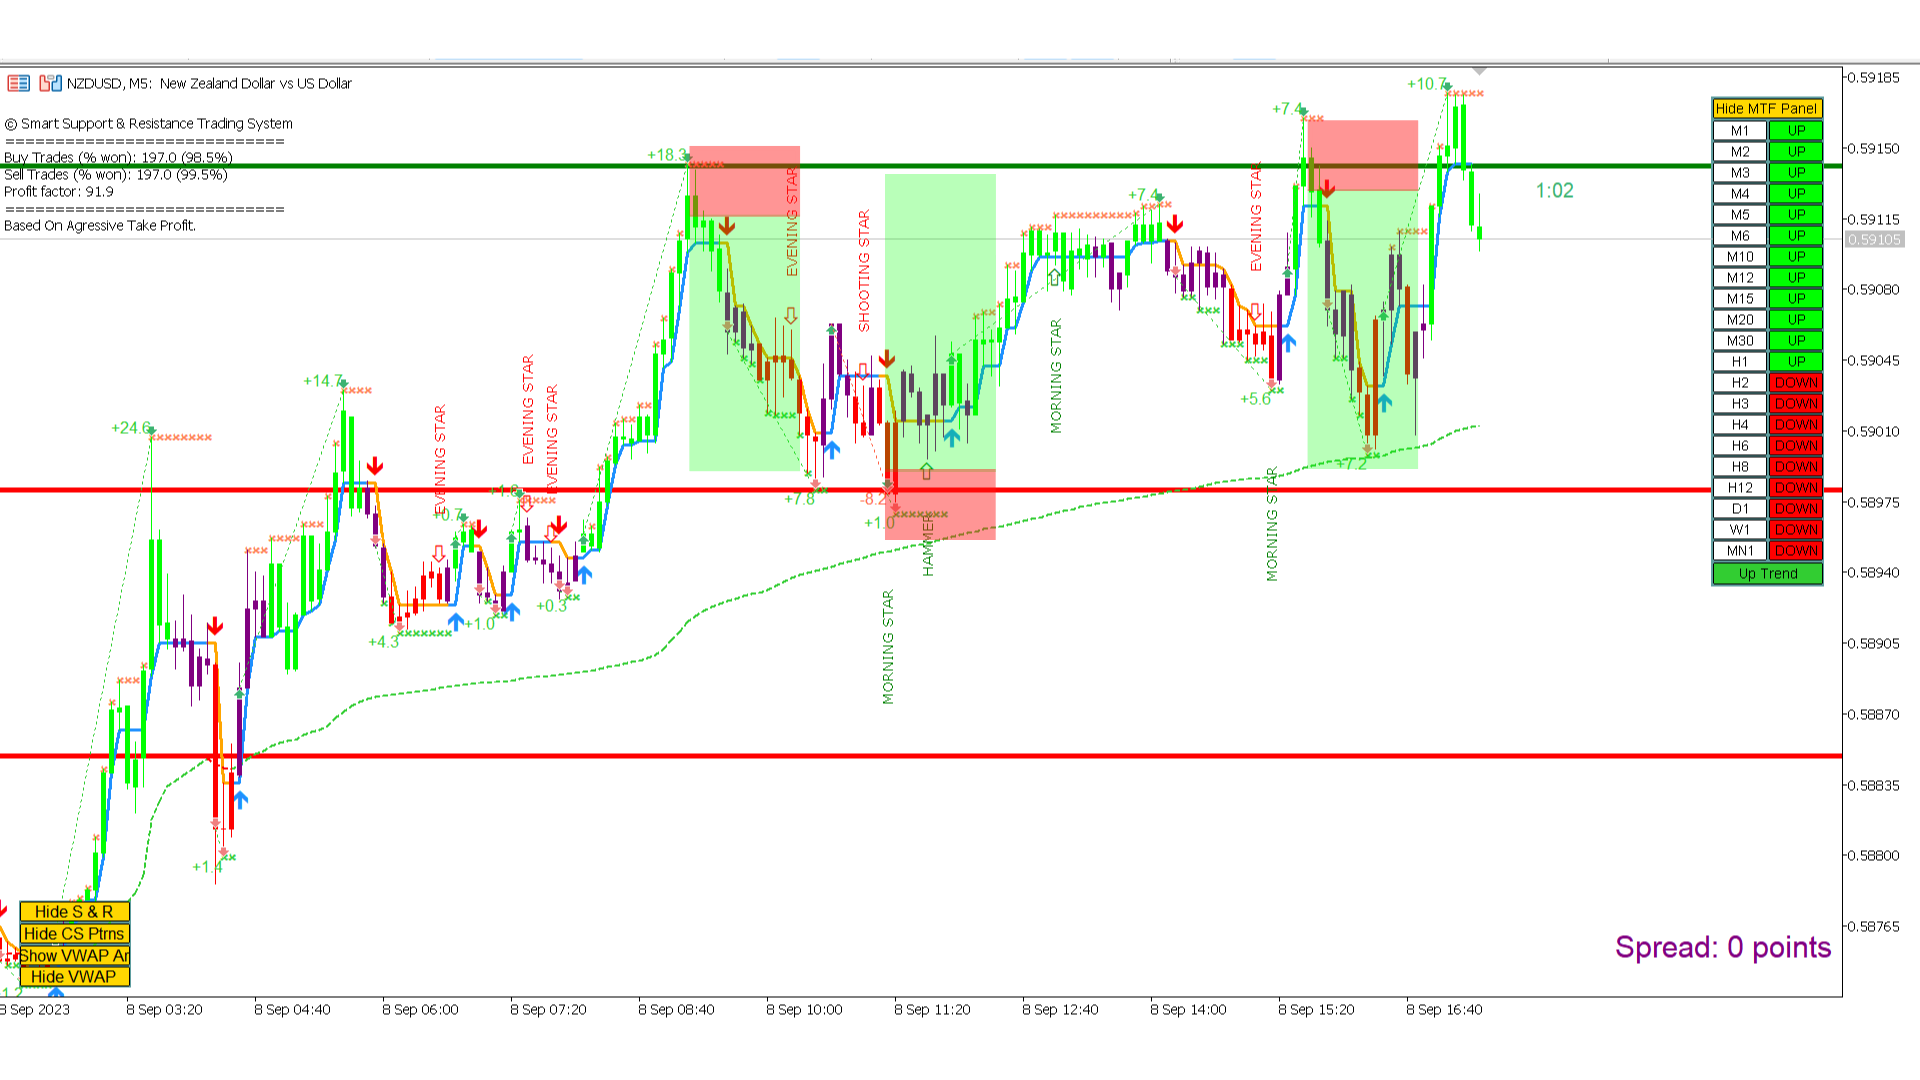
The "Smart Support and Resistance Trading System" is an advanced indicator tailored for new and experienced traders. It empowers traders with precision and confidence in the forex market. This comprehensive system combines 7+ strategies, 10 indicators, and various trading approaches, including day trading strategy, swing trading strategy, support and resistance strategy, candlestick patterns strategy, VWAP strategy, multi timeframe trend strategy, and more. It provides arrow signals, entry and exit points, trade alerts, higher timeframe trend analysis, real-time trade monitoring, and insightful trend and volume candle coloring. With automatic support and resistance detection, it's a multifaceted indicator aiding traders in making informed decisions across diverse market conditions.


The Smart Support and Resistance Trading System is a robust technical analysis approach that incorporates a suite of premium and powerful indicators and tools. 
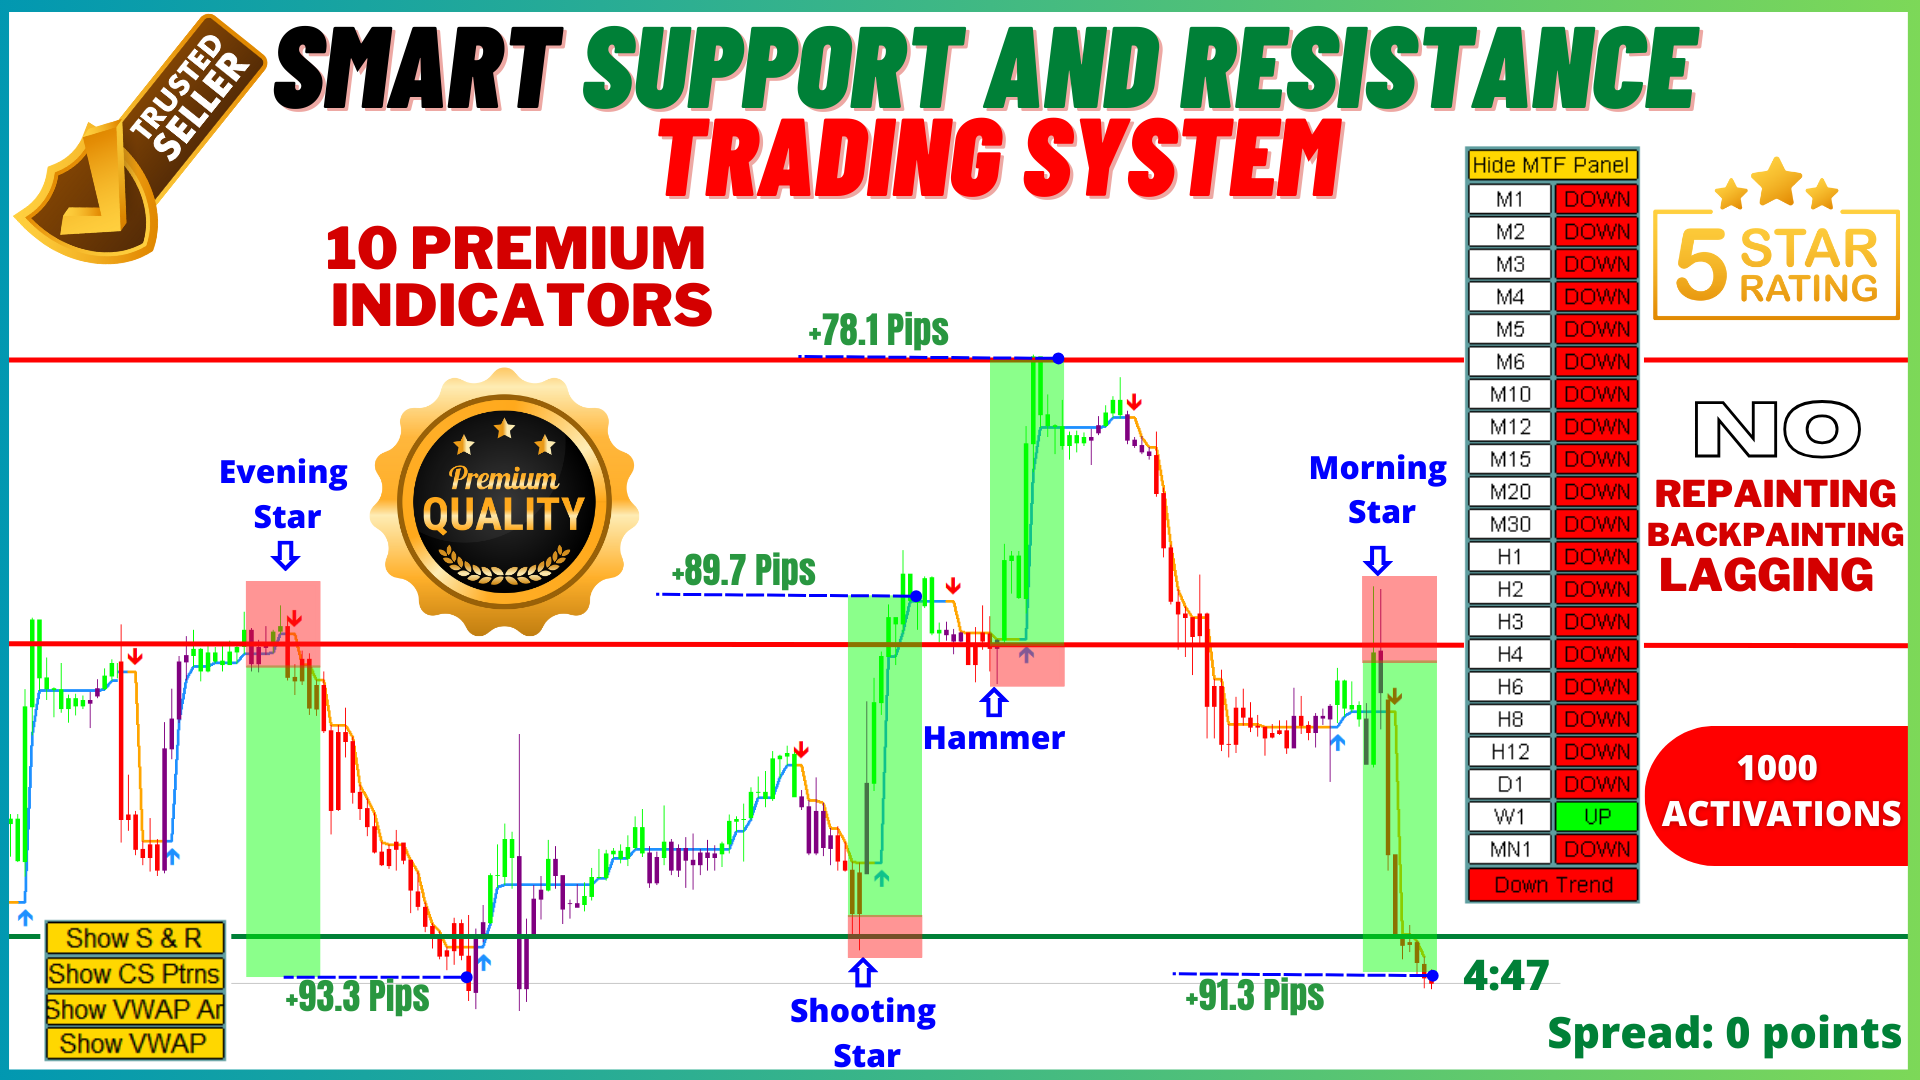
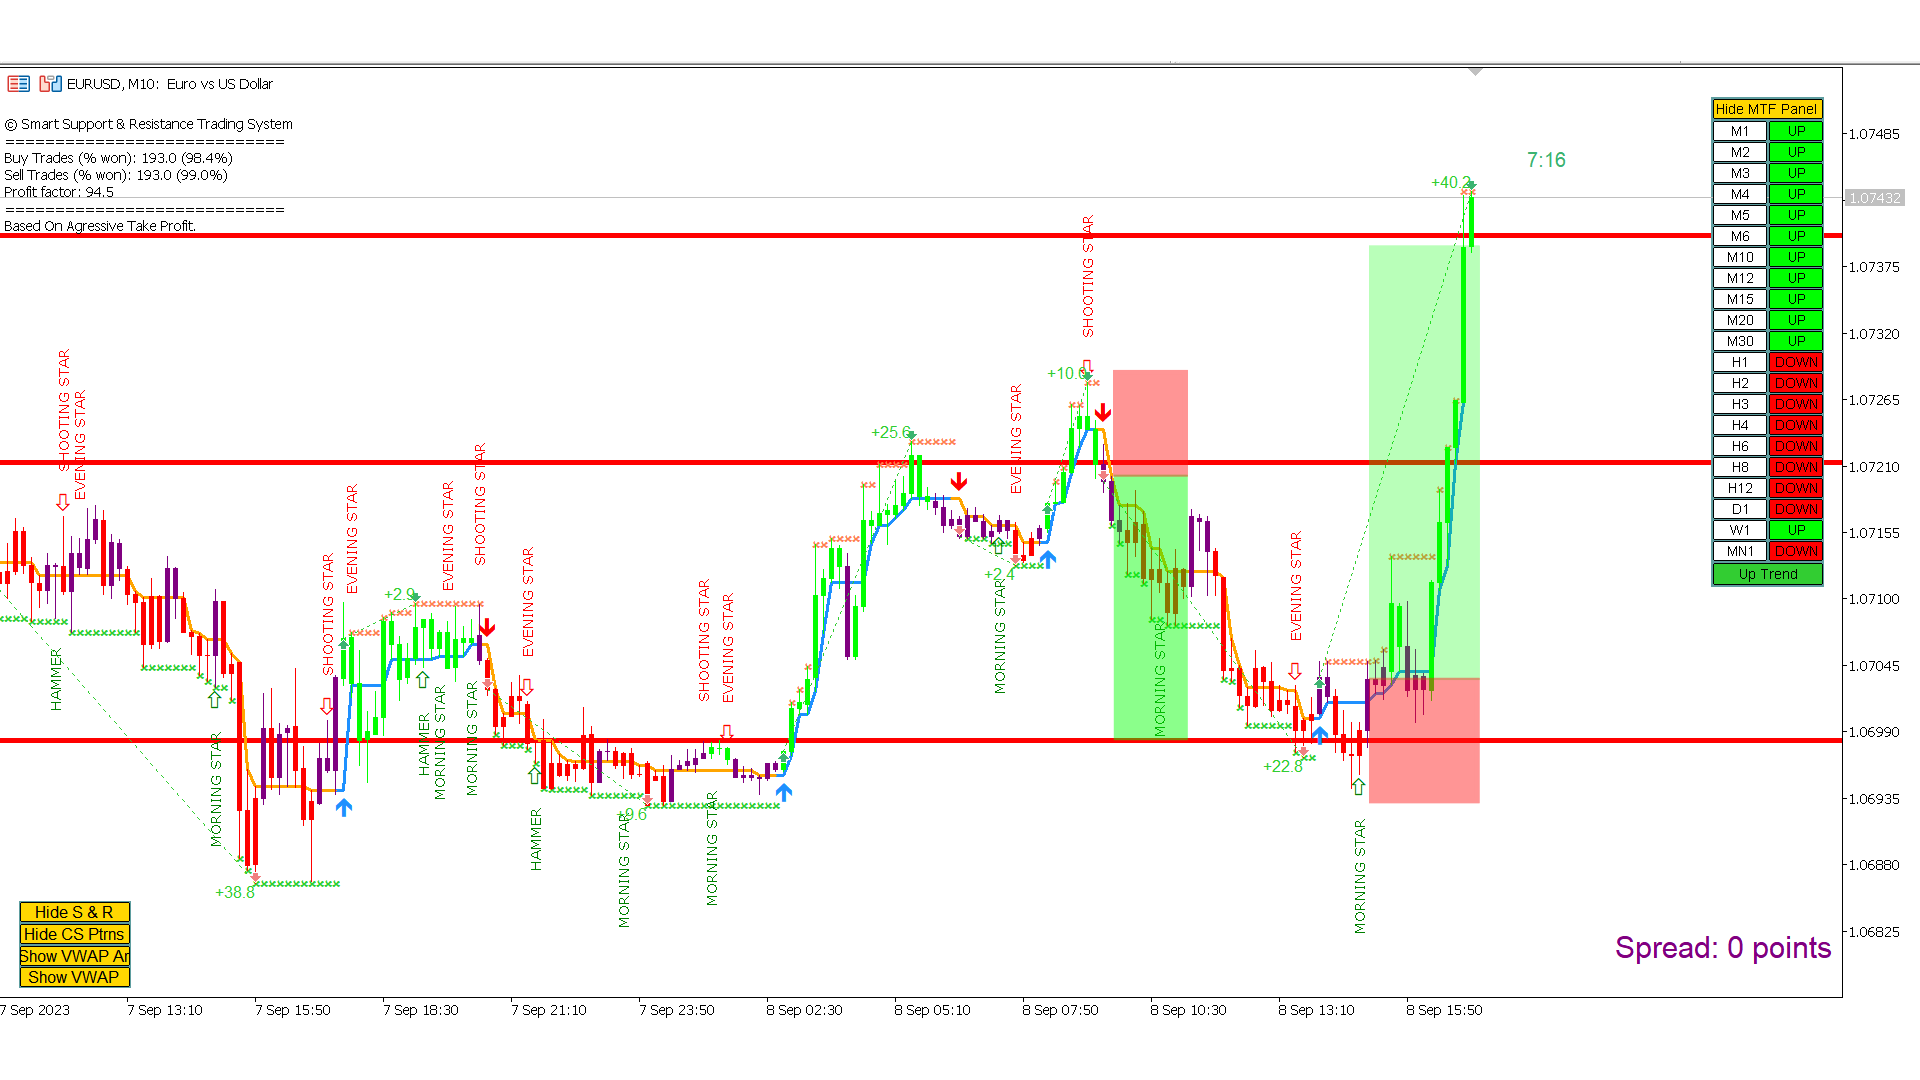
At its core, this system identifies key support and resistance levels, which serve as critical zones for potential market reversals or continuations. The system seamlessly integrates a Multi-Timeframes Trend Panel, enhancing traders' ability to assess the prevailing trend direction across different timeframes. Moreover, the Candlestick Patterns Detector scans price charts for essential candlestick patterns, providing valuable insights into potential market movements. Additionally, the inclusion of VWAP (Volume Weighted Average Price) assists traders in gauging market sentiment and intraday trends which is ideal for day trading.

The Smart Support and Resistance Trading System further offers the Trend Breakout Catcher, which identifies and confirms trend breakouts, helping traders make timely entries and exits. This system also employs Trend and Volume Candles Coloring, which enhances visualization by dynamically coloring candles based on trend strength and volume characteristics.
To empower traders with real-time information, the system includes a Live Spread Indicator with alerts, alerting traders to changing market conditions. A Smart Candle Timer ensures traders remain aware of candlestick closing times, aiding in decision-making.

Finally, the Live Trades Analysis feature prints essential trade statistics directly on the chart, providing traders with actionable insights into their trading performance. By integrating these advanced indicators and tools, the Smart Support and Resistance Trading System offers a comprehensive solution for traders seeking to navigate the markets effectively and with confidence.

Features:

  •  Non-repainting, non-redrawing and non-lagging indicators
  •  7+ strategies
  •  10 Indicators all in one
  •  Day and swing trading strategies
  •  Trend following, reversal and scalping strategies
  •  Custom strategies
  •  Prop firm strategies
  •  Entry and exit points and arrows
  •  Alerts to phone and email
  •  MTF analysis
  •  Automatic support and resistance
  •  Candlestick patterns all kinds
  •  Reversal zones
  •  Trailing stop
  •  Volume, trend and reversal candle coloring
  •  Candle timer and spread limit indicators
  •  Live trades analysis


Reviews 4
Suherdi St
274
Suherdi St 2025.01.24 07:19 
 

sangat membantu, untuk startegi support dan resisten

nasar78613
135
nasar78613 2024.02.13 10:37 
 

Very good indicator for support and resistance but we have some issues this indicator not work below 15m timeframe please you can fix this and second candlestick accuracy is 60% please increase

Recommended products
First of all Its worth emphasizing here that this Trading Tool is Non Repainting , Non Redrawing and Non Lagging Indicator , Which makes it ideal for professional trading . Online course, user manual and demo. The Smart Price Action Concepts Indicator is a very powerful tool for both new and experienced traders . It packs more than 20 useful indicators into one , combining advanced trading ideas like Inner Circle Trader Analysis and Smart Money Concepts Trading Strategies . This indicator focus
Noize Absorption Index - is the manual trading system that measures the difference of pressure between bears forces and bulls forces. Green line - is a noize free index that showing curent situation. Zero value of index shows totally choppy/flat market.Values above zero level shows how powerfull bullish wave is and values below zero measures bearish forces.Up arrow appears on bearish market when it's ready to reverse, dn arrow appears on weak bullish market, as a result of reverse expectation.
An indicator of pattern #31 ("Long Island") from Encyclopedia of Chart Patterns by Thomas N. Bulkowski. The second gap is in the opposite direction. Parameters: Alerts - show alert when an arrow appears   Push - send a push notification when an arrow appears (requires configuration in the terminal) GapSize - minimum gap size in points ArrowType - a symbol from 1 to 17 ArrowVShift - vertical shift of arrows in points   ShowLevels - show levels ColUp - color of an upward line ColDn - color of a d
The Penta-O is a 6-point retracement harmonacci pattern which usually precedes big market movements. Penta-O patterns can expand and repaint quite a bit. To make things easier this indicator implements a twist: it waits for a donchian breakout in the right direction before signaling the trade. The end result is an otherwise repainting indicator with a very reliable trading signal. The donchian breakout period is entered as an input. [ Installation Guide | Update Guide | Troubleshooting | FAQ | A
Atomic Analyst MT5
Issam Kassas
4.32 (19)
First of all Its worth emphasizing here that this Trading Indicator is   Non-Repainting   , Non Redrawing and Non Lagging Indicator   Indicator, Which makes it ideal from both manual and robot trading.  User manual: settings, inputs and strategy . The Atomic Analyst  is a PA Price Action Indicator that uses Strength and Momentum of the price to find a better edge in the market. Equipped with Advanced filters which help remove noises and false signals, and Increase Trading Potential. Using Multi
Your Trend Friend
Luigi Nunes Labigalini
5 (1)
The trend is your friend! Look at the color of the indicator and trade on that direction. It does not  repaint. After each candle is closed, that's the color of the trend. You can focus on shorter faster trends or major trends, just test what's most suitable for the symbol and timeframe you trade. Simply change the "Length" parameter and the indicator will automatically adapt. You can also change the color, thickness and style of the lines. Download and give it a try! There are big movements w
Trading Utility for Forex Currency Pairs Only not for Gold  Functions Auto Lot Calculation based on Risk Auto stoploss  Auto TakeProfit Breakeven Auto Close Half % Close in percentage with respect to the PIPs Pending Orders BuyLimit Sell Limit with distances BuyStop Sell Stop    with distances Trading Informations Risk in percentage For Multiple trades Combine Takeprofit and Combine Stoplosses
Owl Smart Levels MT5
Sergey Ermolov
4.07 (28)
MT4 version  |   FAQ The Owl Smart Levels Indicator is a complete trading system within the one indicator that includes such popular market analysis tools as Bill Williams' advanced fractals , Valable ZigZag which builds the correct wave structure of the market, and Fibonacci levels which mark the exact levels of entry into the market and places to take profits. Detailed description of the strategy Instructions for working with the indicator Advisor-assistant in trading Owl Helper Private User
Crash 1000 Scalping Indicator for the Crash 1000 Deriv Synthetic Index. Introduction The Crash 1000 Scalping Indicator is a specialized tool designed for the Crash 1000 index on the Deriv Synthetic market. This indicator is particularly useful for scalping on the M1 timeframe, helping traders to identify precise entry and exit points for buy positions. It is designed to be non-repainting, providing clear signals with audible alerts and push notifications, and is compatible with mobile devices th
Premium level is a unique indicator with more than 80% accuracy of correct predictions! This indicator has been tested for more than two months by the best Trading Specialists! The author's indicator you will not find anywhere else! From the screenshots you can see for yourself the accuracy of this tool! 1 is great for trading binary options with an expiration time of 1 candle. 2 works on all currency pairs, stocks, commodities, cryptocurrencies Instructions: As soon as the red arrow app
Double HMA MTF for MT5
Pavel Zamoshnikov
4 (4)
This is an advanced multi-timeframe version of the popular Hull Moving Average (HMA) Features Two lines of the Hull indicator of different timeframes on the same chart. The HMA line of the higher timeframe defines the trend, and the HMA line of the current timeframe defines the short-term price movements. A graphical panel with HMA indicator data from all timeframes at the same time . If the HMA switched its direction on any timeframe, the panel displays a question or exclamation mark with a tex
SolarTrade Suite Financial Indicator: Jupiter Market Indicator - Your Reliable Guide in the World of Financial Markets! This is a trend indicator that uses special innovative and advanced algorithms to calculate its value, and also has an eye-pleasing design. It is very easy to understand the readings of this indicator: blue color - buy, red - sell. Check out our other products from the SolarTrade Suite series at the bottom of the description. Do you want to confidently navigate the world o
This indicator presents an alternative approach to identify Market Structure. The logic used is derived from learning material created by   DaveTeaches (on X) Upgrade v1.10: + add option to put protected high/low value to buffer (figure 11, 12) + add  Retracements  value to buffer when Show Retracements When quantifying Market Structure, it is common to use fractal highs and lows to identify "significant" swing pivots. When price closes through these pivots, we may identify a Market Structure S
To download MT4 version please click here . - This is the exact conversion from TradingView: "Trend Direction Force Index - TDFI [wm]" By "causecelebre". - The screenshot shows similar results from tradingview and Metatrader when tested on ICMarkets on both platforms. - This indicator uses multiple levels of averaging to detect trend strength. - You can optimize filter low and filter high levels to achieve best results. - You have access to buffers to use in EAs. - This is a light-load processin
Wave Trend MT5
Diego Arribas Lopez
MT4 Version Wave Trend MT5 Wave Trend is an oscillator, which helps identifing in a extremely accurate manner market reversals. The Oscillator being obove the overbought level and a cross down of the fast into the slow MA usually indicates a good SELL signal. If the oscillators is below the oversold level and the fast MA crosses over the slower MA usually highlights a good BUY signal. The Wave Trend indicator can be also used when divergences appear against the price, indicating the current move
To get access to MT4 version please click here . - This is the exact conversion from TradingView: "Stochastic Momentum Index" By "UCSgears". - This is a popular version of stochastic oscillator on tradingview. - This is a light-load processing and non-repaint indicator. - Buffers are available for the lines on chart. - You can message in private chat for further changes you need. Thanks for downloading
Was: $249  Now: $149   Market Profile defines a number of day types that can help the trader to determine market behaviour. A key feature is the Value Area, representing the range of price action where 70% of trading took place. Understanding the Value Area can give traders valuable insight into market direction and establish the higher odds trade. It is an excellent addition to any system you may be using. Inspired by Jim Dalton’s book “Mind Over Markets”, this indicator is designed to suit the
Laguerre SuperTrend Clouds   adds an Adaptive Laguerre averaging algorithm and alerts to the widely popular SuperTrend indicator. As the name suggests,   Laguerre SuperTrend Clouds (LSC)   is a trending indicator which works best in trendy (not choppy) markets. The SuperTrend is an extremely popular indicator for intraday and daily trading, and can be used on any timeframe. Incorporating Laguerre's equation to this can facilitate more robust trend detection and smoother filters. The LSC uses the
Magic Finger can help you identify trends and trading opportunities clearly. The finger points to the open position signal, and the discoloration line is confirmed by the trend. If you are a day trader, you can choose to trade during a period of active trading, referring to the discoloration line as the basis for the next order, finger signal as a filter. If you are a trend trader, you can choose a period above H1, wait for the appearance of the finger signal in the key price area, and enter th
This is an MTF indicator of support and resistance levels based on Advanced ZigZag Dynamic and/or Extended Fractals indicator extremums with price labels (can be disabled). More higher TFs can be selected for MTF mode. By default, the levels are generated based on ZigZag indicator dots. Fractals indicator dots can also be used together with ZigZag or instead of it. In order to simplify the use and save CPU time, calculation is performed once per each bar at its opening. Parameters: ForcedTF - ch
Identify precise entry and exit points with AB=CD patterns This indicator finds AB=CD retracement patterns. The AB=CD Retracement pattern is a 4-point price structure where the initial price segment is partially retraced and followed by an equidistant move from the completion of the pullback, and is the basic foundation for all harmonic patterns. [ Installation Guide | Update Guide | Troubleshooting | FAQ | All Products ] Customizable pattern sizes Customizable AC and BD ratios Customizable b
Our   Basic Support and Resistance   indicator is the solution you need to boost your technical analysis. This indicator allows you to project support and resistance levels on the chart /   MT4 Version Features Integration of Fibonacci Levels:  With the option to display Fibonacci levels alongside support and resistance levels, our indicator gives you an even deeper insight into market behavior and possible reversal areas. Performance Optimization:  With the option to update extended lines onl
Welcome to the Ultimate Harmonic Patterns recognition indicator that is focused to detect advanced patterns. The Gartley pattern, Bat pattern, and Cypher pattern  are popular technical analysis tools used by traders to identify potential reversal points in the market. Our Ultimate Harmonic Patterns recognition Indicator is a powerful tool that uses advanced algorithms to scan the markets and identify these patterns in real-time. With our Ultimate Harmonic Patterns recognition Indicator, you ca
STRICTLY FOR BOOM INDEX ONLY!!!!! Here I bring the Maximum Trend Arrows OT1.0 MT5 indicator. This indicator is made up of a combination of different trend indicators for entries and exits, for entries an orange arrow will paint on the chart below the current market and a red flag for closing of trades and it produces buy arrows only. When the orange arrow appears, it will appear along with it's sound to notify you. The 1H timeframe is recommended, don't use it anywhere else than on the 1H timefr
Flow Bookmap
Thalles Nascimento De Carvalho
Flow Bookmap: Visualize Market Flow and Protect Your Trades ️ WANT TO MASTER THE MARKET WITH PRECISE INFORMATION ABOUT BUYERS AND SELLERS? Flow Bookmap is the ultimate tool for traders looking to understand market behavior in depth. It transforms order flow data into an intuitive interface on the MT5 chart, highlighting critical areas of interest for quick and secure decision-making. How It Works Flow Bookmap interprets the interaction between buyers and sellers in the market, highligh
Renko Gold
Ignacio Agustin Mene Franco
Renko Gold! clearly indicates the floors and ceilings where it goes from 4 lines, the line below that marks the floor in green confirming with the thinnest line clarifies the purchase entry, the same is for sale, the top line marks the ceiling and the thinnest red line marks the sale, This indicator works for all temporalities! For Forex and Synthetic Indices markets! It also works for crypto markets! Good profit! World Investor.
Fibonacci Auto
Makarii Gubaydullin
Automatically plots Fibo levels, based on the High & Low prices from the specified time frame Multiple bars   may be united: e.g. you can get a Fibo based on the 10-days Highs and Lows My   #1   Utility : 65+ features, including this indicator  |   Contact me  for any questions  |    MT4 version Helps to see potential reversal levels; Patterns formed at the Fibo levels tend to be stronger; Significantly   reduces   the   time   spent   on   manual  plotting ; Settings: Timeframe to calculate the
One of the number sequences is called "Forest Fire Sequence". It has been recognized as one of the most beautiful new sequences. Its main feature is that this sequence avoids linear trends, even the shortest ones. It is this property that formed the basis of this indicator. When analyzing a financial time series, this indicator tries to reject all possible trend options. And only if he fails, then he recognizes the presence of a trend and gives the appropriate signal. This approach allows one t
An indicator of patterns #24 and #26 ("Head and Shoulders") from Encyclopedia of Chart Patterns by Thomas N. Bulkowski. Parameters: Alerts - show alert when an arrow appears   Push - send a push notification when an arrow appears (requires configuration in the terminal) PeriodBars - indicator period K - an additional parameter that influences the accuracy of pattern shape recognition ArrowType - a symbol from 1 to 17 ArrowVShift - vertical shift of arrows in pixels   ShowLevels - show levels Col
Cumulative delta indicator As most traders believe, the price moves under the pressure of market buying or selling. When someone redeems an offer standing in the cup, the deal is a "buy". If someone pours into the bid standing in the cup - the deal goes with the direction of "sale". The delta is the difference between purchases and sales. A cumulative delta - the difference between the cumulative sum of purchases and sales for a certain period of time. It allows you to see who is currently contr
Buyers of this product also purchase
Golden Trend Indicator MT5
Noha Mohamed Fathy Younes Badr
4.88 (16)
Golden Trend indicator  is The best indicator for predicting trend movement this indicator never lags and never repaints and never back paints    and give  arrow buy and sell    before the candle appear  and it will help you and  will make your trading decisions clearer its work on all currencies and  gold and crypto and all time frame This unique  indicator uses very secret algorithms to catch the  trends, so you can trade using this indicator and see the trend clear on charts  manual guide and
CBT Quantum Maverick High-Efficiency Binary Trading System CBT Quantum Maverick is a finely tuned, high-performance binary options trading system designed for traders seeking precision, simplicity, and disciplined trading. No customization is required—this system is optimized for effective results right out of the box. Simply follow the signals, which can be mastered with a bit of practice. Key Features: Signal Precision: New-bar-based trading signals—targeting the next candle based on curren
Top indicator for MT5   providing accurate signals to enter a trade without repainting! It can be applied to any financial assets:   forex, cryptocurrencies, metals, stocks, indices .  Watch  the video  (6:22) with an example of processing only one signal that paid off the indicator! MT4 version is here It will provide pretty accurate trading signals and tell you when it's best to open a trade and close it. Most traders improve their trading results during the first trading week with the help of
Quantum TrendPulse
Bogdan Ion Puscasu
5 (13)
Introducing Quantum TrendPulse , the ultimate trading tool that combines the power of SuperTrend , RSI , and Stochastic into one comprehensive indicator to maximize your trading potential. Designed for traders who seek precision and efficiency, this indicator helps you identify market trends, momentum shifts, and optimal entry and exit points with confidence. Key Features: SuperTrend Integration: Easily follow the prevailing market trend and ride the wave of profitability. RSI Precision: Detect
TPSproTREND PrO MT5
Roman Podpora
4.69 (16)
TPSpro TREND PRO  - is a trend indicator that automatically analyzes the market and provides information about the trend and each of its changes, as well as giving signals for entering trades without redrawing! The indicator uses each candle, analyzing them separately. referring to different impulses - up or down impulse. Exact entry points into transactions for currencies, crypto, metals, stocks, indices!  ИНСТРУКЦИЯ RUS         INSTRUCTIONS  ENG       R ecommended to use with an indicator   -
TPSpro RFI Levels MT5
Roman Podpora
4.53 (19)
A key element in trading is zones or levels from which decisions to buy or sell a trading instrument are made. Despite attempts by major players to conceal their presence in the market, they inevitably leave traces. Our task was to learn how to identify these traces and interpret them correctly. ИНСТРУКЦИЯ RUS         INSTRUCTIONS  ENG         R ecommended to use with an indicator   -   TPSpro  TREND PRO -  Version MT4 Bonus: 6 months of  "RFI SIGNALS"  subscription with your purchase! Main
Bill Williams Advanced
Siarhei Vashchylka
5 (9)
Bill Williams Advanced is designed for automatic chart analysis using Bill Williams' "Profitunity" system. The indicator analyzes four timeframes at once. Manual (Be sure to read before purchasing) Advantages 1. Automatically analyzes the chart using the "Profitunity" system of Bill Williams. The found signals are placed in a table in the corner of the screen. 2. Equipped with a trend filter based on the Alligator indicator. Most of the system signals are recommended to be used only according t
Introducing   Quantum Breakout PRO , the groundbreaking MQL5 Indicator that's transforming the way you trade Breakout Zones! Developed by a team of experienced traders with trading experience of over 13 years,   Quantum Breakout PRO   is designed to propel your trading journey to new heights with its innovative and dynamic breakout zone strategy. Quantum Breakout Indicator will give you signal arrows on breakout zones with 5 profit target zones and stop loss suggestion based on the breakout b
RelicusRoad Pro MT5
Relicus LLC
4.78 (18)
How many times have you bought a trading indicator with great back-tests, live account performance proof with fantastic numbers and stats all over the place but after using it, you end up blowing your account? You shouldn't trust a signal by itself, you need to know why it appeared in the first place, and that's what RelicusRoad Pro does best! User Manual + Strategies + Training Videos + Private Group with VIP Access + Mobile Version Available A New Way To Look At The Market RelicusRoad is th
FxaccurateLS
Shiv Raj Kumawat
WHY IS OUR FXACCCURATE LS MT5 THE PROFITABLE ? PROTECT YOUR CAPITAL WITH RISK MANAGEMENT Gives entry, stop and target levels from time to time. It finds Trading opportunities by analyzing what the price is doing during established trends. POWERFUL INDICATOR FOR A RELIABLE STRATEGIES We have made these indicators with a lot of years of hard work. It is made at a very advanced level. Established trends provide dozens of trading opportunities, but most trend indicators completely ignore them! The
Gann Squares Indicator: Analyzing Markets with Geometric Patterns The Gann Squares indicator is a powerful tool for market analysis that draws upon the mathematical concepts introduced by W.D. Gann in his article on "Mathematical Formula for Market Predictions." This indicator incorporates Gann's techniques involving square numbers such as 144, 90, and 52, as well as the Square of 9. Additionally, it incorporates  method for utilizing the Square of 9 in conjunction with channels and the star pa
BookMap HeatMap
Roberto Spadim
1 (2)
This Indicator creates a heatmap based on depth of market of the current symbol or another symbol. Other symbol is useful when you trade futures market and a contract has 'mini' and 'full' split. For example, in Brazil (B3 - BMF&Bovespa), WDO and DOL are future Forex contract of BRL/USD (where 1 DOL = 5 WDO) and big banks work mostly with DOL (where liquidity is important). Please use with M1 timeframe , objects are too small to be displayed at higher timeframes (MT5 limit). The number of level
Berma Bands
Muhammad Elbermawi
5 (3)
The Berma Bands (BBs) indicator is a valuable tool for traders seeking to identify and capitalize on market trends. By analyzing the relationship between the price and the BBs, traders can discern whether a market is in a trending or ranging phase. Visit the [ Berma Home Blog ] to know more. Berma Bands are composed of three distinct lines: the Upper Berma Band, the Middle Berma Band, and the Lower Berma Band. These lines are plotted around the price, creating a visual representation of the pric
Royal Scalping Indicator M5
Vahidreza Heidar Gholami
5 (6)
Royal Scalping Indicator is an advanced price adaptive indicator designed to generate high-quality trading signals. Built-in multi-timeframe and multi-currency capabilities make it even more powerful to have configurations based on different symbols and timeframes. This indicator is perfect for scalp trades as well as swing trades. Royal Scalping is not just an indicator, but a trading strategy itself. Features Price Adaptive Trend Detector Algorithm Multi-Timeframe and Multi-Currency Trend Low
CONTACT US  after purchase to get the Indicator Manual. Try Now—Limited 50% Discount for First 10 Buyers! Download the  Metatrader 4 Version Read the product description carefully before purchasing the product.  Due to regulatory restrictions, our service is unavailable in certain countries such as India, Pakistan, and Bangladesh. William Delbert Gann (W.D. Gann) was an exceptional market analyst, whose trading technique was based on a complex blend of mathematics, geometry, astrology, and anc
Advanced Supply Demand MT5
Bernhard Schweigert
4.5 (14)
Best Solution for any Newbie or Expert Trader! This indicator is a unique, high quality and affordable trading tool because we have incorporated a number of proprietary features and a new formula. With this update, you will be able to show double timeframe zones. You will not only be able to show a higher TF but to show both, the chart TF, PLUS the higher TF: SHOWING NESTED ZONES. All Supply Demand traders will love it. :) Important Information Revealed Maximize the potential of Advanced Supply
PZ Mean Reversion MT5
PZ TRADING SLU
3 (2)
Outperform traditional strategies: effective mean reversion for savvy traders Special Offer: Purchase now to receive free bonuses worth $90! (Read more for details) Unique indicator that implements a professional and quantitative approach to mean reversion trading. It capitalizes on the fact that the price diverts and returns to the mean in a predictable and measurable fashion, which allows for clear entry and exit rules that vastly outperform non-quantitative trading strategies. [ Installation
KT Renko Patterns MT5
KEENBASE SOFTWARE SOLUTIONS
KT Renko Patterns scans the Renko chart brick by brick to find some famous chart patterns that are frequently used by traders across the various financial markets. Compared to the time-based charts, patterns based trading is easier and more evident on Renko charts due to their uncluttered appearance. KT Renko Patterns features multiple Renko patterns, and many of these patterns are extensively explained in the book titled Profitable Trading with Renko Charts by Prashant Shah. A 100% automated
Golden Spikes Detector
Batsirayi L Marango
3.25 (4)
Golden Spikes Detector This indicator is based on an advanced strategy primarily for trading spikes on Boom and Crash Indices. Complex algorithms were implemented to detect high probability entries only. It alerts on potential Buy and Sell entries. To trade spikes on the Deriv or Binary broker, only take Buy Boom and Sell Cash alerts. It was optimised to be loaded on 5-minute timeframe although multiple timeframe analysis is done in the background. Features ·             Desktop pop up and sound
Volume Horizon is a horizontal volume indicator that allows you to observe the density of market participants' volumes across various price and time intervals. Volume histograms can be constructed based on ascending or descending market waves, as well as individual bars. This tool enables more precise determination of entry or exit points, relying on levels of maximum volumes or volume-weighted average prices (VWAP). What makes Volume Horizon unique? 1. Segmentation into ascending and descendi
Quantum Trend Sniper
Bogdan Ion Puscasu
4.73 (51)
Introducing   Quantum Trend Sniper Indicator , the groundbreaking MQL5 Indicator that's transforming the way you identify and trade trend reversals! Developed by a team of experienced traders with trading experience of over 13 years,   Quantum Trend Sniper Indicator   is designed to propel your trading journey to new heights with its innovative way of identifying trend reversals with extremely high accuracy. ***Buy Quantum Trend Sniper Indicator and you could get Quantum Breakout Indicator for
TPA True Price Action indicator reveals the true price action of the market makers through 100% non-repainting signals strictly at the close of a candle! TPA shows entries and re-entries, every time the bulls are definitely stronger than the bears and vice versa. Not to confuse with red/green candles. The shift of power gets confirmed at the earliest stage and is ONE exit strategy of several. There are available now two free parts of the TPA User Guide for our customers. The first "The Basics"
AT Forex Indicator MT5
Marzena Maria Szmit
5 (5)
The AT Forex Indicator MT5 is a sophisticated trading tool designed to provide traders with a comprehensive analysis of multiple currency pairs. This powerful indicator simplifies the complex nature of the forex market, making it accessible for both novice and experienced traders. AT Forex Indicator uses advanced algorithms to detect trends, patterns and is an essential tool for traders aiming to enhance their forex trading performance. With its robust features, ease of use, and reliable signal
Royal Wave Pro M5
Vahidreza Heidar Gholami
3.5 (4)
Royal Wave is a Trend-Power oscillator which has been programmed to locate and signal low-risk entry and exit zones. Its core algorithm statistically analyzes the market and generates trading signals for overbought, oversold and low volatile areas. By using a well-designed alerting system, this indicator makes it easier to make proper decisions regarding where to enter and where to exit trades. Features Trend-Power Algorithm Low risk Entry Zones and Exit Zones Predictions for Overbought and Over
Blahtech Supply Demand MT5
Blahtech Limited
4.54 (13)
Was: $299  Now: $149  Supply Demand uses previous price action to identify potential imbalances between buyers and sellers. The key is to identify the better odds zones, not just the untouched ones. Blahtech Supply Demand indicator delivers functionality previously unavailable on any trading platform. This 4-in-1 indicator not only highlights the higher probability zones using a multi-criteria strength engine, but also combines it with multi-timeframe trend analysis, previously confirmed swings
TrendMaestro5
Stefano Frisetti
note: this indicator is for METATRADER4, if you want the version for METATRADER5 this is the link:  https://www.mql5.com/it/market/product/108106 TRENDMAESTRO ver 2.4 TRENDMAESTRO recognizes a new TREND in the bud, he never makes mistakes. The certainty of identifying a new TREND is priceless. DESCRIPTION TRENDMAESTRO identifies a new TREND in the bud, this indicator examines the volatility, volumes and momentum to identify the moment in which there is an explosion of one or more of these data a
Trade smarter, not harder: Empower your trading with Harmonacci Patterns Special Offer: Purchase now to receive free bonuses worth $165! (Read more for details) This is arguably the most complete harmonic price formation auto-recognition indicator you can find for the MetaTrader Platform. It detects 19 different patterns, takes fibonacci projections as seriously as you do, displays the Potential Reversal Zone (PRZ) and finds suitable stop-loss and take-profit levels. [ Installation Guide | Upd
Trend Forecaster
Alexey Minkov
5 (6)
!SPECIAL SALE!  The Trend Forecaster indicator utilizes a unique proprietary algorithm to determine entry points for a breakout trading strategy. The indicator identifies price clusters, analyzes price movement near levels, and provides a signal when the price breaks through a level. The Trend Forecaster indicator is suitable for all financial assets, including currencies (Forex), metals, stocks, indices, and cryptocurrencies. You can also adjust the indicator to work on any time frames, althoug
MetaForecast M5
Vahidreza Heidar Gholami
5 (2)
MetaForecast predicts and visualizes the future of any market using different powerful methods. While financial markets are not always predictable, if there are patterns in the past data, MetaForecast can learn and predict the future as accurately as possible. It features a complete implementation of neural networks embedded directly into the indicator, enabling traders to create and train AI models using data from multiple symbols to learn complex patterns. MetaForecast leverages your computer'
The indicator shows in one window the trend direction from multiple timeframes. If the trend from several timeframes coincides - arrows are drawn. You can also switch to the histogram, indicating the trend on the current timeframe. The indicator draws entry points and approximate exit points on the chart. Warning: since the indicator is multi-timeframe, when using in the strategy tester, quotes for all necessary timeframes should be downloaded in advance. In order not to wait for a long downlo
More from author
The Trend Catcher: The Trend Catcher Strategy with Alert Indicator is a versatile technical analysis tool that aids traders in identifying market trends and potential entry and exit points. It features a dynamic Trend Catcher Strategy , adapting to market conditions for a clear visual representation of trend direction. Traders can customize parameters to align with their preferences and risk tolerance. The indicator assists in trend identification, signals potential reversals, serves as a trail
FREE
The Support and Resistance Levels Finder: The Support and Resistance Levels Finder is an advanced tool designed to enhance technical analysis in trading. Featuring dynamic support and resistance levels, it adapts in real-time as new key points unfold on the chart, providing a dynamic and responsive analysis. Its unique multi-timeframe capability allows users to display support and resistance levels from different timeframes on any desired timeframe, offering a nuanced perspective, such as showi
FREE
First of all Its worth emphasizing here that this Trading Tool is Non Repainting , Non Redrawing and Non Lagging Indicator , Which makes it ideal for professional trading . Online course, user manual and demo. The Smart Price Action Concepts Indicator is a very powerful tool for both new and experienced traders . It packs more than 20 useful indicators into one , combining advanced trading ideas like Inner Circle Trader Analysis and Smart Money Concepts Trading Strategies . This indicator focus
The Trade Position and Back-testing Tool: The "Trade Position and Backtesting Tool" aka "Risk Reward Ratio Tool" is a comprehensive and innovative indicator designed to enhance your technical analysis and trading strategies. The Risk Tool is a comprehensive and user-friendly solution for effective risk management in forex trading. With the ability to preview trade positions, including entry price, stop-loss (SL), and take-profit (TP) levels, it offers a transparent view of upcoming trades. The
FREE
The Trading Sessions Time Indicator: The "Trading Sessions Time Indicator" is a powerful technical analysis tool designed to enhance your understanding of different trading sessions in the forex market. This seamlessly integrated indicator provides crucial information about the opening and closing times of major sessions, including Tokyo, London, and New York. With automatic time zone adjustment, it caters to traders globally, helping them optimize their trading schedules for high liquidity per
FREE
First of all Its worth emphasizing here that this Trading System is Non-Repainting   , Non Redrawing and Non Lagging Indicator Which makes it ideal from both manual and robot trading .  Online course, manual and download presets. The Smart Trend Trading System MT5 is a comprehensive trading solution tailored for new and experienced traders . It combines over 10 premium indicators and features more than 7 robust trading strategies , making it a versatile choice for diverse market conditions . Tre
The Support and Resistance Levels Finder: The Support and Resistance Levels Finder is an advanced tool designed to enhance technical analysis in trading. Featuring dynamic support and resistance levels, it adapts in real-time as new key points unfold on the chart, providing a dynamic and responsive analysis. Its unique multi-timeframe capability allows users to display support and resistance levels from different timeframes on any desired timeframe, offering a nuanced perspective, such as showi
FREE
The Trading Sessions Time Indicator: The "Trading Sessions Time Indicator" is a powerful technical analysis tool designed to enhance your understanding of different trading sessions in the forex market. This seamlessly integrated indicator provides crucial information about the opening and closing times of major sessions, including Tokyo, London, and New York. With automatic time zone adjustment, it caters to traders globally, helping them optimize their trading schedules for high liquidity per
FREE
The Trade Position and Back-testing Tool: The "Trade Position and Backtesting Tool" aka "Risk Reward Ratio Tool" is a comprehensive and innovative indicator designed to enhance your technical analysis and trading strategies. The Risk Tool is a comprehensive and user-friendly solution for effective risk management in forex trading. With the ability to preview trade positions, including entry price, stop-loss (SL), and take-profit (TP) levels, it offers a transparent view of upcoming trades. Th
FREE
Description:  For a comprehensive understanding of our indicators, we invite you to explore the entire Q&A section within this MQL5 blog post   here . The "VWAP Indicator Strategy" is a cutting-edge technical analysis tool designed to provide traders with a competitive advantage in the financial markets. By incorporating the Volume Weighted Average Price (VWAP) indicator, this tool offers valuable insights into market trends, price levels, and potential turning points. Understanding the VWAP Ind
Get FREE Advanced Online Course and Learn About Our Advanced Trading System, Link in the Bio!  Click Here.  Our Mission and Vision:   Why Am I Even Here?    Here is The Deal Brother, We Offer:Premium Quality Indicators: The Highest Quality Possible Algorithms. Unlimited Activations: Can be used on Unlimited number of Computers, MT4s and MT5s for lifetime. Inexpensive Prices: 30$ is the lowest price possible, Knowing that more than 50% of our Indicators are 100% FREE. But Why Am I telling You th
Description:  The "ABC Pattern Strategy With Fibonacci" Indicator is a sophisticated technical analysis tool meticulously designed to recognize and leverage the power of the ABC chart patterns in combination with Fibonacci levels. This cutting-edge strategy empowers traders to make well-informed decisions in the dynamic forex market. By making spotting ABC patterns on price charts an easy task, the indicator offers insights into potential trend reversals or continuations. It seamlessly incorpora
Get FREE Advanced Online Course and Learn About Our Advanced Trading System, Link in the Bio!  Click Here.  Our Mission and Vision:   Why Am I Even Here? Here is The Deal Brother, We Offer:Premium Quality Indicators: The Highest Quality Possible Algorithms. Unlimited Activations: Can be used on Unlimited number of Computers, MT4s and MT5s for lifetime. Inexpensive Prices: 30$ is the lowest price possible, Knowing that more than 50% of our Indicators are 100% FREE. But Why Am I telling You this?
Description:  For a comprehensive understanding of our indicators, we invite you to explore the entire Q&A section within this MQL5 blog post   here . The "Moving Average Lines Crossover with Alert" is a valuable technical analysis tool designed to help traders identify potential trend reversals and trading opportunities. Seamlessly integrated into your trading platform, this indicator empowers you with essential data to make well-informed trading decisions. Spot Trend Reversals: Utilize the pow
FREE
Price Alert Panel MT4
Issam Kassas
4.75 (12)
Get FREE Advanced Online Course and Learn About Our Advanced Trading System, Link in the Bio!  Click Here.  Our Mission and Vision: Why Am I Even Here?Here is The Deal Brother, We Offer: Premium Quality Indicators: The Highest Quality Possible Algorithms. Unlimited Activations: Can be used on Unlimited number of Computers, MT4s and MT5s for lifetime. Inexpensive Prices: 30$ is the lowest price possible, Knowing that more than 50% of our Indicators are 100% FREE. But Why Am I telling You this?
FREE
Description:  For a comprehensive understanding of our indicators, we invite you to explore the entire Q&A section within this MQL5 blog post   here . The "Show TP and SL Values" Indicator is a valuable technical analysis tool designed to enhance your trading experience by displaying the  (TP) and  (SL) levels directly on your chart. This simple yet effective tool provides traders with crucial information, allowing for better decision-making and risk management. Key Features: TP and SL Display:
FREE
Description:  The Range Breakout Catcher Indicator is a powerful tool known for its non-repainting, non-redrawing, and non-lagging capabilities, making it suitable for both manual and robot trading. This indicator utilizes a smart algorithm to calculate ranges and generate early signals for Buy and Sell positions at the breakout of these ranges, facilitating the capture of trends during ranging consolidations. The range calculation involves a comprehensive system based on various elements, prov
Description:  For a comprehensive understanding of our indicators, we invite you to explore the entire Q&A section within this MQL5 blog post   here . The Moving Average 5EMA Indicator is a valuable tool designed to provide comprehensive insights into market trends and potential entry and exit points. It incorporates five exponential moving average (EMA) lines, each representing the average price over different periods. This powerful combination offers a deeper understanding of price movements a
FREE
Description:  For a comprehensive understanding of our indicators, we invite you to explore the entire Q&A section within this MQL5 blog post   here . The "Live Account Statistics" Indicator is a powerful technical analysis tool that provides real-time insights into the performance of your trading account. With this indispensable tool, you can access crucial account statistics, such as balance, equity, drawdown, and more, allowing you to make data-driven trading decisions. Key Features: Real-Ti
FREE
Show TP and SL Values
Issam Kassas
4.56 (9)
Description:  For a comprehensive understanding of our indicators, we invite you to explore the entire Q&A section within this MQL5 blog post   here . The "Show TP and SL Values" Indicator is a valuable technical analysis tool designed to enhance your trading experience by displaying the  (TP) and  (SL) levels directly on your chart. This simple yet effective tool provides traders with crucial information, allowing for better decision-making and risk management. Key Features: TP and SL Display:
FREE
Description:  For a comprehensive understanding of our indicators, we invite you to explore the entire Q&A section within this MQL5 blog post   here . The "VWAP Indicator Strategy" is a cutting-edge technical analysis tool designed to provide traders with a competitive advantage in the financial markets. By incorporating the Volume Weighted Average Price (VWAP) indicator, this tool offers valuable insights into market trends, price levels, and potential turning points. Understanding the VWAP Ind
Description:  For a comprehensive understanding of our indicators, we invite you to explore the entire Q&A section within this MQL5 blog post   here . The "High Spread Alert" Indicator is a valuable tool for traders, providing real-time information about spread fluctuations in the forex market. As a technical analysis tool, it helps traders make informed decisions by alerting them to periods of high spread, which can impact trading conditions and execution. Key Features: Spread Monitoring: The
FREE
Description:  The "Trend Finder Multi Time Frames multi pairs" indicator is a new technical analysis tool designed to assist traders in identifying and confirming trends across multiple timeframes and multiple pairs at the same time. By combining the strengths of various timeframes, this indicator offers a comprehensive view of the market's direction, helping traders make more informed decisions. Features: Multi-Timeframe Analysis: The indicator analyzes trends on different timeframes (e.g., M1
Description:  For a comprehensive understanding of our indicators, we invite you to explore the entire Q&A section within this MQL5 blog post   here . The "High Spread Alert" Indicator is a valuable tool for traders, providing real-time information about spread fluctuations in the forex market. As a technical analysis tool, it helps traders make informed decisions by alerting them to periods of high spread, which can impact trading conditions and execution. Key Features: Spread Monitoring: The i
FREE
Description:  For a comprehensive understanding of our indicators, we invite you to explore the entire Q&A section within this MQL5 blog post   here . The "Currency Strength Meter Strategy" Indicator is a cutting-edge technical analysis tool that offers traders a unique perspective on the forex market. By analyzing the relative strength of different currencies, this indicator provides valuable insights into the market's dynamics, allowing traders to make informed decisions. Understanding Curren
Description:  For a comprehensive understanding of our indicators, we invite you to explore the entire Q&A section within this MQL5 blog post   here . The "Candlestick Pattern Finder with Alerts and Hide Button" is a sophisticated technical analysis tool designed to elevate your trading experience by identifying key candlestick patterns in the market. This powerful indicator offers valuable insights into price action, enabling you to make well-informed trading decisions. Unlock Candlestick Insi
Description:  For a comprehensive understanding of our indicators, we invite you to explore the entire Q&A section within this MQL5 blog post   here . The "MACD Crossover with Alert and Button" is a valuable technical analysis tool designed to help traders spot potential trend changes and trading opportunities in the market. This indicator provides essential insights into the market's momentum, enabling you to make well-informed trading decisions. Master the MACD Indicator: The Moving Average Co
Description:  For a comprehensive understanding of our indicators, we invite you to explore the entire Q&A section within this MQL5 blog post   here . The "Moving Average Lines Crossover with Alert" is a valuable technical analysis tool designed to help traders identify potential trend reversals and trading opportunities. Seamlessly integrated into your trading platform, this indicator empowers you with essential data to make well-informed trading decisions. Spot Trend Reversals: Utilize the po
Description:  For a comprehensive understanding of our indicators, we invite you to explore the entire Q&A section within this MQL5 blog post   here . The Moving Average Cross Price Alert Indicator is a technical tool designed to simplify your trading decisions. With a single moving average line, this indicator effectively identifies trend changes and potential trade opportunities. Its core function is to provide real-time alerts when the price crosses above or below the moving average line, sig
Description:  The "Trend Finder Multi Time Frames multi pairs" indicator is a new technical analysis tool designed to assist traders in identifying and confirming trends across multiple timeframes and multiple pairs at the same time. By combining the strengths of various timeframes, this indicator offers a comprehensive view of the market's direction, helping traders make more informed decisions. Features: Multi-Timeframe Analysis: The indicator analyzes trends on different timeframes (e.g., M1
Filter:
Suherdi St
274
Suherdi St 2025.01.24 07:19 
 

sangat membantu, untuk startegi support dan resisten

jacksoh01
47
jacksoh01 2024.09.10 23:21 
 

Why you haven't replied to me for so many days when you indicator got problum ? ? ?

krzys1973
426
krzys1973 2024.05.17 20:40 
 

User didn't leave any comment to the rating

Issam Kassas
355798
Reply from developer Issam Kassas 2024.05.19 13:09
So many people dont know the purpose of this Indicator! Pls guys watch the online course first.
This Indicator is a trading system dedicated for experienced traders who trade support and resistance strategies and who do technical analysis! This is indicator is packed with multiple indicators that can be used alone or mixed to create your own strategy! Please learn support and resistance strategies and price action.
nasar78613
135
nasar78613 2024.02.13 10:37 
 

Very good indicator for support and resistance but we have some issues this indicator not work below 15m timeframe please you can fix this and second candlestick accuracy is 60% please increase

Reply to review
Version 1.10 2023.11.09
- Fixed some bugs and optimized the performance.