• 概要
  • レビュー (4)
  • コメント (6)
  • 最新情報

Smart Support and Resistance Trading System MT5

3.67
まず最初に、このトレーディングシステムがリペイントされず、再描画されず、遅延しないことを強調する価値があります。これにより、プロのトレーディングに最適な状態になります。
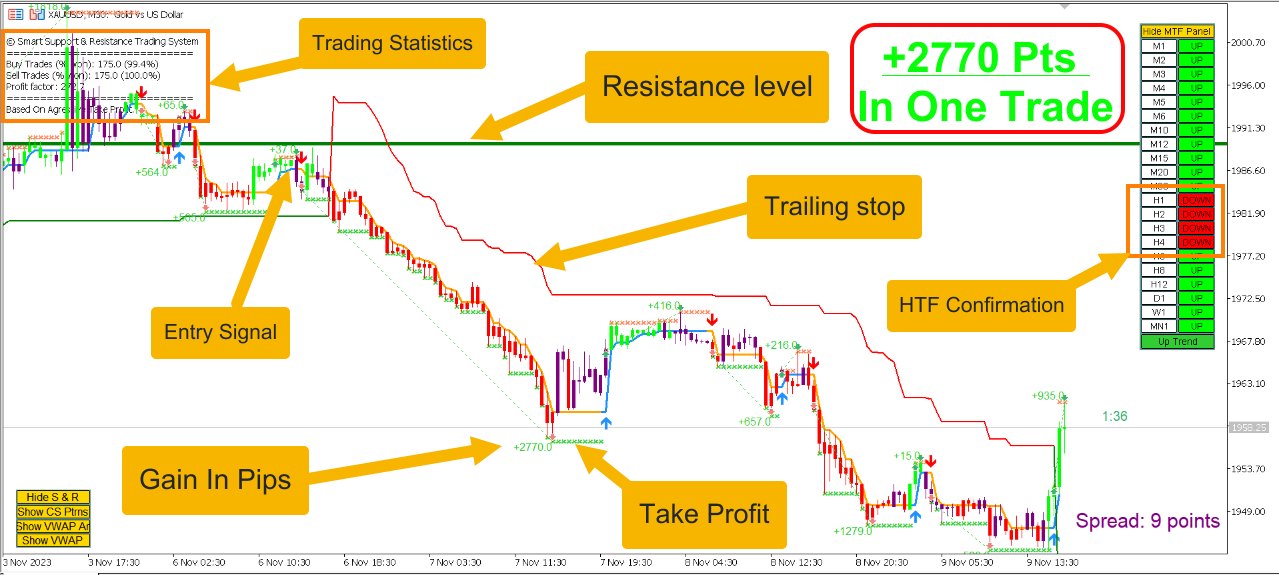
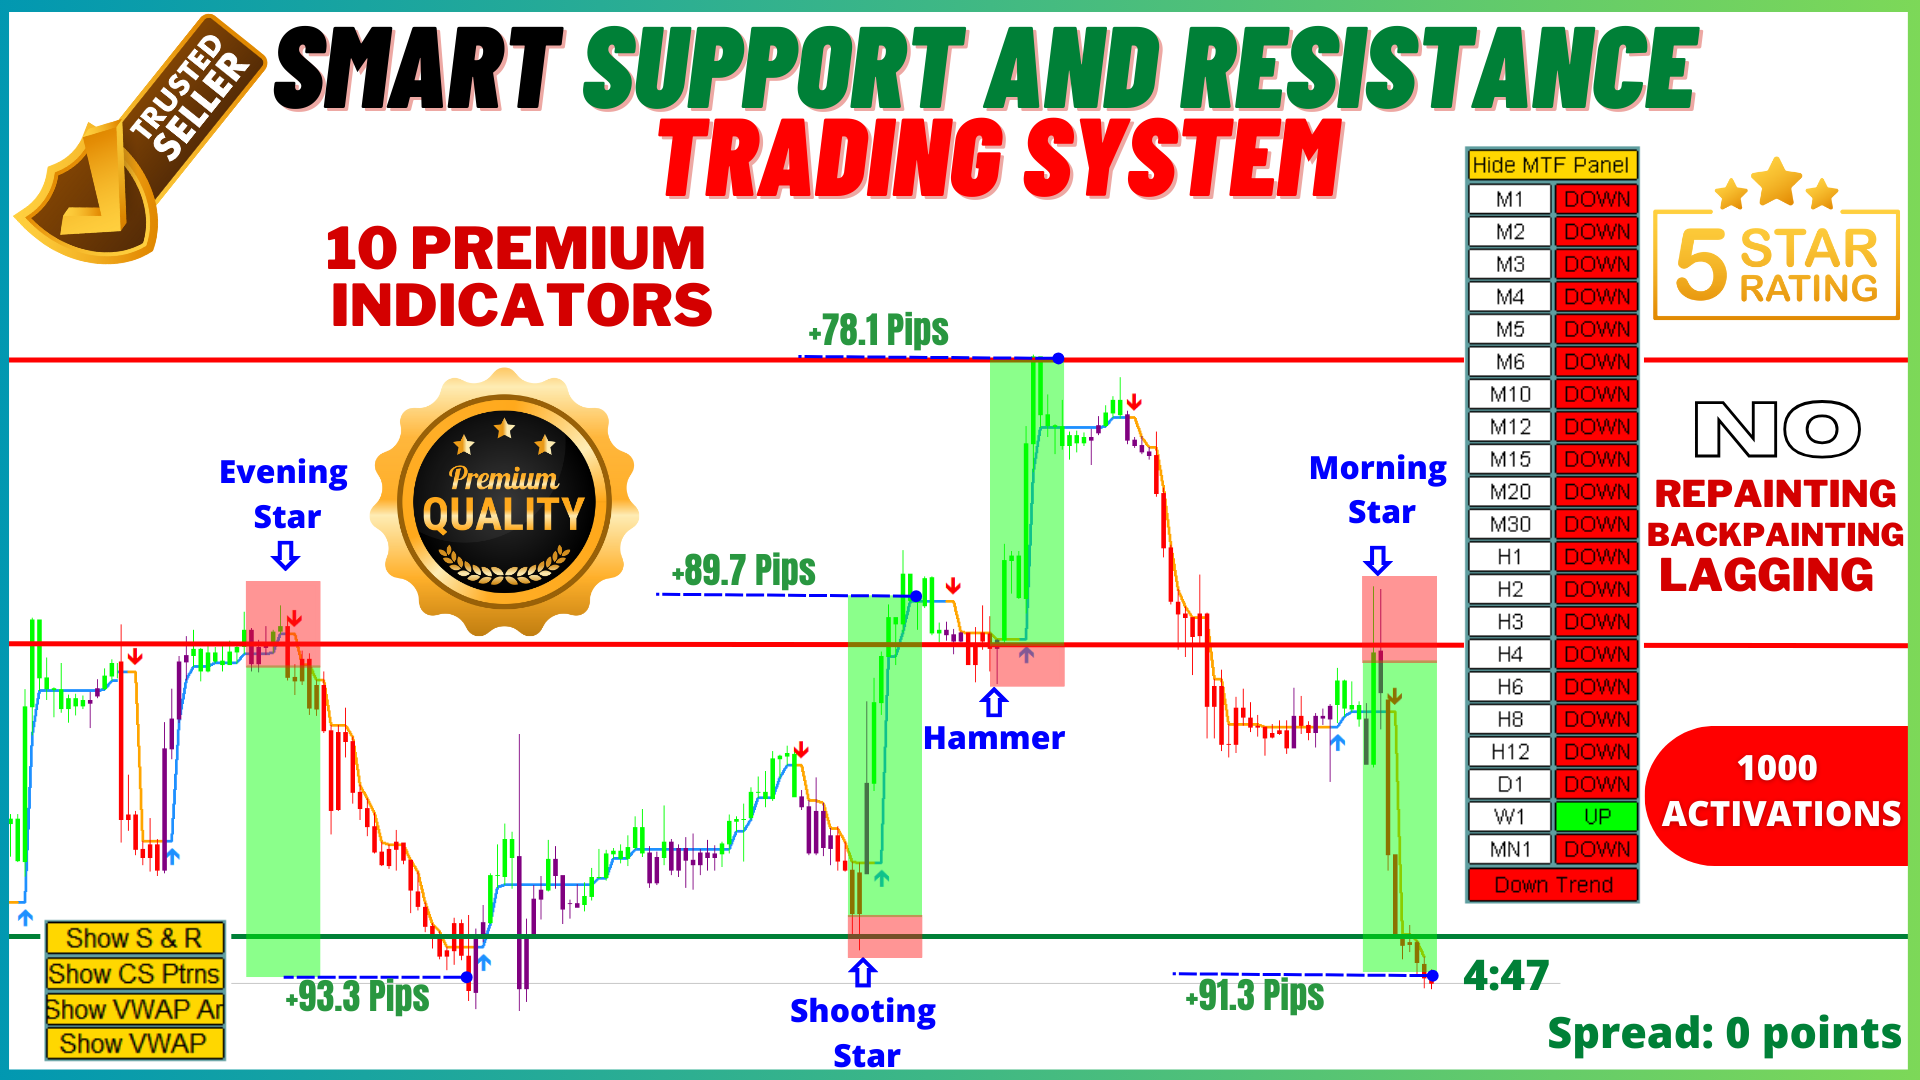
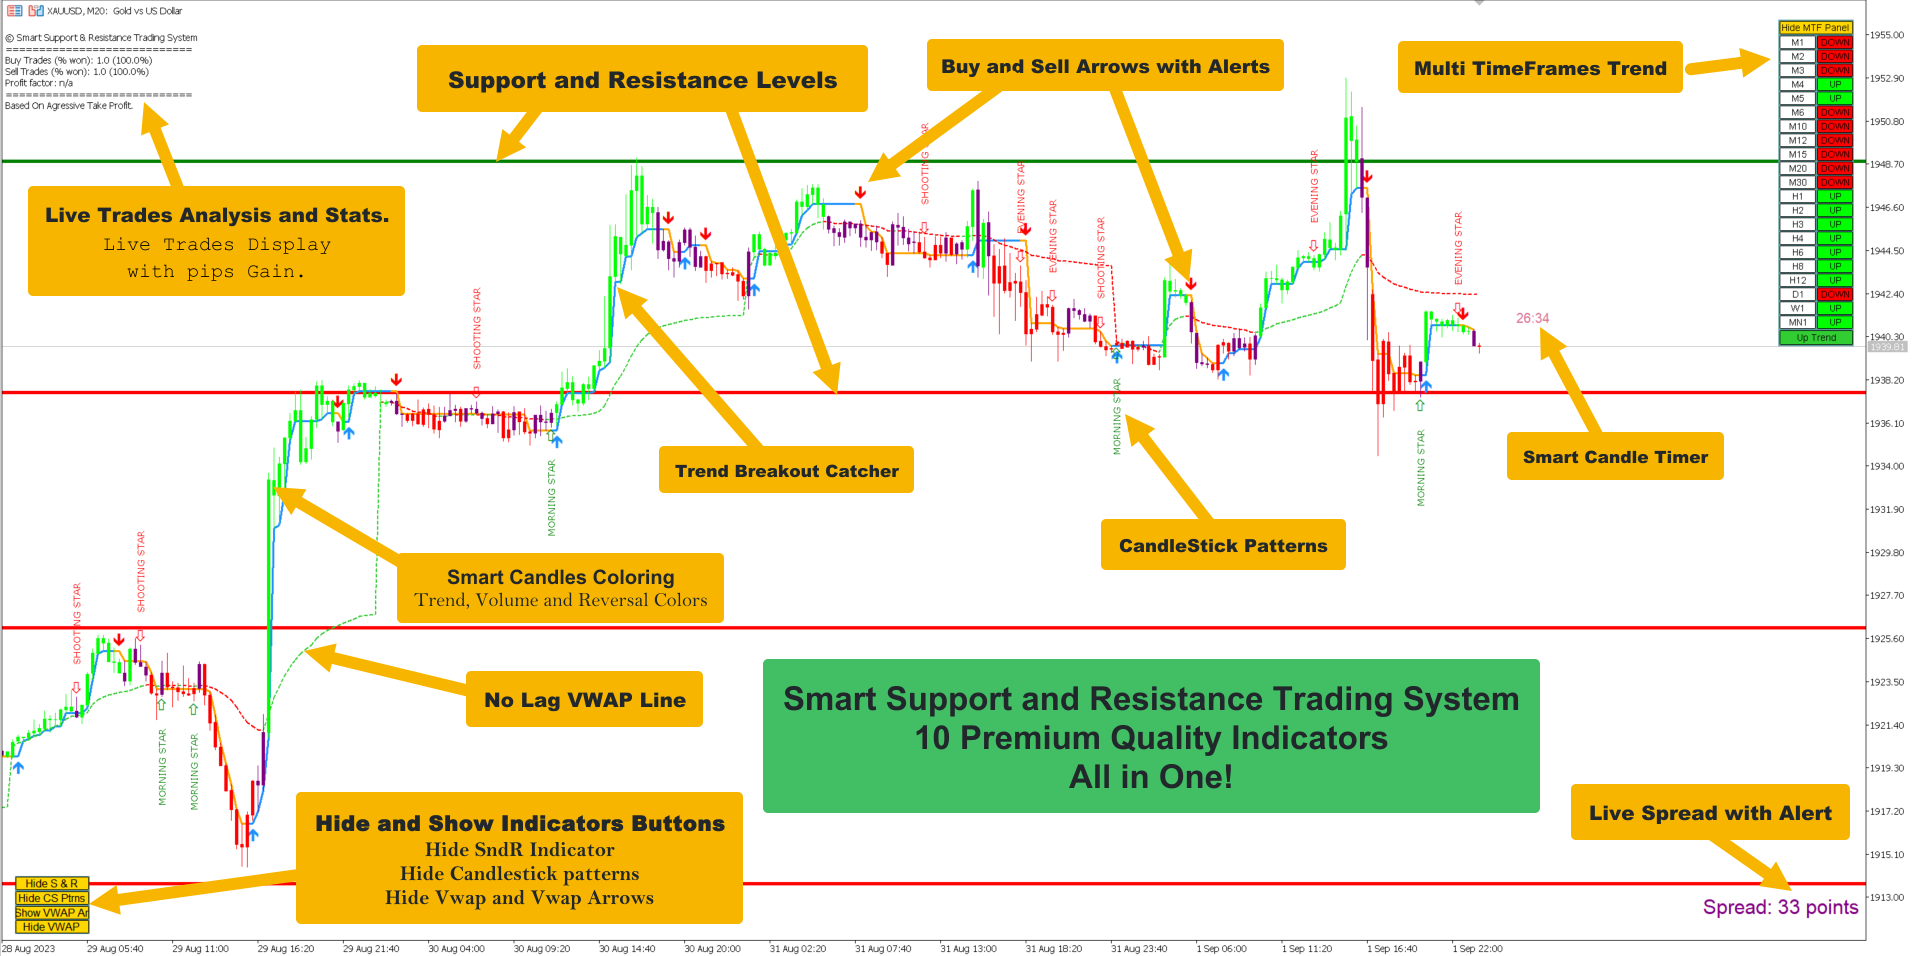
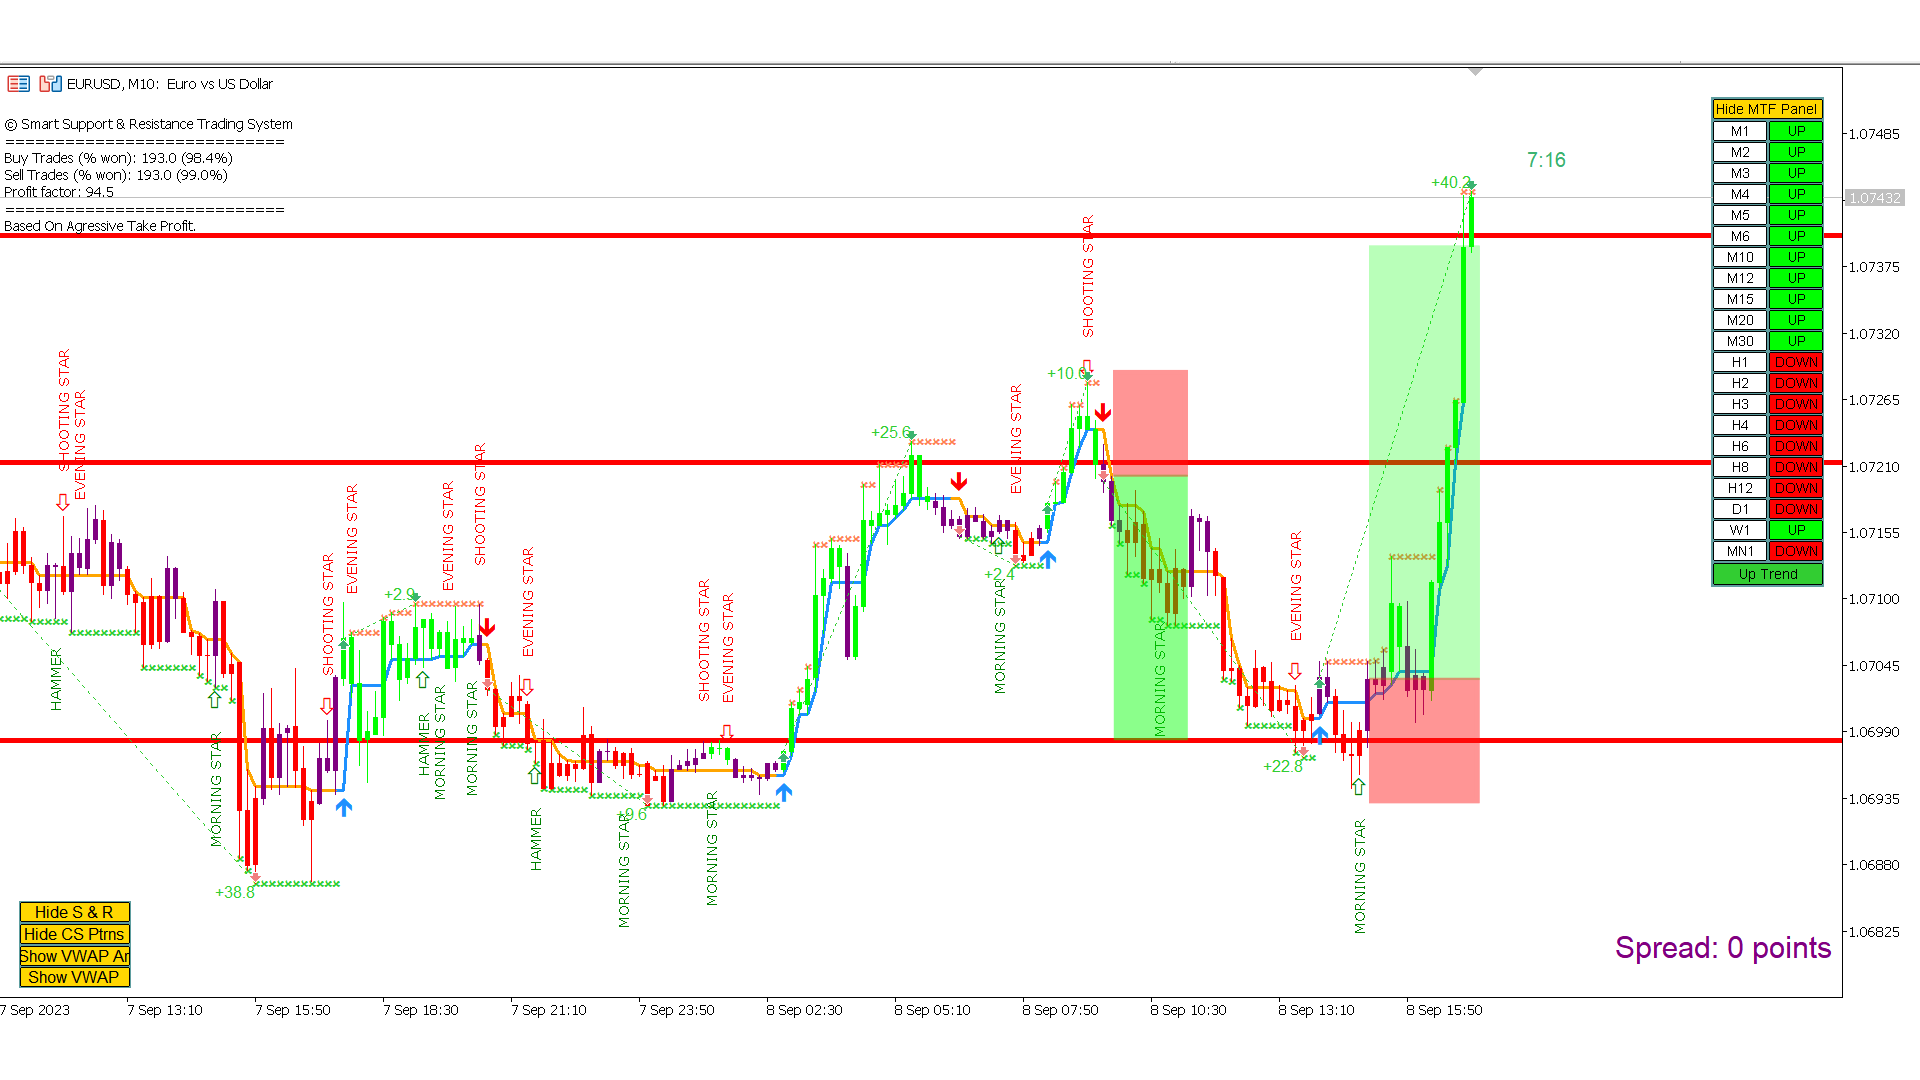
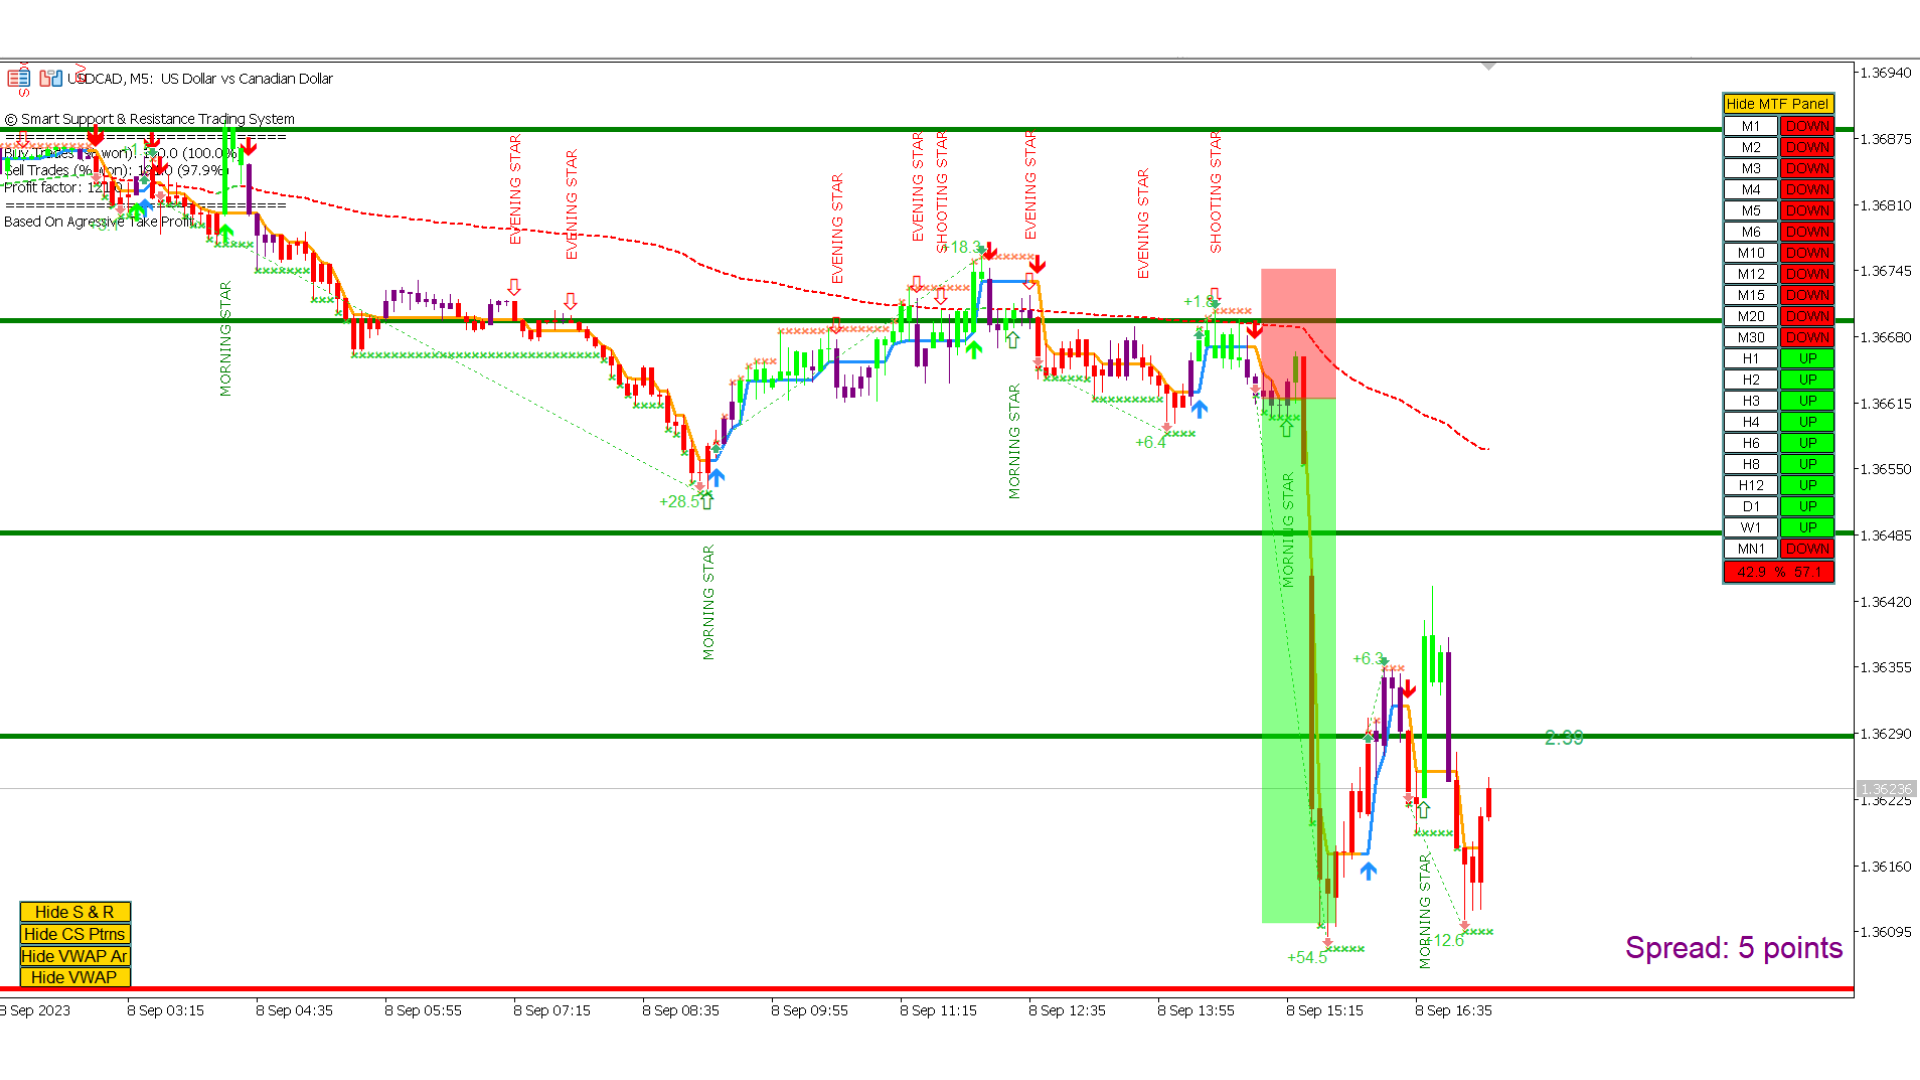
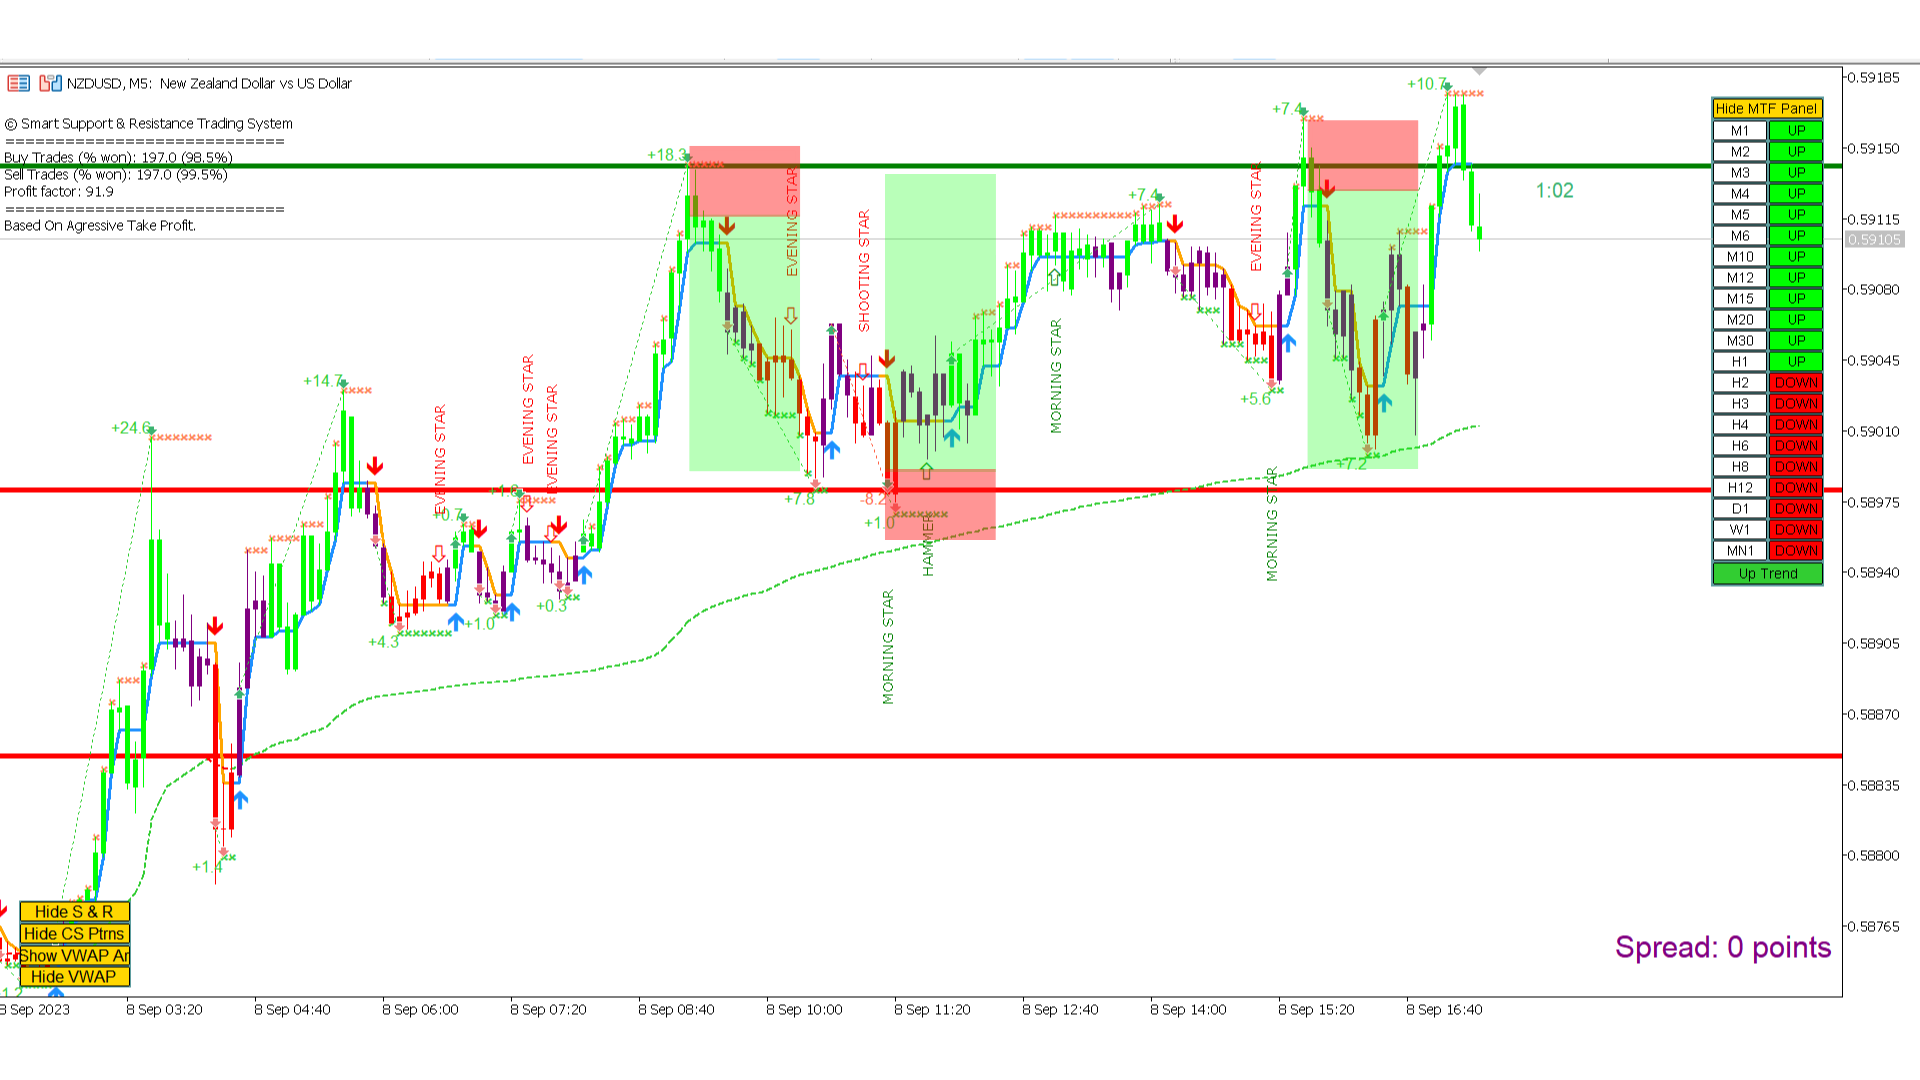
「スマートサポートアンドレジスタンストレーディングシステム」は、新規および経験豊富なトレーダー向けにカスタマイズされた高度なインジケーターです。この包括的なシステムは、7以上の戦略、10のインジケーター、およびデイトレード戦略、スイングトレード戦略、サポートおよびレジスタンス戦略、ローソク足パターン戦略、VWAP戦略、マルチタイムフレームトレンド戦略など、さまざまなトレーディングアプローチを組み合わせています。これは、矢印信号、エントリーポイント、出口ポイント、トレードアラート、より高い時間枠のトレンド分析、リアルタイムのトレードモニタリング、そして洞察力のあるトレンドとボリュームキャンドルの着色を提供します。自動的なサポートとレジスタンスの検出により、さまざまな市況下でトレーダーが的確な決定を下すのを支援する多面的なインジケーターとなっています。

スマートサポートアンドレジスタンストレーディングシステムは、一連のプレミアムでパワフルなインジケーターとツールを組み込んだ堅牢なテクニカル分析アプローチです。このシステムの核となるのは、ポテンシャルな市場のリバーサルまたは継続のための重要な支持と抵抗のレベルを識別することです。システムは、さまざまな時間枠で主要なトレンドの方向を評価するトレーダーの能力を高めるマルチタイムフレームトレンドパネルをシームレスに統合しています。さらに、ローソク足パターンディテクターは、価格チャートをローソク足パターンの重要なパターンをスキャンし、潜在的な市場の動きに関する貴重な洞察を提供します。さらに、VWAP(出来高加重平均価格)の導入により、トレーダーは市場のセンチメントや日中のトレンドを評価するのに役立ちます。

スマートサポートアンドレジスタンストレーディングシステムは、トレンドのブレイクアウトを識別し確認するトレンドブレイクアウトキャッチャーを提供し、トレーダーが適時にエントリーおよびエグジットを行うのを支援します。このシステムはまた、トレンドとボリュームキャンドルの着色を利用して、トレンドの強度とボリューム特性に基づいてローソク足を動的に着色することで視覚化を向上させます。トレーダーにリアルタイム情報を提供するため、システムにはアラート付きのライブスプレッドインジケーターが含まれており、市場条件の変化についてトレーダーに通知します。スマートキャンドルタイマーは、ローソク足の終了時刻を把握し、意思決定を支援します。

最後に、ライブトレード分析機能は、重要なトレード統計を直接チャートに印刷し、トレーダーがトレーディングパフォーマンスに関する実行可能な洞察を提供します。これらの高度なインジケーターとツールを統合することで、スマートサポートアンドレジスタンストレーディングシステムは、市場を効果的かつ自信を持ってナビゲートするトレーダーに包括的なソリューションを提供します。

特徴:

- リペイントしない、再描画されない、遅延しないインジケーター
- 7以上の戦略
- 10以上のインジケーターがすべて1つに
- デイトレード戦略およびスイングトレード戦略
- トレンドフォロー、リバーサル、スキャルピング戦略
- カスタム戦略
- プロップトレーディング会社の戦略
- エントリーポイントおよび出口ポイント、および矢印
- 電話やメールでのアラート
- マルチタイムフレーム分析
- 自動サポートおよびレジスタンス
- あらゆる種類のローソク足パターン
- リバーサルゾーン
- トレーリングストップ
- ボリューム、トレンド、リバーサルキャンドルの着色
- キャンドルタイマーおよびスプレッドリミットインジケーター
- ライブトレード分析


レビュー 4
Suherdi St
274
Suherdi St 2025.01.24 07:19 
 

sangat membantu, untuk startegi support dan resisten

nasar78613
135
nasar78613 2024.02.13 10:37 
 

Very good indicator for support and resistance but we have some issues this indicator not work below 15m timeframe please you can fix this and second candlestick accuracy is 60% please increase

おすすめのプロダクト
まず第一に、この取引ツールはノンリペイント、ノンリドロー、ノンラグの指標であり、プロの取引に理想的ですことを強調する価値があります。 オンラインコース、ユーザーマニュアル、デモ。 スマートプライスアクションコンセプトインジケーターは、新米から経験豊富なトレーダーまで、非常 に強力なツールです。Inner Circle Trader AnalysisやSmart Money Concepts Trading Strategiesなど、20以上の有用な指標を1つに組み合わせています。このインジケーターはスマートマネーコンセプトに焦点を当て、大手機関の取引方法を提供し、彼らの動きを予測するのに役立ちます。 特に、流動性分析に優れており、機関がどのように取引しているかを理解しやすくしています。市場のトレンドを予測し、価格の動きを慎重に分析するのに優れています。機関の戦略とトレードを合わせることで、市場の動向についてより正確な予測ができます。このインジケーターは多目的であり、市場構造を分析し、重要な注文ブロックを特定し、さまざまなパターンを認識するのに優れています。 このインジケーター
Noize Absorption Index - is the manual trading system that measures the difference of pressure between bears forces and bulls forces. Green line - is a noize free index that showing curent situation. Zero value of index shows totally choppy/flat market.Values above zero level shows how powerfull bullish wave is and values below zero measures bearish forces.Up arrow appears on bearish market when it's ready to reverse, dn arrow appears on weak bullish market, as a result of reverse expectation.
An indicator of pattern #31 ("Long Island") from Encyclopedia of Chart Patterns by Thomas N. Bulkowski. The second gap is in the opposite direction. Parameters: Alerts - show alert when an arrow appears   Push - send a push notification when an arrow appears (requires configuration in the terminal) GapSize - minimum gap size in points ArrowType - a symbol from 1 to 17 ArrowVShift - vertical shift of arrows in points   ShowLevels - show levels ColUp - color of an upward line ColDn - color of a d
The Penta-O is a 6-point retracement harmonacci pattern which usually precedes big market movements. Penta-O patterns can expand and repaint quite a bit. To make things easier this indicator implements a twist: it waits for a donchian breakout in the right direction before signaling the trade. The end result is an otherwise repainting indicator with a very reliable trading signal. The donchian breakout period is entered as an input. [ Installation Guide | Update Guide | Troubleshooting | FAQ | A
まず第一に、この取引インジケーターは再描画されず、再描画されず、遅延しないことを強調する価値があります。これにより、手動取引とロボット取引の両方に理想的なものになります。 ユーザーマニュアル:設定、入力、戦略。 アトミックアナリストは、価格の強さとモメンタムを利用して市場でより良いエッジを見つけるためのPA価格アクションインジケーターです。ノイズや誤ったシグナルを除去し、取引ポテンシャルを高めるための高度なフィルターを備えています。複雑なインジケーターの複数のレイヤーを使用して、アトミックアナリストはチャートをスキャンし、複雑な数学的計算をシンプルなシグナルと色に変換します。これにより、どのような初心者トレーダーでも理解して使用し、一貫した取引の決定を行うことができます。 「アトミックアナリスト」は、新規および経験豊富なトレーダー向けにカスタマイズされた包括的な取引ソリューションです。プレミアムインジケーターとトップノッチの機能を1つの取引戦略に組み合わせ、すべてのタイプのトレーダーにとって汎用性のある選択肢にします。 デイリートレーディングとスキャルピング戦略:高速で正確なデイ
Your Trend Friend
Luigi Nunes Labigalini
5 (1)
The trend is your friend! Look at the color of the indicator and trade on that direction. It does not  repaint. After each candle is closed, that's the color of the trend. You can focus on shorter faster trends or major trends, just test what's most suitable for the symbol and timeframe you trade. Simply change the "Length" parameter and the indicator will automatically adapt. You can also change the color, thickness and style of the lines. Download and give it a try! There are big movements w
Trading Utility for Forex Currency Pairs Only not for Gold  Functions Auto Lot Calculation based on Risk Auto stoploss  Auto TakeProfit Breakeven Auto Close Half % Close in percentage with respect to the PIPs Pending Orders BuyLimit Sell Limit with distances BuyStop Sell Stop    with distances Trading Informations Risk in percentage For Multiple trades Combine Takeprofit and Combine Stoplosses
MT4版  |  FAQ Owl Smart Levels Indicator は、 Bill Williams の高度なフラクタル、市場の正しい波構造を構築する Valable ZigZag、エントリの正確なレベルをマークする Fibonacci レベルなどの一般的な市場分析ツールを含む 1 つのインジケーター内の完全な取引システムです。 利益を得るために市場と場所に。 戦略の詳細な説明 インジケータを操作するための指示 顧問-取引助手 プライベートユーザーチャット ->購入後に私に書いて、私はプライベートチャットにあなたを追加し、あなたはそこにすべてのボーナスをダウンロードすることができます 力はシンプルさにあります! Owl Smart Levels 取引システムは非常に使いやすいので、専門家にも、市場を勉強し始めて自分で取引戦略を選択し始めたばかりの人にも適しています。 戦略と指標に秘密の数式や計算方法が隠されているわけではなく、すべての戦略指標は公開されています。 Owl Smart Levels を使用すると、取引を開始するためのシグナルをすばやく確認し、注文を出すための
Crash 1000 Scalping Indicator for the Crash 1000 Deriv Synthetic Index. Introduction The Crash 1000 Scalping Indicator is a specialized tool designed for the Crash 1000 index on the Deriv Synthetic market. This indicator is particularly useful for scalping on the M1 timeframe, helping traders to identify precise entry and exit points for buy positions. It is designed to be non-repainting, providing clear signals with audible alerts and push notifications, and is compatible with mobile devices th
プレミアムレベルは、正しい予測の精度が80%を超える独自の指標です。 この指標は、最高のトレーディングスペシャリストによって2か月以上テストされています。 あなたが他のどこにも見つけられない作者の指標! スクリーンショットから、このツールの正確さを自分で確認できます。 1は、1キャンドルの有効期限を持つバイナリーオプションの取引に最適です。 2はすべての通貨ペア、株式、商品、暗号通貨で機能します 手順: 赤い矢印が表示されたらすぐにダウントレードを開き、青い矢印が表示されたら閉じます。青い矢印の後に開くこともできます。 試してテストしてください!推奨設定はデフォルトです! 日足チャートで最高の精度を示します! インディケータは、2600 Pipsの収益性に対して、約10Pipsという非常に小さなマージンを使用します。
This is an advanced multi-timeframe version of the popular Hull Moving Average (HMA) Features Two lines of the Hull indicator of different timeframes on the same chart. The HMA line of the higher timeframe defines the trend, and the HMA line of the current timeframe defines the short-term price movements. A graphical panel with HMA indicator data from all timeframes at the same time . If the HMA switched its direction on any timeframe, the panel displays a question or exclamation mark with a tex
SolarTrade Suite 金融指標: Jupiter 市場指標 - 金融市場の世界で信頼できるガイド! これは、革新的で高度なアルゴリズムを使用して値を計算するトレンド指標であり、見た目にも美しいデザインです。 この指標の読みは非常に簡単に理解できます。青色は買い、赤色は売りです。 説明の下部にある SolarTrade Suite シリーズの他の製品をご覧ください。 投資と金融市場の世界を自信を持ってナビゲートしたいですか? SolarTrade Suite 金融指標: Jupiter 市場指標は、情報に基づいた投資決定を行い、利益を増やすのに役立つように設計された革新的なソフトウェアです。 SolarTrade Suite 金融指標: Jupiter 市場指標の利点: - 正確な予測: 当社の指標は、高度なアルゴリズムと分析方法を使用して、市場の動きを正確に予測します。 資産の売買に最適なタイミングに関するシグナルを受け取ります。 - ユーザーフレンドリーなインターフェース: 直感的なインターフェースにより、プログラムを簡単にマスターし、インストール後すぐに
This indicator presents an alternative approach to identify Market Structure. The logic used is derived from learning material created by   DaveTeaches (on X) Upgrade v1.10: + add option to put protected high/low value to buffer (figure 11, 12) + add  Retracements  value to buffer when Show Retracements When quantifying Market Structure, it is common to use fractal highs and lows to identify "significant" swing pivots. When price closes through these pivots, we may identify a Market Structure S
To download MT4 version please click here . - This is the exact conversion from TradingView: "Trend Direction Force Index - TDFI [wm]" By "causecelebre". - The screenshot shows similar results from tradingview and Metatrader when tested on ICMarkets on both platforms. - This indicator uses multiple levels of averaging to detect trend strength. - You can optimize filter low and filter high levels to achieve best results. - You have access to buffers to use in EAs. - This is a light-load processin
MT4 Version Wave Trend MT5 Wave Trend is an oscillator, which helps identifing in a extremely accurate manner market reversals. The Oscillator being obove the overbought level and a cross down of the fast into the slow MA usually indicates a good SELL signal. If the oscillators is below the oversold level and the fast MA crosses over the slower MA usually highlights a good BUY signal. The Wave Trend indicator can be also used when divergences appear against the price, indicating the current move
To get access to MT4 version please click here . - This is the exact conversion from TradingView: "Stochastic Momentum Index" By "UCSgears". - This is a popular version of stochastic oscillator on tradingview. - This is a light-load processing and non-repaint indicator. - Buffers are available for the lines on chart. - You can message in private chat for further changes you need. Thanks for downloading
Was: $249  Now: $149   Market Profile defines a number of day types that can help the trader to determine market behaviour. A key feature is the Value Area, representing the range of price action where 70% of trading took place. Understanding the Value Area can give traders valuable insight into market direction and establish the higher odds trade. It is an excellent addition to any system you may be using. Inspired by Jim Dalton’s book “Mind Over Markets”, this indicator is designed to suit the
Laguerre SuperTrend Clouds   adds an Adaptive Laguerre averaging algorithm and alerts to the widely popular SuperTrend indicator. As the name suggests,   Laguerre SuperTrend Clouds (LSC)   is a trending indicator which works best in trendy (not choppy) markets. The SuperTrend is an extremely popular indicator for intraday and daily trading, and can be used on any timeframe. Incorporating Laguerre's equation to this can facilitate more robust trend detection and smoother filters. The LSC uses the
Magic Finger can help you identify trends and trading opportunities clearly. The finger points to the open position signal, and the discoloration line is confirmed by the trend. If you are a day trader, you can choose to trade during a period of active trading, referring to the discoloration line as the basis for the next order, finger signal as a filter. If you are a trend trader, you can choose a period above H1, wait for the appearance of the finger signal in the key price area, and enter th
これは、価格ラベル付きのAdvanced ZigZagDynamic および/または ExtendedFractals インジケーターの極値に基づくサポートおよびレジスタンスレベルのMTFインジケーターです(無効にすることができます)。 MTFモードでは、より高いTFを選択できます。デフォルトでは、レベルはZigZagインジケータードットに基づいて生成されます。フラクタルインジケータードットは、ZigZagと一緒に、またはその代わりに使用することもできます。使用を簡素化し、CPU時間を節約するために、計算はバーの開口部ごとに1回実行されます。 パラメーター: ForcedTF-レベル計算のチャート時間枠(現在の時間枠と等しいか、それを超える場合があります) MinPipsLevelWidth-ポイント単位の最小レベル幅(非常にタイトなレベルに使用) Use ZigZag Extremums points -ZigZagピークを使用してサポート/抵抗レベルを計算することを有効/無効にします Fixed pips range -ジグザグインジケーターを計算するための最小値と最大値の間の距離
このインジケータは、AB = CDリトレースメントパターンを検出します。 AB = CDリトレースメントパターンは、初期価格セグメントが部分的にリトレースされ、プルバックの完了から等距離の動きが続く4ポイントの価格構造であり、すべての調和パターンの基本的な基盤です。 [ インストールガイド | 更新ガイド | トラブルシューティング | よくある質問 | すべての製品 ] カスタマイズ可能なパターンサイズ カスタマイズ可能なACおよびBD比率 カスタマイズ可能なブレイクアウト期間 カスタマイズ可能な線、色、サイズ CD fiboレベルに基づいてSLおよびTPレベルを表示します パターンとブレイクアウトの視覚/音声/プッシュ/メールアラート AB = CDリトレースメントは、かなり拡大して再描画できます。物事を簡単にするために、このインディケーターはひねりを実装します。トレードをシグナルする前に、正しい方向へのドンチャンブレイクアウトを待ちます。最終結果は、非常に信頼性の高い取引シグナルを備えた再描画インジケーターです。ドンチャンのブレイクアウト期間が入力として入力されます。 強
Basic Support and Resistance   インジケータは、テクニカル分析を強化するために必要なソリューションです。このインジケータを使用すると、チャートにサポートレベルとレジスタンスレベルを投影できます/ mt4バージョン 機能 フィボナッチレベルの統合: サポートと抵抗レベルとともにフィボナッチレベルを表示するオプションを使用すると、私たちの指標は市場行動と逆転領域の可能性についてさらに深い洞察を提供します。 パフォーマンスの最適化: 各バーの開口部のみで拡張ラインを更新するオプションを使用すると、インジケータは、サポートレベルと抵抗レベルの精度を犠牲にすることなく最適なパフォーマンスを保証します。 入力 メイン設定 Timeframe:  この入力を通じて、より高い時間枠のサポートラインとレジスタンスラインをチャート上に表示することを選択できます。 Support/Resistance Strength [Number of Bars]:   この入力を使用して、サポートと抵抗の強度を決定できます。数が高いほど、サポート/抵抗がより強くなります。 Pric
Welcome to the Ultimate Harmonic Patterns recognition indicator that is focused to detect advanced patterns. The Gartley pattern, Bat pattern, and Cypher pattern  are popular technical analysis tools used by traders to identify potential reversal points in the market. Our Ultimate Harmonic Patterns recognition Indicator is a powerful tool that uses advanced algorithms to scan the markets and identify these patterns in real-time. With our Ultimate Harmonic Patterns recognition Indicator, you ca
STRICTLY FOR BOOM INDEX ONLY!!!!! Here I bring the Maximum Trend Arrows OT1.0 MT5 indicator. This indicator is made up of a combination of different trend indicators for entries and exits, for entries an orange arrow will paint on the chart below the current market and a red flag for closing of trades and it produces buy arrows only. When the orange arrow appears, it will appear along with it's sound to notify you. The 1H timeframe is recommended, don't use it anywhere else than on the 1H timefr
Flow Bookmap
Thalles Nascimento De Carvalho
Flow Bookmap: 市場のフローを視覚化し、あなたの取引を守る ️ 買い手と売り手に関する正確な情報で市場を支配したいですか? Flow Bookmapは、市場の動向を深く理解したいトレーダーのための究極のツールです。注文フローのデータをMT5チャートの直感的なインターフェースに変換し、迅速で安全な意思決定のために重要な関心領域を強調表示します。 仕組み Flow Bookmapは、市場での買い手と売り手の相互作用を解釈し、重要な不均衡(imbalances)を強調表示します: 買い手が支配的な場合、売り手がより有利な条件で価格を調整できるため、価格は下がる傾向があります。 売り手が支配的な場合、価格は反対の論理で上昇する傾向があります。 さらに、このインジケーターはリアルタイムでデータを収集しながら、グラフに直接情報をプロットします。つまり、インジケーターは計算が終了するにつれて、不均衡ゾーンや買い手と売り手の相互作用を構築し、発生している市場の状態を動的かつ正確に視覚化します。大きな関心を持つ価格帯は、グラフ上の防御ゾーンとして機能し、取引を保護します。
Renko Gold
Ignacio Agustin Mene Franco
Renko Gold! clearly indicates the floors and ceilings where it goes from 4 lines, the line below that marks the floor in green confirming with the thinnest line clarifies the purchase entry, the same is for sale, the top line marks the ceiling and the thinnest red line marks the sale, This indicator works for all temporalities! For Forex and Synthetic Indices markets! It also works for crypto markets! Good profit! World Investor.
Automatically plots Fibo levels, based on the High & Low prices from the specified time frame Multiple bars   may be united: e.g. you can get a Fibo based on the 10-days Highs and Lows My   #1   Utility : 65+ features, including this indicator  |   Contact me  for any questions  |    MT4 version Helps to see potential reversal levels; Patterns formed at the Fibo levels tend to be stronger; Significantly   reduces   the   time   spent   on   manual  plotting ; Settings: Timeframe to calculate the
数列の一つに「森林火災数列」があります。これは、最も美しい新しいシーケンスの 1 つとして認識されています。その主な特徴は、このシーケンスが線形トレンドを回避することです。最短のものであってもです。この指標の基礎を形成したのはこのプロパティです。 財務時系列を分析する場合、この指標は可能なすべての傾向オプションを拒否しようとします。そして失敗した場合にのみ、トレンドの存在を認識し、適切なシグナルを発します。このアプローチにより、新しいトレンドの始まりの瞬間を正しく判断できます。ただし、偽陽性の可能性もあります。それらの数を減らすために、このインジケーターに追加のフィルターが追加されました。新しいバーが開くとシグナルが生成されます。いずれの場合も再描画は発生しません。 指標パラメータ: Applied Price   - 適用価格定数; Period Main   - インディケータのメイン期間、その有効な値は 5 ~ 60 です。 Period Additional   - 追加の期間。このパラメーターの有効な値は 5 ~ 40 です。 Signal Filter   - 追加の信号
An indicator of patterns #24 and #26 ("Head and Shoulders") from Encyclopedia of Chart Patterns by Thomas N. Bulkowski. Parameters: Alerts - show alert when an arrow appears   Push - send a push notification when an arrow appears (requires configuration in the terminal) PeriodBars - indicator period K - an additional parameter that influences the accuracy of pattern shape recognition ArrowType - a symbol from 1 to 17 ArrowVShift - vertical shift of arrows in pixels   ShowLevels - show levels Col
Cumulative delta indicator As most traders believe, the price moves under the pressure of market buying or selling. When someone redeems an offer standing in the cup, the deal is a "buy". If someone pours into the bid standing in the cup - the deal goes with the direction of "sale". The delta is the difference between purchases and sales. A cumulative delta - the difference between the cumulative sum of purchases and sales for a certain period of time. It allows you to see who is currently contr
このプロダクトを購入した人は以下も購入しています
Golden Trend Indicator MT5
Noha Mohamed Fathy Younes Badr
4.88 (16)
Golden Trend indicator  is The best indicator for predicting trend movement this indicator never lags and never repaints and never back paints    and give  arrow buy and sell    before the candle appear  and it will help you and  will make your trading decisions clearer its work on all currencies and  gold and crypto and all time frame This unique  indicator uses very secret algorithms to catch the  trends, so you can trade using this indicator and see the trend clear on charts  manual guide and
CBT Quantum Maverick 高効率バイナリーオプション取引システム CBT Quantum Maverickは、高いパフォーマンスとシンプルさを追求するトレーダー向けに設計されたバイナリーオプション取引システムです。カスタマイズの必要がなく、最適化された状態で使用を開始できます。シグナルに従うだけで、少しの練習でマスターできます。 主な特徴: シグナルの精度: 現在のローソク足を基に次のローソク足の取引シグナルを生成し、頻繁な再描画がありません。 多様な市場対応: バイナリーオプション取引に特化し、さまざまなブローカーや資産クラスに対応しています。 対応可能: Deriv Synthetic Charts :すべてのタイムフレームで使用可能。 OTCチャート :Quotex、PocketOption、Binomo、Stockity、IQOption、Exnova、OlympTrade、Deriv、Binolla、Homebrokerなどのブローカーに対応。MT5へのインポートは最初の1週間無料、その後は有料サービス。 FX、仮想通貨、商品市場 :幅広い資産利用が可能
これはMT5のインジケーターで、再描画なしで取引に参入するための正確なシグナルを提供します。 外国為替、暗号通貨、金属、株式、インデックスなど、あらゆる金融資産に適用できます。かなり正確な見積もりを提供し、取引を開始して終了するのに最適な時期を教えてくれます。1つのシグナルを処理しただけでインジケーターの元が取れた例の 動画 (6:22)をご覧ください。Entry PointsPro インジケーターの助けを借りたほとんどのトレーダーの最初の1週間の結果が改善しています。 Telegramグループ に登録してください。Entry Points Proインジケーターのメリットは次の通りです。 再描画のないエントリーシグナル 再描画されるインジケーターでは一度表示されたシグナルが削除されて大きな金銭的損失につながることがありますが、これと異なり、表示されて確認されたシグナルは消えることがありません。 エラーなしの取引開始 インジケーターアルゴリズムによって取引を開始する(資産を売買する)理想的な瞬間を見つけることができます。それを使用するすべてのトレーダーの成功率が向上します。 あら
Quantum TrendPulse を ご紹介します。これは、   SuperTrend   、   RSI   、および Stochastic のパワーを 1 つの包括的なインジケーターに組み合わせて、取引の可能性を最大限に引き出す究極の取引ツールです。精度と効率を求めるトレーダー向けに設計されたこのインジケーターは、市場のトレンド、勢いの変化、最適なエントリー ポイントとエグジット ポイントを自信を持って特定するのに役立ちます。 主な特徴: SuperTrend 統合: 現在の市場動向に簡単に追従し、収益性の波に乗ることができます。 RSI精度: 買われすぎと売られすぎのレベルを検出し、市場の反転のタイミングに最適で、SuperTrendのフィルターとして使用されます。 確率的精度: 確率的振動を活用して、変動の激しい市場で隠れたチャンスを見つけます。SuperTrend のフィルターとして使用されます。 マルチタイムフレーム分析:   M5 から H1 または H4 まで、さまざまなタイムフレームで市場を常に把握します。 カスタマイズ可能なアラート: カスタム取引条件が満たされ
TPSpro TREND PRO は 、市場を自動的に分析し、トレンドとその各変化に関する情報を提供し、再描画せずに取引にエントリーするためのシグナルを提供するトレンド指標です。 インジケーターは各ローソク足を使用し、個別に分析します。上向きまたは下向きのさまざまな衝撃を指します。通貨、仮想通貨、金属、株、指数の取引への正確なエントリーポイント! バージョンMT5                   インジケーターの完全な説明     RFI LEVELS インジケーター と併用することをお勧めします。 主な機能: レンダリングなしで正確な入力信号! シグナルが表示されると、それは関連性を維持します。これは、シグナルを提供してからそれを変更し、その結果、入金された資金が失われる可能性があるリドローインジケーターとの重要な違いです。より高い確率と精度で市場に参入できるようになりました。矢印が表示された後、ターゲットに到達する (利益確定) か反転シグナルが表示されるまで、ローソク足に色を付ける機能もあります。 STOP-LOSS/TAKE-PROFITゾーンの表示 エントリーポイントを
指示する     ロシア     -        utilizar con   el indicador の ESP 推奨事項 -   TPSpro トレンド プロフェッショナル版 -   MT5のバージョン 最も重要なことは、将来においても最も重要なことです。 機能のプリンシパル: ゾーンのほとんどは、ベンダーとコンプラドールによってアクティブ化されます。 状況を直感的に把握できるよう、初期の衝動を修正します。 LOGIC AI: MUESTRA zonas (círculos) parabuscar puntos de entrada cuando se activa una plantilla 視覚的に優れた視覚効果があり、最も重要な機能がすべて揃っていることに注意してください。 優れたニベレス/ゾーンの視覚化 (modo MTF) 世界で最も人気のある場所/ゾーンです。これを使用するのに最適な方法です (   TPSproTREND PRO   )。 アルゴリズム プロフェッショナル セパラド パソ ア パソ パラ オペラ それは、オペラハウスやコントラ・デ・エラの指導におい
Bill Williams Advanced is designed for automatic chart analysis using Bill Williams' "Profitunity" system. The indicator analyzes four timeframes at once. Manual (Be sure to read before purchasing) Advantages 1. Automatically analyzes the chart using the "Profitunity" system of Bill Williams. The found signals are placed in a table in the corner of the screen. 2. Equipped with a trend filter based on the Alligator indicator. Most of the system signals are recommended to be used only according t
ご紹介     Quantum Breakout PRO は 、ブレイクアウト ゾーンの取引方法を変革する画期的な MQL5 インジケーターです。 13年以上の取引経験を持つ経験豊富なトレーダーのチームによって開発されました。     クォンタム ブレイクアウト プロ   は、革新的でダイナミックなブレイクアウト ゾーン戦略により、あなたのトレーディングの旅を新たな高みに押し上げるように設計されています。 クォンタム ブレイクアウト インジケーターは、5 つの利益ターゲット ゾーンを備えたブレイクアウト ゾーン上のシグナル矢印と、ブレイクアウト ボックスに基づいたストップロスの提案を提供します。 初心者トレーダーにもプロのトレーダーにも適しています。 量子EAチャネル:       ここをクリック 重要!購入後、インストールマニュアルを受け取るためにプライベートメッセージを送ってください。 推奨事項: 時間枠: M15 通貨ペア: GBPJPY、EURJPY、USDJPY、NZDUSD、XAUUSD アカウントの種類: ECN、Raw、またはスプレッドが非常に低い R
今、147ドル(いくつかの更新後に499ドルに増加します) - 無制限のアカウント(PCSまたはMac) RelicusRoad ユーザー マニュアル + トレーニング ビデオ + プライベート Discord グループへのアクセス + VIP ステータス 市場の新しい見方 RelicusRoad は、外国為替、先物、暗号通貨、株式、および指数の世界で最も強力な取引インジケーターであり、トレーダーに収益を維持するために必要なすべての情報とツールを提供します。初心者から上級者まで、すべてのトレーダーが成功するためのテクニカル分析と取引計画を提供します。これは、将来の市場を予測するのに十分な情報を提供する重要な取引指標です。意味をなさないチャート上のいくつかの異なる指標ではなく、完全な解決策を信じています.これは、信号、矢印 + 価格アクション情報を表示するオールインワンのインジケーターで、他に類を見ない非常に正確です。 強力な AI に基づいて、RelicusRoad は不足している情報とツールを提供して、あなたを教育し、トレーディングのプロ、成功したトレーダーにします。 ほと
WHY IS OUR FXACCCURATE LS MT5 THE PROFITABLE ? PROTECT YOUR CAPITAL WITH RISK MANAGEMENT Gives entry, stop and target levels from time to time. It finds Trading opportunities by analyzing what the price is doing during established trends. POWERFUL INDICATOR FOR A RELIABLE STRATEGIES We have made these indicators with a lot of years of hard work. It is made at a very advanced level. Established trends provide dozens of trading opportunities, but most trend indicators completely ignore them! The
Gannスクエアインジケーターは、W.D. Gannによって執筆された「市場予測のための数学的な式」の記事に基づく強力な市場分析ツールです。このツールは、解析に数学的な概念を応用し、Gann理論に基づいています。それは、144、90、52のスクエアや9のスクエアなど、Gannの関連テクニックの要素を取り入れています。さらに、の方法を組み込んでおり、9のスクエアとその関連性についてのチャネルやスターパターンに焦点を当てています。 ユーザーマニュアルと使用方法: このインジケーターを使用する前に、ユーザーマニュアルを読んで疑問点を解決するためにお問い合わせいただくことをお勧めします。ユーザーマニュアルの完全版は、当社のウェブサイトで入手できます。 MT5の完全版は購入できますし、MT4の無料版も試すことができます。両方のバージョンへのリンクを提供していますので、ご利用ください。 主な機能と機能: Gannスクエアインジケーターは、市場分析のための完全なツールセットを提供し、幾何学的な概念とGann理論に基づいて的確な判断を行う手助けをします。以下に主な機能を示します。 9のスクエアの分析:
This Indicator creates a heatmap based on depth of market of the current symbol or another symbol. Other symbol is useful when you trade futures market and a contract has 'mini' and 'full' split. For example, in Brazil (B3 - BMF&Bovespa), WDO and DOL are future Forex contract of BRL/USD (where 1 DOL = 5 WDO) and big banks work mostly with DOL (where liquidity is important). Please use with M1 timeframe , objects are too small to be displayed at higher timeframes (MT5 limit). The number of level
Berma Bands
Muhammad Elbermawi
5 (3)
Berma Bands (BBs) インジケーターは、市場のトレンドを特定して活用したいトレーダーにとって貴重なツールです。価格と BBs の関係を分析することで、トレーダーは市場がトレンド段階にあるか、レンジ段階にあるかを判断できます。 詳細については、[ Berma Home Blog ] をご覧ください。 バーマ バンドは、上部バーマ バンド、中部バーマ バンド、下部バーマ バンドの 3 つの異なる線で構成されています。これらの線は価格の周りにプロットされ、全体的な傾向に対する価格の動きを視覚的に表します。これらのバンド間の距離から、ボラティリティや潜在的な傾向の反転についての洞察を得ることができます。 バーマ バンドの線がそれぞれ離れると、市場が横ばいまたはレンジ相場の期間に入っていることを示すことがよくあります。これは、明確な方向性の偏りがないことを示しています。トレーダーは、これらの期間中にトレンドを特定するのが難しいと感じる可能性があり、より明確なトレンドが出現するまで待つ場合があります。 バーマ バンドの線が 1 本の線に収束すると、強いトレンド環境の兆候となること
Royal Scalping Indicator is an advanced price adaptive indicator designed to generate high-quality trading signals. Built-in multi-timeframe and multi-currency capabilities make it even more powerful to have configurations based on different symbols and timeframes. This indicator is perfect for scalp trades as well as swing trades. Royal Scalping is not just an indicator, but a trading strategy itself. Features Price Adaptive Trend Detector Algorithm Multi-Timeframe and Multi-Currency Trend Low
CONTACT US  after purchase to get the Indicator Manual. Try Now—Limited 50% Discount for First 10 Buyers! Download the  Metatrader 4 Version Read the product description carefully before purchasing the product.  Due to regulatory restrictions, our service is unavailable in certain countries such as India, Pakistan, and Bangladesh. William Delbert Gann (W.D. Gann) was an exceptional market analyst, whose trading technique was based on a complex blend of mathematics, geometry, astrology, and anc
現在33%オフ 初心者にもエキスパートトレーダーにも最適なソリューション このインジケーターは独自の機能と新しい公式を多数内蔵しており、ユニークで高品質かつ手頃な取引ツールです。このアップデートでは、2つの時間枠ゾーンを表示できるようになります。より長いTFだけでなく、チャートTFとより長いTF(ネストゾーンを表示)の両方を表示できます。すべてのSupply Demandトレーダーの皆さんのお気に召すはずです。:) 重要情報の公開 Advanced Supply Demandの可能性を最大化するには、 https://www.mql5.com/ja/blogs/post/720245 にアクセスしてください。   エントリーまたはターゲットの正確なトリガーポイントを正確に特定できれば取引がどのように改善されるか想像してみてください。新しい基盤となるアルゴリズムに基づいて構築されているため、買い手と売り手の間の潜在的な不均衡をさらに簡単に特定できます。これは、最も強い需要と供給のゾーンと、過去のパフォーマンス(古いゾーンを表示)がグラフィカルに表現されるためです。これらの機能は、最適な
回帰取引を意味する専門的かつ定量的なアプローチを実装する独自の指標。これは、価格が予測可能かつ測定可能な方法で迂回して平均に戻るという事実を利用しており、非定量的な取引戦略を大幅に上回る明確な出入りルールを可能にします。 [ Installation Guide | Update Guide | Troubleshooting | FAQ | All Products ] 明確な取引シグナル 驚くほど簡単に取引できます カスタマイズ可能な色とサイズ パフォーマンス統計を実装します ほとんどの取引戦略を上回ります 適切なSLおよびTPレベルを表示します 電子メール/音声/視覚アラートを実装します 使い方 インディケータは、より高い時間枠からの完全にカスタマイズ可能な移動平均の周りの標準偏差を測定し、トレンドフォローアプローチを使用して正確に取引を見つけます。取引は、現在のチャートの価格アクションに飛び込むことによって見つけられ、価格が選択したより高い時間枠から計算された平均価格帯に戻ったときに閉じられます。それがコード化される方法のために、指標は高ボラティリティと強いトレンドの市場か
KT Renko Patterns scans the Renko chart brick by brick to find some famous chart patterns that are frequently used by traders across the various financial markets. Compared to the time-based charts, patterns based trading is easier and more evident on Renko charts due to their uncluttered appearance. KT Renko Patterns features multiple Renko patterns, and many of these patterns are extensively explained in the book titled Profitable Trading with Renko Charts by Prashant Shah. A 100% automated
Golden Spikes Detector
Batsirayi L Marango
3.25 (4)
Golden Spikes Detector This indicator is based on an advanced strategy primarily for trading spikes on Boom and Crash Indices. Complex algorithms were implemented to detect high probability entries only. It alerts on potential Buy and Sell entries. To trade spikes on the Deriv or Binary broker, only take Buy Boom and Sell Cash alerts. It was optimised to be loaded on 5-minute timeframe although multiple timeframe analysis is done in the background. Features ·             Desktop pop up and sound
Volume Horizon is a horizontal volume indicator that allows you to observe the density of market participants' volumes across various price and time intervals. Volume histograms can be constructed based on ascending or descending market waves, as well as individual bars. This tool enables more precise determination of entry or exit points, relying on levels of maximum volumes or volume-weighted average prices (VWAP). What makes Volume Horizon unique? 1. Segmentation into ascending and descendi
Quantum Trend Sniper
Bogdan Ion Puscasu
4.73 (51)
ご紹介   クォンタム トレンド スナイパー インジケーターは 、トレンド反転を特定して取引する方法を変革する画期的な MQL5 インジケーターです。 13年以上の取引経験を持つ経験豊富なトレーダーのチームによって開発されました。     クォンタムトレンドスナイパーインジケーター   は、非常に高い精度でトレンドの反転を識別する革新的な方法で、あなたのトレーディングの旅を新たな高みに押し上げるように設計されています。 ***Quantum Trend Sniper Indicatorを購入すると、Quantum Breakout Indicatorを無料で入手できます!*** クォンタム ブレイクアウト インジケーターは、トレンドの反転を特定するとアラートを発し、矢印を示し、3 つのテイクプロフィットレベルを提案します。 初心者トレーダーにもプロのトレーダーにも適しています。 量子EAチャネル:       ここをクリック MT4のバージョン:       ここをクリック 推奨事項: 期間:すべての時間枠。最良の結果を得るには、M15、M30、H1 のタイムフ
TPA True Price Action indicator reveals the true price action of the market makers through 100% non-repainting signals strictly at the close of a candle! TPA shows entries and re-entries, every time the bulls are definitely stronger than the bears and vice versa. Not to confuse with red/green candles. The shift of power gets confirmed at the earliest stage and is ONE exit strategy of several. There are available now two free parts of the TPA User Guide for our customers. The first "The Basics"
The AT Forex Indicator MT5 is a sophisticated trading tool designed to provide traders with a comprehensive analysis of multiple currency pairs. This powerful indicator simplifies the complex nature of the forex market, making it accessible for both novice and experienced traders. AT Forex Indicator uses advanced algorithms to detect trends, patterns and is an essential tool for traders aiming to enhance their forex trading performance. With its robust features, ease of use, and reliable signal
Royal Wave Pro M5
Vahidreza Heidar Gholami
3.5 (4)
Royal Wave is a Trend-Power oscillator which has been programmed to locate and signal low-risk entry and exit zones. Its core algorithm statistically analyzes the market and generates trading signals for overbought, oversold and low volatile areas. By using a well-designed alerting system, this indicator makes it easier to make proper decisions regarding where to enter and where to exit trades. Features Trend-Power Algorithm Low risk Entry Zones and Exit Zones Predictions for Overbought and Over
Was: $299  Now: $149  Supply Demand uses previous price action to identify potential imbalances between buyers and sellers. The key is to identify the better odds zones, not just the untouched ones. Blahtech Supply Demand indicator delivers functionality previously unavailable on any trading platform. This 4-in-1 indicator not only highlights the higher probability zones using a multi-criteria strength engine, but also combines it with multi-timeframe trend analysis, previously confirmed swings
note: this indicator is for METATRADER4, if you want the version for METATRADER5 this is the link:  https://www.mql5.com/it/market/product/108106 TRENDMAESTRO ver 2.4 TRENDMAESTRO recognizes a new TREND in the bud, he never makes mistakes. The certainty of identifying a new TREND is priceless. DESCRIPTION TRENDMAESTRO identifies a new TREND in the bud, this indicator examines the volatility, volumes and momentum to identify the moment in which there is an explosion of one or more of these data a
これはほぼ間違いなく、MetaTraderプラットフォームで見つけることができる最も完全な調和価格形成自動認識インジケーターです。 19種類のパターンを検出し、フィボナッチプロジェクションをあなたと同じように真剣に受け止め、潜在的逆転ゾーン(PRZ)を表示し、適切なストップロスとテイクプロフィットレベルを見つけます。 [ インストールガイド | 更新ガイド | トラブルシューティング | よくある質問 | すべての製品 ] 19の異なる調和価格形成を検出します プライマリ、派生および補完フィボナッチ投影(PRZ)をプロットします 過去の価格行動を評価し、過去のすべてのパターンを表示します この指標は、独自の品質とパフォーマンスを分析します 適切なストップロスとテイクプロフィットのレベルを表示します ブレイクアウトを使用して適切な取引を通知します すべてのパターン比をグラフにプロットします 電子メール/音声/視覚アラートを実装します スコット・M・カーニーの本に着想を得て、この指標は最も純粋で急を要するトレーダーのニーズを満たすように設計されています。ただし、トレードを容易にする
!SPECIAL SALE!  The Trend Forecaster indicator utilizes a unique proprietary algorithm to determine entry points for a breakout trading strategy. The indicator identifies price clusters, analyzes price movement near levels, and provides a signal when the price breaks through a level. The Trend Forecaster indicator is suitable for all financial assets, including currencies (Forex), metals, stocks, indices, and cryptocurrencies. You can also adjust the indicator to work on any time frames, althoug
MetaForecast M5
Vahidreza Heidar Gholami
5 (2)
MetaForecastは、価格データのハーモニクスに基づいて、どんな市場の未来を予測し視覚化します。市場が常に予測可能ではありませんが、価格にパターンがある場合、MetaForecastは可能な限り正確な未来を予測できます。他の類似製品と比較して、MetaForecastは市場のトレンドを分析することでより正確な結果を生成することができます。 入力パラメータ Past size (過去のサイズ) MetaForecastが将来の予測を生成するために使用するバーの数を指定します。モデルは選択したバー上に描かれた黄色の線で表されます。 Future size (将来のサイズ) 予測すべき将来のバーの数を指定します。予測された将来は、ピンクの線で表示され、その上に青い回帰線が描かれます。 Degree (程度) この入力は、MetaForecastが市場で行う分析のレベルを決定します。 Degree 説明  0 Degree 0の場合、価格の全てのピークや谷、そして詳細をカバーするために、「Past size」の入力に大きな値を使用することが推奨されています。  1 (推奨) Degre
このインディケータは、1つのウィンドウで複数のタイムフレームのトレン ド方向を表示します。複数のタイムフレームのトレンドが一致する場合、矢印が描かれます。 また、ヒストグラムに切り替えて、現在のタイムフレームのトレンドを表示することもできます。 このインディケータは、チャート上にエントリーポイントとおおよそのエグジットポ イントを描画します。 警告:このインディケータはマルチタイムフレームであるため、ストラテジーテスターで使用する場合は、必要なすべてのタイムフレームの相場を事前にダウンロードしておく必要があります。テスターで長い間相場のダウンロードを待たずに済むように、開始日を2025.01.01とし、モデルを「オープンプライスのみ」または「コントロールポイント」とすることができます。 MT4用インジケーターバージョン 特徴     このインディケータは再描画しません。ヒストリカルチャートに表示されているものがリアルタイムで表示されます。     暗号通貨、株式、金属、指数、商品、通貨など、あらゆる資産の取引に使用できます。     すべてのタイムフレームに対応。     エン
作者のその他のプロダクト
トレンドキャッチャー: アラートインジケーター付きのトレンドキャッチャーストラテジーは、市場トレンドやポテンシャルなエントリーポイントやエグジットポイントを特定するのに役立つ多目的な技術分析ツールです。動的なトレンドキャッチャーストラテジーを備えており、市場状況に適応してトレンドの方向を明確に視覚化します。トレーダーは、自身の好みやリスク許容度に合わせてパラメーターをカスタマイズできます。このインジケーターはトレンドの識別を支援し、ポテンシャルなリバーサルをシグナルし、トレイリングストップのメカニズムとして機能し、市場への迅速な対応のためのリアルタイムアラートを提供します。 特徴: - トレンドの識別:上昇トレンドと下降トレンドをシグナルします。 - トレンドのリバーサル:ローソク足の色が上昇から下降に変わった場合やその逆の場合に、ポテンシャルなリバーサルを警告します。 - リアルタイムアラート:新しいトレンドの識別に対するアラートを生成します。 推奨事項: - 通貨ペア:EURUSD、AUDUSD、XAUUSDなど... - タイムフレーム:H1。 - アカウントタイプ:
FREE
サポート&レジスタンスレベルファインダー: サポート&レジスタンスレベルファインダーは、取引におけるテクニカル分析を向上させるために設計された高度なツールです。ダイナミックなサポートとレジスタンスレベルを備えており、チャート上で新しいキーポイントが展開されるにつれてリアルタイムに適応し、ダイナミックかつレスポンシブな分析を提供します。そのユニークなマルチタイムフレーム機能により、ユーザーは任意の所望のタイムフレームで異なるタイムフレームからのサポートとレジスタンスレベルを表示でき、日足レベルを5分足のチャートに表示するなど、微妙な視点を提供します。歴史的データセットを組み込んだスマートアルゴリズムを利用しており、他のS&Rインジケーターとは異なる包括的な分析を確保しています。レベルの検出時には複数パラメータ計算を使用し、精度を向上させています。ユーザーは、サポートとレジスタンスレベルの色を個別にカスタマイズでき、パーソナライズされたビジュアルエクスペリエンスを作成できます。ツールには価格が重要なレベルに近づくとトレーダーに通知するアラート機能も含まれており、タイムリーな意思決定を促
FREE
まず第一に、この取引ツールはノンリペイント、ノンリドロー、ノンラグの指標であり、プロの取引に理想的ですことを強調する価値があります。 オンラインコース、ユーザーマニュアル、デモ。 スマートプライスアクションコンセプトインジケーターは、新米から経験豊富なトレーダーまで、非常 に強力なツールです。Inner Circle Trader AnalysisやSmart Money Concepts Trading Strategiesなど、20以上の有用な指標を1つに組み合わせています。このインジケーターはスマートマネーコンセプトに焦点を当て、大手機関の取引方法を提供し、彼らの動きを予測するのに役立ちます。 特に、流動性分析に優れており、機関がどのように取引しているかを理解しやすくしています。市場のトレンドを予測し、価格の動きを慎重に分析するのに優れています。機関の戦略とトレードを合わせることで、市場の動向についてより正確な予測ができます。このインジケーターは多目的であり、市場構造を分析し、重要な注文ブロックを特定し、さまざまなパターンを認識するのに優れています。 このインジケーター
トレードポジションとバックテストツール: 「トレードポジションとバックテストツール」、またの名を「リスクリワード比ツール」としても知られるこの包括的かつ革新的な指標は、技術分析とトレード戦略を向上させるために設計されています。 リスクツールは、外国為替取引における効果的なリスク管理のための包括的で使いやすいソリューションです。エントリーポイント、ストップロス(SL)、テイクプロフィット(TP)など、取引ポジションのプレビューを含め、今後の取引の透明な表示を提供します。使いやすいパネルには、自動バランスとカスタムバランスのオプションが備わっており、自動ロットおよびリスク計算をサポートしています。市場での買い注文、売り注文、買いストップ、売りストップ注文など、さまざまな取引プレビューをサポートしています。このツールには、高度なリスクリワード比機能が含まれており、チャート上の任意の場所で高度にカスタマイズ可能な動きを提供し、購入および販売セットアップが完了します。トレード情報のスマートな表示には、開始用のロットサイズ、ストップロス、TP、注文タイプなど、重要な詳細が含まれます。また、SL
FREE
トレーディングセッション時間インジケーター: 「トレーディングセッション時間インジケーター」は、外国為替市場での異なる取引セッションの理解を向上させるために設計された強力なテクニカル分析ツールです。このシームレスに統合されたインジケーターは、東京、ロンドン、ニューヨークなどの主要セッションの開始および終了時刻に関する重要な情報を提供します。自動的なタイムゾーンの調整により、世界中のトレーダーに対応し、取引スケジュールを高流動性の期間に最適化し、低活動時間を回避するのに役立ちます。市場センチメント、ピークのボラティリティ期間、およびセッションの重複に関する洞察を提供し、日中トレーダーが戦略に沿った正確な決定を行うのを支援します。カスタマイズ可能な表示により、ユーザーの体験を個人化できます。また、そのデータを組み込んだスマートな取引計画は、改善された取引結果につながる可能性があります。低活動時間の認識を促進することで、トレーダーは過度の取引を避け、品質の高い機会に集中できます。さまざまな取引プラットフォームとシームレスに互換性があり、「トレーディングセッション時間インジケーター」は、ト
FREE
まず第一に、このトレーディングシステムがノンリペイント、ノンリドロー、ノンラグのインジケーターであることを強調する価値がある。これにより、手動取引とロボット取引の両方に理想的なものになっています。 オンラインコース、マニュアル、プリセットのダウンロード。 「スマートトレンドトレーディングシステム MT5」は、新規および経験豊富なトレーダー向けにカスタマイズされた包括的なトレーディングソリューションです。10以上のプレミアムインジケーターを組み合わせ、7つ以上の堅実なトレーディング戦略を備えており、多様な市場状況に対応する多目的な選択肢となっています。 トレンドフォロー戦略:トレンドを効果的に乗り越えるための正確なエントリーとストップロス管理を提供します。 リバーサル戦略:潜在的なトレンドの反転を特定し、トレーダーがレンジ相場を活用できるようにします。 スキャルピング戦略:高速で正確なデイトレードおよび短期取引のために設計されています。 安定性:すべてのインジケーターはノンリペイント、ノンリドロー、ノンラグであり、信頼性の高いシグナルを保証します。 カスタマイズ:個々の取引の嗜好に合わせ
サポート&レジスタンスレベルファインダー: サポート&レジスタンスレベルファインダーは、取引におけるテクニカル分析を向上させるために設計された高度なツールです。ダイナミックなサポートとレジスタンスレベルを備えており、チャート上で新しいキーポイントが展開されるにつれてリアルタイムに適応し、ダイナミックかつレスポンシブな分析を提供します。そのユニークなマルチタイムフレーム機能により、ユーザーは任意の所望のタイムフレームで異なるタイムフレームからのサポートとレジスタンスレベルを表示でき、日足レベルを5分足のチャートに表示するなど、微妙な視点を提供します。歴史的データセットを組み込んだスマートアルゴリズムを利用しており、他のS&Rインジケーターとは異なる包括的な分析を確保しています。レベルの検出時には複数パラメータ計算を使用し、精度を向上させています。ユーザーは、サポートとレジスタンスレベルの色を個別にカスタマイズでき、パーソナライズされたビジュアルエクスペリエンスを作成できます。ツールには価格が重要なレベルに近づくとトレーダーに通知するアラート機能も含まれており、タイムリーな意思決定を促
FREE
トレーディングセッション時間インジケーター: 「トレーディングセッション時間インジケーター」は、外国為替市場での異なる取引セッションの理解を向上させるために設計された強力なテクニカル分析ツールです。このシームレスに統合されたインジケーターは、東京、ロンドン、ニューヨークなどの主要セッションの開始および終了時刻に関する重要な情報を提供します。自動的なタイムゾーンの調整により、世界中のトレーダーに対応し、取引スケジュールを高流動性の期間に最適化し、低活動時間を回避するのに役立ちます。市場センチメント、ピークのボラティリティ期間、およびセッションの重複に関する洞察を提供し、日中トレーダーが戦略に沿った正確な決定を行うのを支援します。カスタマイズ可能な表示により、ユーザーの体験を個人化できます。また、そのデータを組み込んだスマートな取引計画は、改善された取引結果につながる可能性があります。低活動時間の認識を促進することで、トレーダーは過度の取引を避け、品質の高い機会に集中できます。さまざまな取引プラットフォームとシームレスに互換性があり、「トレーディングセッション時間インジケーター」は、ト
FREE
トレードポジションとバックテストツール: 「トレードポジションとバックテストツール」、またの名を「リスクリワード比ツール」としても知られるこの包括的かつ革新的な指標は、技術分析とトレード戦略を向上させるために設計されています。 リスクツールは、外国為替取引における効果的なリスク管理のための包括的で使いやすいソリューションです。エントリーポイント、ストップロス(SL)、テイクプロフィット(TP)など、取引ポジションのプレビューを含め、今後の取引の透明な表示を提供します。使いやすいパネルには、自動バランスとカスタムバランスのオプションが備わっており、自動ロットおよびリスク計算をサポートしています。市場での買い注文、売り注文、買いストップ、売りストップ注文など、さまざまな取引プレビューをサポートしています。このツールには、高度なリスクリワード比機能が含まれており、チャート上の任意の場所で高度にカスタマイズ可能な動きを提供し、購入および販売セットアップが完了します。トレード情報のスマートな表示には、開始用のロットサイズ、ストップロス、TP、注文タイプなど、重要な詳細が含まれます。また、SL
FREE
Description:  For a comprehensive understanding of our indicators, we invite you to explore the entire Q&A section within this MQL5 blog post   here . The "VWAP Indicator Strategy" is a cutting-edge technical analysis tool designed to provide traders with a competitive advantage in the financial markets. By incorporating the Volume Weighted Average Price (VWAP) indicator, this tool offers valuable insights into market trends, price levels, and potential turning points. Understanding the VWAP Ind
Get FREE Advanced Online Course and Learn About Our Advanced Trading System, Link in the Bio!  Click Here.  Our Mission and Vision:   Why Am I Even Here?    Here is The Deal Brother, We Offer:Premium Quality Indicators: The Highest Quality Possible Algorithms. Unlimited Activations: Can be used on Unlimited number of Computers, MT4s and MT5s for lifetime. Inexpensive Prices: 30$ is the lowest price possible, Knowing that more than 50% of our Indicators are 100% FREE. But Why Am I telling You th
Description:  The "ABC Pattern Strategy With Fibonacci" Indicator is a sophisticated technical analysis tool meticulously designed to recognize and leverage the power of the ABC chart patterns in combination with Fibonacci levels. This cutting-edge strategy empowers traders to make well-informed decisions in the dynamic forex market. By making spotting ABC patterns on price charts an easy task, the indicator offers insights into potential trend reversals or continuations. It seamlessly incorpora
Get FREE Advanced Online Course and Learn About Our Advanced Trading System, Link in the Bio!  Click Here.  Our Mission and Vision:   Why Am I Even Here? Here is The Deal Brother, We Offer:Premium Quality Indicators: The Highest Quality Possible Algorithms. Unlimited Activations: Can be used on Unlimited number of Computers, MT4s and MT5s for lifetime. Inexpensive Prices: 30$ is the lowest price possible, Knowing that more than 50% of our Indicators are 100% FREE. But Why Am I telling You this?
Description:  For a comprehensive understanding of our indicators, we invite you to explore the entire Q&A section within this MQL5 blog post   here . The "Moving Average Lines Crossover with Alert" is a valuable technical analysis tool designed to help traders identify potential trend reversals and trading opportunities. Seamlessly integrated into your trading platform, this indicator empowers you with essential data to make well-informed trading decisions. Spot Trend Reversals: Utilize the pow
FREE
Get FREE Advanced Online Course and Learn About Our Advanced Trading System, Link in the Bio!  Click Here.  Our Mission and Vision: Why Am I Even Here?Here is The Deal Brother, We Offer: Premium Quality Indicators: The Highest Quality Possible Algorithms. Unlimited Activations: Can be used on Unlimited number of Computers, MT4s and MT5s for lifetime. Inexpensive Prices: 30$ is the lowest price possible, Knowing that more than 50% of our Indicators are 100% FREE. But Why Am I telling You this?
FREE
Description:  For a comprehensive understanding of our indicators, we invite you to explore the entire Q&A section within this MQL5 blog post   here . The "Show TP and SL Values" Indicator is a valuable technical analysis tool designed to enhance your trading experience by displaying the  (TP) and  (SL) levels directly on your chart. This simple yet effective tool provides traders with crucial information, allowing for better decision-making and risk management. Key Features: TP and SL Display:
FREE
Description:  The Range Breakout Catcher Indicator is a powerful tool known for its non-repainting, non-redrawing, and non-lagging capabilities, making it suitable for both manual and robot trading. This indicator utilizes a smart algorithm to calculate ranges and generate early signals for Buy and Sell positions at the breakout of these ranges, facilitating the capture of trends during ranging consolidations. The range calculation involves a comprehensive system based on various elements, prov
Description:  For a comprehensive understanding of our indicators, we invite you to explore the entire Q&A section within this MQL5 blog post   here . The Moving Average 5EMA Indicator is a valuable tool designed to provide comprehensive insights into market trends and potential entry and exit points. It incorporates five exponential moving average (EMA) lines, each representing the average price over different periods. This powerful combination offers a deeper understanding of price movements a
FREE
Description:  For a comprehensive understanding of our indicators, we invite you to explore the entire Q&A section within this MQL5 blog post   here . The "Live Account Statistics" Indicator is a powerful technical analysis tool that provides real-time insights into the performance of your trading account. With this indispensable tool, you can access crucial account statistics, such as balance, equity, drawdown, and more, allowing you to make data-driven trading decisions. Key Features: Real-Ti
FREE
Description:  For a comprehensive understanding of our indicators, we invite you to explore the entire Q&A section within this MQL5 blog post   here . The "Show TP and SL Values" Indicator is a valuable technical analysis tool designed to enhance your trading experience by displaying the  (TP) and  (SL) levels directly on your chart. This simple yet effective tool provides traders with crucial information, allowing for better decision-making and risk management. Key Features: TP and SL Display:
FREE
Description:  For a comprehensive understanding of our indicators, we invite you to explore the entire Q&A section within this MQL5 blog post   here . The "VWAP Indicator Strategy" is a cutting-edge technical analysis tool designed to provide traders with a competitive advantage in the financial markets. By incorporating the Volume Weighted Average Price (VWAP) indicator, this tool offers valuable insights into market trends, price levels, and potential turning points. Understanding the VWAP Ind
Description:  For a comprehensive understanding of our indicators, we invite you to explore the entire Q&A section within this MQL5 blog post   here . The "High Spread Alert" Indicator is a valuable tool for traders, providing real-time information about spread fluctuations in the forex market. As a technical analysis tool, it helps traders make informed decisions by alerting them to periods of high spread, which can impact trading conditions and execution. Key Features: Spread Monitoring: The
FREE
Description:  The "Trend Finder Multi Time Frames multi pairs" indicator is a new technical analysis tool designed to assist traders in identifying and confirming trends across multiple timeframes and multiple pairs at the same time. By combining the strengths of various timeframes, this indicator offers a comprehensive view of the market's direction, helping traders make more informed decisions. Features: Multi-Timeframe Analysis: The indicator analyzes trends on different timeframes (e.g., M1
Description:  For a comprehensive understanding of our indicators, we invite you to explore the entire Q&A section within this MQL5 blog post   here . The "High Spread Alert" Indicator is a valuable tool for traders, providing real-time information about spread fluctuations in the forex market. As a technical analysis tool, it helps traders make informed decisions by alerting them to periods of high spread, which can impact trading conditions and execution. Key Features: Spread Monitoring: The i
FREE
Description:  For a comprehensive understanding of our indicators, we invite you to explore the entire Q&A section within this MQL5 blog post   here . The "Currency Strength Meter Strategy" Indicator is a cutting-edge technical analysis tool that offers traders a unique perspective on the forex market. By analyzing the relative strength of different currencies, this indicator provides valuable insights into the market's dynamics, allowing traders to make informed decisions. Understanding Curren
Description:  For a comprehensive understanding of our indicators, we invite you to explore the entire Q&A section within this MQL5 blog post   here . The "Candlestick Pattern Finder with Alerts and Hide Button" is a sophisticated technical analysis tool designed to elevate your trading experience by identifying key candlestick patterns in the market. This powerful indicator offers valuable insights into price action, enabling you to make well-informed trading decisions. Unlock Candlestick Insi
Description:  For a comprehensive understanding of our indicators, we invite you to explore the entire Q&A section within this MQL5 blog post   here . The "MACD Crossover with Alert and Button" is a valuable technical analysis tool designed to help traders spot potential trend changes and trading opportunities in the market. This indicator provides essential insights into the market's momentum, enabling you to make well-informed trading decisions. Master the MACD Indicator: The Moving Average Co
Description:  For a comprehensive understanding of our indicators, we invite you to explore the entire Q&A section within this MQL5 blog post   here . The "Moving Average Lines Crossover with Alert" is a valuable technical analysis tool designed to help traders identify potential trend reversals and trading opportunities. Seamlessly integrated into your trading platform, this indicator empowers you with essential data to make well-informed trading decisions. Spot Trend Reversals: Utilize the po
Description:  For a comprehensive understanding of our indicators, we invite you to explore the entire Q&A section within this MQL5 blog post   here . The Moving Average Cross Price Alert Indicator is a technical tool designed to simplify your trading decisions. With a single moving average line, this indicator effectively identifies trend changes and potential trade opportunities. Its core function is to provide real-time alerts when the price crosses above or below the moving average line, sig
Description:  The "Trend Finder Multi Time Frames multi pairs" indicator is a new technical analysis tool designed to assist traders in identifying and confirming trends across multiple timeframes and multiple pairs at the same time. By combining the strengths of various timeframes, this indicator offers a comprehensive view of the market's direction, helping traders make more informed decisions. Features: Multi-Timeframe Analysis: The indicator analyzes trends on different timeframes (e.g., M1
フィルタ:
Suherdi St
274
Suherdi St 2025.01.24 07:19 
 

sangat membantu, untuk startegi support dan resisten

jacksoh01
47
jacksoh01 2024.09.10 23:21 
 

Why you haven't replied to me for so many days when you indicator got problum ? ? ?

krzys1973
426
krzys1973 2024.05.17 20:40 
 

ユーザーは評価に対して何もコメントを残しませんでした

Issam Kassas
355798
開発者からの返信 Issam Kassas 2024.05.19 13:09
So many people dont know the purpose of this Indicator! Pls guys watch the online course first.
This Indicator is a trading system dedicated for experienced traders who trade support and resistance strategies and who do technical analysis! This is indicator is packed with multiple indicators that can be used alone or mixed to create your own strategy! Please learn support and resistance strategies and price action.
nasar78613
135
nasar78613 2024.02.13 10:37 
 

Very good indicator for support and resistance but we have some issues this indicator not work below 15m timeframe please you can fix this and second candlestick accuracy is 60% please increase

レビューに返信
バージョン 1.10 2023.11.09
- Fixed some bugs and optimized the performance.