Conheça o Mercado MQL5 no YouTube, assista aos vídeos tutoriais
Como comprar um robô de negociação ou indicador?
Execute seu EA na
hospedagem virtual
hospedagem virtual
Teste indicadores/robôs de negociação antes de comprá-los
Quer ganhar dinheiro no Mercado?
Como apresentar um produto para o consumidor final?
Expert Advisors e Indicadores para MetaTrader 5 - 103

News Trade é um EA semi-automático que utiliza a estratégia de plotar duas ordens pendentes , uma acima e outra abaixo do preço, com uma distância pré definida entre elas.
Ambas acompanham o preço até o momento da notícia, onde param de se mover. Após o preço atingir uma delas a outra é automaticamente cancelada.
O stop móvel (trailing stop e step) é aplicado, podendo ter também fechamento parcial automático. Este EA é perfeito para operar notícias de grande impacto como o Payroll, por exemplo.

Hello my friends. This Expert Advisor is based on Ichimoku Kinko Hyo and Heiken_Ashi indicator. The input parameters are optimized for EURCAD H1. - magics = magic number - Lots = Lots - CloseMethod = Method to Close order - TP-SL-TSL (if set SL and TP = 0 it will open and close by signal) - MartinBuyOrSell = Open and Martingale oneway - MartinBuyandSell = Open and Martingale twoway - TP = take profit (point) - SL = stoploss (point) - tsl = trailing stop - martin_Plus =
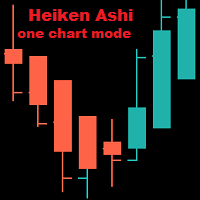
Heiken Ashi On One Chart Mode The indicator is displayed only on one of the chart modes: Bars, Candles, Line. The default is Bars. When switching the chart mode, the indicator is displayed or disappears depending on the chart mode. Input parameters: iChartMode: on what chart mode should the indicator be displayed mBars mCandles mLine Colors: LightSeaGreen: bull candle Tomato: bear candle
ZoneFinder is an indicator panel that presents an interactive, multi-timeframe visualisation of trend direction and strength. Trend strength and direction is measured using a modified ADX indicator based on smoothed DI+ and DI- values. High probability trading zones are identified using Fibonacci retracements. Where such zones are found, they are marked on the chart together with a proposed Fibonacci targets.

Smart YTG mt5 Expert Advisor para o terminal MT4 O Smart YTG foi escrito para funcionar nos pares de moedas GBPUSD e EURUSD, período do gráfico H1. Em essência, o sistema apresenta tendências e funciona perfeitamente nas seções de tendência do movimento de preços com ordens STOP, a tendência é determinada pela análise do indicador Price Channel embutido no Expert Advisor; não há necessidade de instalar adicionalmente o indicador. Nas áreas planas, quando o mercado está indeciso e o movimento

Candlestick Patterns MT5 is a simple and convenient indicator able to define 29 candle patterns.
Advantages Defines and highlights 29 candle patterns; Estimated trading direction is shown as an arrow; Each candlestick pattern can be disabled in the settings; The indicator can be used as an arrow indicator in EAs.
Parameters TextSize - chart text size; TextColor - chart text color; Alert - enable/disable alerts; ---------- Candlestick Patterns ------------- - settings separator; AdvanceBlo

KT CCI Surfer uses a mean reversion trading strategy with a combination of extreme overbought/oversold zone detection using the Commodity Channel Index (CCI). Developed by Donald Lambert in 1980, CCI is a leading indicator that helps to identify the overbought/oversold region in the market without any lag.
Obviously, not every overbought/oversold signal turns out into a price reversal. However, when combined with a well-planned mean reversion strategy, it produces excellent results.
Recommend

Apresentando o Awesome Oscillator Alert , um poderoso indicador técnico que fornece aos traders informações valiosas sobre a dinâmica do mercado e oportunidades de negociação. Com seus recursos abrangentes e interface amigável, este indicador é uma ferramenta essencial para traders que buscam obter vantagem no mercado.
Um dos recursos de destaque do Awesome Oscillator Alert é sua compatibilidade com todos os pares de moedas e prazos. Esteja você negociando pares principais ou moedas exótica
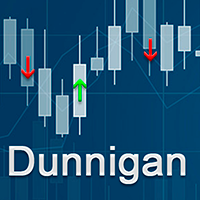
This is a trend indicator based on a strategy created by William Dunnigan that emit signals to buy or sell on any timeframe and can assist in decision making for trading on stock market or Forex. The signals are fired according to the following rules: Buy Signal = Fired at the first candlestick in which close price is higher than the higher price of the last candlestick. The higher and lower prices of the current candlestick must be higher than the corresponding ones of the last candlestick as w
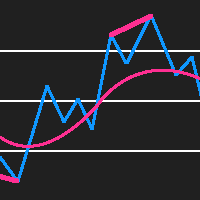
RSI Divergence Detector is an RSI indicator which also detects divergences and plots arrows and trend lines on the chart where you should buy and sell. Please note that this indicator provides 5 buffers and doesn't repaint making it an exceptional indicator for Expert Advisors. The indicator also provides alerts. Buffer 0 = RSI Buffer 1 = Buy Buffer 2 = Sell Buffer 3 = RSIGradient Buffer 4 = PriceGradient
NON REPAINTING
DIVERGENCE DETECTION

This EA filters transactions based on daily and monthly chart analysis over the past multiple periods This EA will detect the level and the movement of the BARS that is high possibility trend will continue. The Expert Advisor also features money management, traditional SL, TP and trailing stop. EA uses the reduced investment scheme. The fixed stop loss and take profit are always set for each trade. Only one order is used for trading each instrument, which ensures maximum safety of trading. Param
(Traduzido com Google)
Não é mais necessário calcular o tamanho da sua posição.
Defina o tamanho do risco em% (com base no seu saldo) e, em seguida, localize o nível StopLoss da sua posição em potencial e sua negociação será executada com o tamanho de posição apropriado.
Você tem a chance de fechar todas as suas posições flutuantes no instrumento em que está atualmente, clicando no botão "FECHAR".
Como usar?
Anexe o especialista ao gráfico e defina seus parâmetros. Clique no botão PARAR

The Metatrader 5 has a hidden jewel called Chart Object, mostly unknown to the common users and hidden in a sub-menu within the platform. Called Mini Chart, this object is a miniature instance of a big/normal chart that could be added/attached to any normal chart, this way the Mini Chart will be bound to the main Chart in a very minimalist way saving a precious amount of real state on your screen. If you don't know the Mini Chart, give it a try - see the video and screenshots below. This is a gr
Swinger RSI
É inconveniente gastar seu tempo negociando com base em indicadores técnicos, quando o software pode fazer o mesmo trabalho, de maneira adversa aos riscos.
Este Expert Advisor conta com o indicador RSI para negociar oscilações de preço.
O que este EA oferece?
- valores configuráveis de teto e piso RSI
- estratégia de negociação personalizável (consulte o parâmetro swing)
- Trailing Stop Avançado
Parâmetros do EA:
- volume (o valor padrão é 0,01)
- obter lucro (em pip

The VMA is an exponential moving average that adjusts its smoothing constant on the basis of market volatility. Its sensitivity grows as long as the volatility of the data increases. Based on the Chande's Momentum Oscillator, the VMA can automatically adjust its smoothing period as market conditions change, helping you to detect trend reversals and retracements much quicker and more reliable when compared to traditional moving averages.

The basis of the strategy is the identification of quick corrective movements between the crosses of a working currency pair or metal. At the moment of differences in prices of trading instruments, the adviser analyzes the possible direction of price movement on a working instrument and starts work.
Each position has a stop loss and take profit.
A unique position tracking algorithm allows you to control the superiority of profit over loss.
The adviser does not use dangerous trading methods.

Night Scalper é um sistema de scalping para trabalhar em um mercado calmo à noite. Não usa martingale ou grade. Adequado para todos os corretores, incluindo corretores dos EUA com regras FIFO. Todos os pedidos são acompanhados por um stop loss virtual e take profit em pips, os valores podem ser fixos ou dinâmicos. Ele também tem um trailing stop virtual e ponto de equilíbrio. O gráfico exibe informações sobre a velocidade de execução do pedido e o deslizamento.
Link da versão MT4
O consulto

Main: Not martingale, not a grid; Working on all symbols; Use on EURUSD; Use on M5.
Signals: There is a good rational algorithm. Work of two indicators: Ichimoku and Alligator (you can set a separate Timeframe for each indicator)
Stop Loss/Take Profit: There is a good money management system (there are several type for trailing stop loss); There is virtual levels of Stop Loss / Take Profit; There is smart lot (percent by risk) or fix lot
Important: EA can work on closed candles, and on curr

The underlying P.S.-Technical Trading bot is a computer program written in the MQL5 language. The P.S.-Technical Trading bot is a fully automated trading robot based on the two developed technical indicators, ADX and Parabolic SAR, developed by technical analyst Welles Wilder Jr.
If you want to learn more about this, I recommend the book "New Concepts in Technical Trading Systems" which was published in 1978.
In addition, the trading bot eliminates all too understandable emotions during trad

DYJ WITHDRAWAL PLAN: Sistema de Negociação de Reversão de Tendência 1. O que é o DYJ WITHDRAWAL PLAN? O DYJ WITHDRAWAL PLAN é um sistema inteligente de negociação de reversão de tendência , capaz de abrir e fechar ordens automaticamente quando o mercado muda de direção, ajudando os traders a capturar as principais oportunidades de movimentação dos preços.
Este sistema é compatível com todos os instrumentos de negociação e todos os corretores , incluindo Forex e Ín
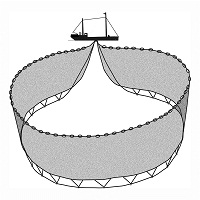
Dragnet mt5 Robô de negociação totalmente automatizado. Não usa indicadores, comercializa constantemente. Analisa as posições abertas atuais para tomar decisões de negociação. Não há martingale, nem aumento de lotes de negociação. Descrição das configurações Count_All - número de posições para lucro total Lote - volume da posição, se = 0, o parâmetro de risco funciona Risco - cálculo automático do lote a partir do saldo da conta de negociação TakeProfit - nível de lucro de uma única posição Pa
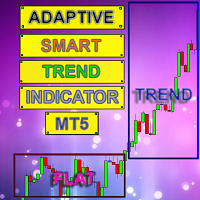
Smart indicator Adaptive Smart Trend Indicator determines the sectors of the Trend and the Flat and also in the form of a histogram shows the breakdown points of the levels (1 - 5).
The indicator performs many mathematical calculations to display more optimal Trend movements on the chart.
The program contains two indicators in one: 1 - draws the Trend and Flat sectors, 2 - the histogram indicator shows the best signals for opening an order. The indicator autonomously calculates the most o
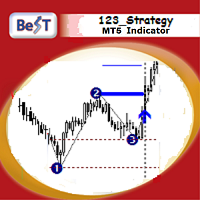
BeST_123 Strategy is clearly based on the 123 Pattern which is a frequent Reversal Chart Pattern of a very high Success Ratio .It occurs at the end of trends and swings and it’s a serious indication of high probability for a change in trend.Theoretically an 123_pattern is valid when the price closes beyond the level of #2 local top/bottom, a moment when the indicator draws an Entry Arrow, raises an Alert, and a corresponding Position can be opened.
The BeST 123_Strategy Indicator is non-repain
FuturesBot NQ100 Advisor works only on NETTING accoun ts!
Trading Advisor " FuturesBot NQ100 "is intended solely and exclusively for trading futures on the CME Group exchange
Advisor is adapted for trading futures contracts: - E-mini Nasdaq-100 Futures
- micro E-mini Nasdaq-100 Future
The specification of the E-mini Nasdaq-100 Future contract is available at the following link on the exchange website:
https://www.cmegroup.com/trading/equity-index/us-index/e-mini-nasdaq-100_contract_specifi

The Rise of Sky walker is a trend indicator is a powerful indicator for any par and any timeframe. It doesn't requires any additional indicators for the trading setup.The indicator gives clear signals about opening and closing trades.This Indicator is a unique, high quality and affordable trading tool. Can be used in combination with other indicators Perfect For New Traders And Expert Traders Low risk entries. Never repaints signal. Never backpaints signal. Never recalculates signal. Great Fo

The Rise of Skywalker: It is an advanced trading system. This is a fully automatic Expert Advisor, which allows you to presize the trade according to the preferences of the trader. Is a revolution in the customization of the trading. The Rise of Skywalker is a expert advisor based in the indicator The Rise of Sky walker: ( https://www.mql5.com/es/market/product/44534 ) This system uses only one trade in each operation. Do not use Grip or martingale Low risk system since it h

Crossing of market price and moving average with all kinds of alerts and features to improve visualization on the chart.
Features Crossing of market price and Moving Average (MA) at current bar or at closing of last bar; It can avoid same signals in a row, so it can allow only a buy signal followed by a sell signal and vice versa; MA can be set for any of the following averaging methods: Simple Moving Average (SMA), Exponential Moving Average (EMA), Smoothed Moving Average (SMMA), Linear-we
This indicator is fully user-adjustable, calculates corellation between all symbols, which you want. Indicator is real-time updated and fully automated. You can adjust a lot of parameters.
Calculation Parameters List of symbols: write all symbol, which you want to calculate, just separate them by comma Calculated bars: amount of bars from which will be calculated Time frame: time period of calculation Used price: used price - 0 (CLOSE), 1 (OPEN), 2 (HIGH), 3 (LOW), 4 (MEDIAN), 5 (TYPICAL), 6 (

Goliath MT5 - scalper fully automated Expert Advisor for medium-volatile forex markets
P roperties: The Library trades 10 currency pairs (USDCHF, EURCHF, EURGBP, AUDUSD, USDCAD, GBPUSD, EURUSD, NZDUSD, CADCHF, EURAUD, EURCAD, AUDJPY) The Library does not use martingale The Library sets a fixed stop loss and take profit for all orders The Library only trades a user input volume The Library can be installed on any currency pair and any timeframe Recommendations: Before using on a real account, t

The adviser uses a strategy based on the use of custom indicators; trading is carried out on 4 time frames. The expert uses the adaptive system for determining market entries for trading, which determines the most appropriate moment for opening an order. The adviser trades according to numerous patterns on currency pairs. The adviser uses economic news to achieve more accurate signals. Hidden Stop loss, Take Profit, Break Even and Trailing Stop are used. Use multicurrency testing for 11 currency

- This is an indicator of directional movement that allows you to determine the trend at the time of its inception and set the levels of a protective stop.
Trailing can be carried out both from below, when the stop level is below the current price and is pulled up behind the price if it increases, and above, when stop levels are above the current price.
Unlike trailing with a constant distance, the stop level is set at the lower boundary of the quadratic regression channel (in the case of tra

Powerful trend indicator provided with all necessary for trade and it is very easy to use. Everyone has probably come across indicators or Expert Advisors that contain numerous input parameters that are difficult to understand. But here, input parameters are simple and it is no need to configure anything — neural network will do all for you.
Difference from a classic version
The real-time multi time frame panel is added, so you can check a trend for other timeframes without switching the schedu

KT CCI Divergence robot is a 100% automated expert advisor that trades regular and hidden divergence built between the price and Commodity Channel Index (CCI) oscillator. The divergence signals are fetched from our freely available CCI divergence indicator.
Not every divergence ends up in a successful price reversal, that is why this ea combines the raw divergences signals with its inbuilt technical analysis module to exploit the price inefficiency that occurs after some selected divergence si

KT Stochastic Divergence robot is a 100% automated expert advisor that trades regular and hidden divergence built between the price and Stochastic oscillator. The divergence signals are fetched from our freely available Stochastic Divergence indicator.
Not every divergence ends up in a successful price reversal, that's why this ea combines the raw divergences signals with its inbuilt technical analysis module to exploit the price inefficiency that occurs after some selected divergence signals.

Introduced expert system works with the EURUSD currency pair and only with it. This system implemented the principle of five orders - that is, a maximum of five orders can be placed in one direction, after which the total position of the series should be closed by stops, either real or virtual. The trading system is designed to work separately with a series of buy orders and separately with a series of sell orders. which makes the trading system versatile enough. The expert passes all types o

Trend Catchers the expert system works on all types of accounts, both netting and hedging. The basic unit of analysis is a tick, not a bar. It works with 5-digit quotes. Requotes are critical, a broker is required with minimal delays in execution.
The expert system uploads historical data online, creating its own database stored in RAM. On reboot, it is lost and on a new boot, it must be downloaded again. To achieve good results in real tick mode on the tester, it is necessary to carry out opt

RageX EA is an unique fully automated EA which analyses current market trend on time-frame basis. Thanks to that it makes performance of this EA stable regardless the current market condition like slippage, execution speed, etc. Every order is protected by automatically calculated stop-loss. RageX EA successfully passed 100% quality data back-tests in Metatrader 5 with different execution speed as well as back-tests with 99.90% quality historical data and variable spread in Metatrader 4. Link

KT Power Pennant finds and marks the famous pennant pattern on the chart. A pennant is a trend continuation pattern with a significant price movement in one direction, followed by a period of consolidation with converging trend-lines.
Once a pennant pattern is formed, a buy/sell signal is provided using a bullish or bearish breakout after the pattern formation. MT4 Version is available here https://www.mql5.com/en/market/product/44713
Features
Pennant patterns provide a low-risk entry after

The Rise: It is an advanced trading system. This is a fully automatic Expert Advisor, which allows you to presize the trade according to the preferences of the trade.
Is a revolution in the customization of the trading. The Rise is a expert advisor based in the indicator The Rise of Sky walker: ( https://www.mql5.com/es/market/product/44511 ) This system uses operations groups, which always beat the market
You can download the demo and test it yourself.
Very stable gro
This app supports customer investments with equipment financing and leasing solutions as well with structured chat Our success is built on a unique combination of risk competence, technological expertise and reliable financial resources.
Following topics are covered in the Trading Support Chat -CUSTOMISATION -WORKFLOW -CHARTING TIPS -TRADE ANALYSIS
PLEASE NOTE That when the market is closed, several Brokers/Metatrader servers do not update ticks from other timeframes apart from the current on

Trend indicator Carina . The implementation of the trend indicator is simple - in the form of lines of two colors. The indicator algorithm is based on standard indicators as well as our own mathematical calculations. The indicator will help users determine the direction of the trend. It will also become an indispensable adviser for entering the market or for closing a position. This indicator is recommended for everyone, both for beginners and for professionals.
How to interpret information fr

Horizontal Volumes Indicator - using a histogram, displays the volume of transactions at a certain price without reference to time. At the same time, the histogram appears directly in the terminal window, and each column of the volume is easily correlated with the quote value of the currency pair. The indicator practically does not require changing the settings, and if desired, any trader can figure them out.
The volume of transactions is of great importance in exchange trading, usually an inc

*Non-Repainting Indicator Arrow Indicator with Push Notification based on the Synthethic Savages strategy for synthethic indices on binary broker.
Signals will only fire when the Synthethic Savages Strategy Criteria is met BUT MUST be filtered.
Best Signals on Fresh Alerts after our Savage EMA's Cross. Synthethic Savage Alerts is an indicator that shows entry signals with the trend. A great tool to add to any chart. Best Signals occur on Fresh Alerts after our Savage EMA's Cross + Signals on

Expert adviser uses a breakout strategy when opening all orders without exception. Trading is conducted exclusively by pending orders. Entry points are located at local minimums and maximums, some levels are excluded with the internal filter of the EA. The maximum number of orders is set in the settings. The EA automatically determines the number of digits in quotes, so the user does not need to think about it and make the appropriate changes to the settings. You can use any type of account, suc

mql4 version: https://www.mql5.com/en/market/product/44606 Simple indicator to calculate profit on fibonacci retracement levels with fixed lot size, or calculate lot size on fibonacci levels with fixed profit. Add to chart and move trend line to set the fibonacci retracement levels. Works similar as default fibonacci retracement line study in Metatrader. Inputs Fixed - select what value will be fix, lot or profit Fixed value - value that will be fix on all levels Levels - levels for which
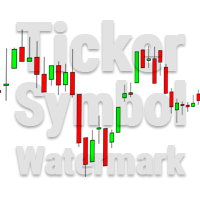
This utility tool draws the ticker symbol and timeframe information as a watermark in the background of the chart. It may come in handy if you have multiple charts on the screen at the same time. Inputs: Font Name: You can change text font by typing in the name of your favorite font installed on your operating system. (e.g.: Verdana, Palatino Linotype, Roboto, etc...) Font Color: You can choose your favorite from the available colors or type in a custom RGB color (values from 0 to 255, e.g.:

The Candlestick Patterns indicator for MT5 includes 12 types of candlestick signales in only one indicator. - DoubleTopsAndBottoms - SmallerGettingBars - BiggerGettingBars - ThreeBarsPlay - TwoBarsStrike - Hammers - InsideBars - OutsideBars - LongCandles
- TwoGreenTwoRed Candles - ThreeGreenThreeRed Candles The indicator creats a arrow above or under the signal candle and a little character inside the candle to display the type of the signal. For long candles the indicator can display the exact
This indicator measures the largest distance between a price (high or low) and a moving average. It also shows the average distance above and below the moving average. It may come in handy for strategies that open reverse positions as price moves away from a moving average within a certain range, awaiting it to return so the position can be closed. It just works on any symbol and timeframe. Parameters: Moving average period : Period for moving average calculation. Moving average method : You can

Versão Darkray para Bolsa de Valores (Ações, Fundos Imobilirários, contratos futuros, etc.) O Robô DarkrayB3EA usa uma estratégia baseada no retorno a média, conjugada a detecção de zonas de exaustão de compra e de venda. Indicadores disponíveis para configurações de setups: EMA200 à Média móvel de 200 períodos (podem ser usados outros períodos com ótimos resultados também); RSI à Verifica os níveis de sobre venda para abertura das vendas e sobre compra para abertura das compras; ADX à Veri

Indicador Taurus All4 Taurus All4
O Taurus All4 é um indicador de alta performance, ele indica a força da tendência, e você pode observar a força da vela.
Nosso indicador possui mais de 4 confirmações de tendência.
Ele é bem simples e fácil de usar.
Modos de confirmação Confirmações de Tendência da Vela: Quando uma vela muda para verde claro a tendência é alta. Quando uma vela muda para vermelho claro a tendência está revertendo para baixo. Quando uma vela muda para vermelho e

Parâmetros: Ativar modo EA (robô) se você deixar true ele vai virar um robô, se você deixar false ele vai virar um indicador. Volume inicial VolumeDinamico se você deixar ativado vai ser lote automático Proporção: Exemplo: se você colocar 500 a cada 500$ ele vai abrir um lote de 1.0 Lucro diário se deixar em R$,0 ele não vai ser ativado, se atingir o lucro diário ele para de operar. Stop diário aqui você tem que colocar valor negativo -R$ se você deixar 0 ele não vai ser ativado. % do DOM
Rectangle Detector Alert
About Rectangle Detector Alert Indicator
Rectangle detector alert detects manually drawn rectangle shapes on charts and sends out push notifications
also auto extending the rectangles at the same time as new candles form.
The concept behind this indicator is based on the manual trading of supply and demand zones. Most traders prefer
to draw their supply (resistance) and demand (support) zones manually instead of depending on indicators to auto draw
the zones.

A ideia principal desse produto é gerar estatísticas baseadas em sinais de 5 estratégias diferentes para os traders de Opções Binárias, mostrando como seria os resultados e o saldo final baseado em quanto a corretora paga de payout. Estratégia 1: O cálculo é secreto. Estratégia 2: O sinal é baseado em uma sequência de candles do mesmo lado. Estratégia 3: O sinal é baseado em uma sequência de candles intercalada. Estratégia 4: O sinal é composto pelos indicadores bollinger (sendo que temos 3 tip

Este produto é um conjunto de ferramentas que auxiliam o trader a tomar decisões, trazendo informações de diferentes categorias que se complementam: tendência, suporte/ resistência e padrões de candle. Ele possui também um painel com informações sobre o saldo. A tendência possui dois cálculos diferentes e é mostrada em forma de coloração de candles. A estratégia 1 é mais longa, possuindo 3 estados diferentes: tendência de alta, de baixa e neutra. Já a estratégia 2 possui uma resposta mais rápi

Esse robô só opera 20 minutos por dia durante a abertura do mercado!
Recomendado para mini Índice e mini dólar!
Parametros:
Volume inicial (recomendado: 1 pra R$300) Ativar volume automático Saldo proporção x volume Volumes seguintes (separar por ,) TakeProfit (gain, 0 ñ usa) MaxOrders Ativar função trailing stop Pontos de lucro p/ acionar trailing Distância do stoploss no trailing
DistCanal
Derrapagem máxima CriarLinhasRompimento = false; CorLinhasRompimento =

Fibonacci Múltiple 12, utiliza la serie fibonacci plasmado en el indicador fibonacci, aumentadolo 12 veces según su secuencia. El indicador fibonacci normalmente muestra una vez, el presente indicador se mostrara 12 veces empezando el numero que le indique siguiendo la secuencia. Se puede utilizar para ver la tendencia en periodos cortos y largos, de minutos a meses, solo aumentado el numero MULTIPLICA.

Panthers Traders presents the new Expert Advisor "MRK TRADER", a robot for Forex, Indices, Commodities and Cryptocurrencies. This expert advisor works hedge strategies, has different variables to configure each other, works as a work tool or as a 100% automatic expert advisor, if you do not have experience, for your greater profitability, get in touch by private and I will explain your different variables and how to apply them in different assets, I recommend watching the videos of the YouTube

The indicator for trading on the signals of the harmonic pattern AB=CD. It gives signals and shows the levels of entry into the market, as well as levels for placing stop orders, which allows the trader to make timely decisions on entering the market, as well as effectively manage positions and orders. It supports sending push notifications to a mobile device, e-mail, as well as alerts. This indicator has been ported from the version for MetaTrader 4. For more information, as well as a detailed

Este EA trabalha com uma das melhores estratégias de saída de posição, o grid. Mas não é um grid comum. Nesse EA essa estratégia está otimizada ao extremo para dar a você a melhor performance, com várias opções de configurações para trabalhar de forma mais segura e lucrativa. Além disso, ele gerencia em um único gráfico vários ativos ao mesmo tempo, fazendo-os se complementarem para fazer um gerenciamento único.
Exelente Robô para Mini Indice e Mini Dolar!
No minindice você pode ativar o trai

Inside the Black Hole It is an advanced trading system. This is a fully automatic Expert Advisor.
Inside the black hole. It is a 100% automatic system, the system controls both the inputs and the batches, the operator just has to place the robot on the graph and let it act It is an ideal system for people who do not want complications or strange configurations. The system is self-sufficient, performing all the work. Is a revolution in the customization of the trading. You can dow

Backtest from 2003-2019 MetaQuotes Data Every Tick Mode
EA created for EURUSD H1
Open transaction based on MA and Volume
Close transaction based on RSI or take profit
One transaction at the time.
No adding position, no martingale, no grid.
My recommendations: For "safe mode" i recommend 0.1 lot per 10000USD
For "risky mode" i recommend 0.5 lot per 10000USD
Personally i use 0.3 lot per 10000 USD
Fell free to increase lot size while you earn.
This EA does not open transaction everyday, b

The RiseTrading is a unique High quality and easy to use and affordable trading tool because we have incorporated a number of proprietary features and MACD and Stochastic indicators. The main advantages of the trend trading strategy used by the Expert Advisor are opening positions only in the direction of a trend, ability for the long-term retention of profitable positions allowing users to achieve good combinations of profit/loss distributions. That can work on a real account at any broker with

Panthers Traders presents the new Expert Advisor "MRK TRADER", a robot for Forex, Indices, Commodities and Cryptocurrencies. This expert advisor works hedge strategies, has different variables to configure each other, works as a work tool or as a 100% automatic expert advisor, if you do not have experience, for your greater profitability, get in touch by private and I will explain your different variables and how to apply them in different assets, I recommend watching the videos of the YouTube

1. Why did I develop this series of indicators
I found that most traders need to use multiple time frame indicators. They usually switch time frame to see indicators. However, once the timeframe is switched, you cannot see the corresponding relationship between the price in the smaller timeframe and the indicator in the larger timeframe . For example: if your price chart is in H1 timeframe, you can see H4, D1 and W1 indicators in H1 timeframe Chart. This is more helpful for you to find th
Você sabe por que o mercado MetaTrader é o melhor lugar para vender as estratégias de negociação e indicadores técnicos? Não há necessidade de propaganda ou software de proteção, muito menos problemas de pagamentos. Tudo é providenciado no mercado MetaTrader.
Você está perdendo oportunidades de negociação:
- Aplicativos de negociação gratuitos
- 8 000+ sinais para cópia
- Notícias econômicas para análise dos mercados financeiros
Registro
Login
Se você não tem uma conta, por favor registre-se
Para login e uso do site MQL5.com, você deve ativar o uso de cookies.
Ative esta opção no seu navegador, caso contrário você não poderá fazer login.