YouTube'dan Mağaza ile ilgili eğitici videoları izleyin
Bir alım-satım robotu veya gösterge nasıl satın alınır?
Uzman Danışmanınızı
sanal sunucuda çalıştırın
sanal sunucuda çalıştırın
Satın almadan önce göstergeyi/alım-satım robotunu test edin
Mağazada kazanç sağlamak ister misiniz?
Satış için bir ürün nasıl sunulur?
MetaTrader 5 için Uzman Danışmanlar ve göstergeler - 103

Go Depth of Market This product helps to watch the order book in a easily and friendly way, helping traders to take decisions that are more consistent with the timing of the market.
Parameters: Activating EA (robot) mode if you leave true it will become a robot, if you leave false it will become an indicator. Initial volume VolumeDynamic if you leave it enabled will be automatic batch Proportion: Example: If you put 500 every 500 $ it will open a lot of 1.0 Takeprofit Stoploss Daily pr
Rectangle Detector Alert
About Rectangle Detector Alert Indicator
Rectangle detector alert detects manually drawn rectangle shapes on charts and sends out push notifications
also auto extending the rectangles at the same time as new candles form.
The concept behind this indicator is based on the manual trading of supply and demand zones. Most traders prefer
to draw their supply (resistance) and demand (support) zones manually instead of depending on indicators to auto draw
the zones.

The main idea of this product is to generate statistics based on signals from 5 different strategies for the Binary Options traders, showing how the results would be and the final balance based on broker's payout.
Strategy 1: The calculation is secret. Strategy 2: The signal is based on a sequence of same side candles (same color). Strategy 3: The signal is based on a sequence of interspersed candles (opposite colors). Strategy 4: The signal consists of the indicators bollinger (we have 3 type

This product is a set of tools that help the trader to make decisions, bringing information from different categories that complement each other: trend, support / resistance and candle patterns. It also has a panel with information about the balance. The trend has two different calculations and is shown as colored candles. Strategy 1 is longer, having 3 different states: up, down and neutral trend. Strategy 2 has a faster response and has only 2 states: up and down trend. Support and resistance

This robot only operates 20 minutes a day during market opening! Recommended for mini Index and mini dollar!
Parameters:
Initial Volume (recommended: 1 to $ 300) Enable auto volume Ratio x volume balance Subsequent volumes (separate by,) TakeProfit (gain, 0 ñ use) MaxOrders Enable trailing stop function Profit points for triggering trailing Trailing stoploss distance
DistChannel
Maximum skidding CreateRowsBreakup = false; ColorRowsRup = clrGold; MagicNumber (ID #)

Fibonacci Múltiple 12, utiliza la serie fibonacci plasmado en el indicador fibonacci, aumentadolo 12 veces según su secuencia. El indicador fibonacci normalmente muestra una vez, el presente indicador se mostrara 12 veces empezando el numero que le indique siguiendo la secuencia. Se puede utilizar para ver la tendencia en periodos cortos y largos, de minutos a meses, solo aumentado el numero MULTIPLICA.

Panthers Traders presents the new Expert Advisor "MRK TRADER", a robot for Forex, Indices, Commodities and Cryptocurrencies. This expert advisor works hedge strategies, has different variables to configure each other, works as a work tool or as a 100% automatic expert advisor, if you do not have experience, for your greater profitability, get in touch by private and I will explain your different variables and how to apply them in different assets, I recommend watching the videos of the YouTube

The indicator for trading on the signals of the harmonic pattern AB=CD. It gives signals and shows the levels of entry into the market, as well as levels for placing stop orders, which allows the trader to make timely decisions on entering the market, as well as effectively manage positions and orders. It supports sending push notifications to a mobile device, e-mail, as well as alerts. This indicator has been ported from the version for MetaTrader 4. For more information, as well as a detailed

This EA works with one of the best exit strategies, the grid. But it's not an ordinary grid. In this EA, this strategy is optimized to the extreme to give you the best performance with multiple configuration options to work more safely and profitably. In addition, it manages multiple pairs on a single chart at a time, making them complement each other to make a single management.
Parameters: Initial lot: is the lot of the first position of the cycle Allow dynamic initial lot (true/false) : cal

Inside the Black Hole It is an advanced trading system. This is a fully automatic Expert Advisor.
Inside the black hole. It is a 100% automatic system, the system controls both the inputs and the batches, the operator just has to place the robot on the graph and let it act It is an ideal system for people who do not want complications or strange configurations. The system is self-sufficient, performing all the work. Is a revolution in the customization of the trading. You can dow

Backtest from 2003-2019 MetaQuotes Data Every Tick Mode
EA created for EURUSD H1
Open transaction based on MA and Volume
Close transaction based on RSI or take profit
One transaction at the time.
No adding position, no martingale, no grid.
My recommendations: For "safe mode" i recommend 0.1 lot per 10000USD
For "risky mode" i recommend 0.5 lot per 10000USD
Personally i use 0.3 lot per 10000 USD
Fell free to increase lot size while you earn.
This EA does not open transaction everyday, b

The RiseTrading is a unique High quality and easy to use and affordable trading tool because we have incorporated a number of proprietary features and MACD and Stochastic indicators. The main advantages of the trend trading strategy used by the Expert Advisor are opening positions only in the direction of a trend, ability for the long-term retention of profitable positions allowing users to achieve good combinations of profit/loss distributions. That can work on a real account at any broker with

Panthers Traders presents the new Expert Advisor "MRK TRADER", a robot for Forex, Indices, Commodities and Cryptocurrencies. This expert advisor works hedge strategies, has different variables to configure each other, works as a work tool or as a 100% automatic expert advisor, if you do not have experience, for your greater profitability, get in touch by private and I will explain your different variables and how to apply them in different assets, I recommend watching the videos of the YouTube

1. Why did I develop this series of indicators
I found that most traders need to use multiple time frame indicators. They usually switch time frame to see indicators. However, once the timeframe is switched, you cannot see the corresponding relationship between the price in the smaller timeframe and the indicator in the larger timeframe . For example: if your price chart is in H1 timeframe, you can see H4, D1 and W1 indicators in H1 timeframe Chart. This is more helpful for you to find th


Running in AUDUSD, automatic trading USDCAD and UCDNOK, EA is a trend hedging strategy, not doubling, not gridding, not too many parameters need to be adjusted simply and practically. Parameter settings: Transaction: EA only works when Transaction=true. Lots: order quantity. SL_money: A list of all currencies to be liquidated in a unified way for the amount of losses. Less_stop: If the net value is less than what, the warehouse will not be opened. Recommended platform: ECN, other platforms with

1. Why did I develop this series of indicators
I found that most traders need to use multiple time frame indicators. They usually switch time frame to see indicators. However, once the timeframe is switched, you cannot see the corresponding relationship between the price in the smaller timeframe and the indicator in the larger timeframe . For example: if your price chart is in H1 timeframe, you can see H4, D1 and W1 indicators in H1 timeframe Chart. This is more helpful for you to find th

Hello all friends What I will present today is a grid system that doesn't have grid. Its work is Open to buy and sell at the same time. Or choose to open either side in the settings. The weakness of this system is that when the graph runs one way for a long time, it is very damaged. I have prepared a function for reducing damage.Details about how to set up according to the youtube link.

Attention: New update - 4 major practicality improvements!
1) Alarm 2) Midas text value 3) Click panel 4) Can be connected to an EA to operate in semi-automatic mode
Attention - This indicator does not work perfectly in backtest due to MT5 peculiarities (Reading hotkeys or panel clicks) . My suggestion is that you test Automatic Vwap Midas which has automatic operation to analyze the calculation and then buy Start if you think the indicator will match your operating.
This indicator is use

Just $10 for six months!!!. This will draw Order Blocks just by clicking on a candle. It will use the body or the wicks. It can also draw the mean threshold of the candle open/close or high/low. As a drawing tool, it is not active all the time after adding it to the chart. Activate by pressing 'b' twice on the keyboard within a second. If activated but then decided not to draw, deactivate by pressing 'b' once. Box color depends if candle is above or below current price. Settings/Inputs: Number

Just $10 for six months!!! Displays previous weeks Highs & Lows. You can set the number of weeks to display levels for, also the line style, color and width. This is very useful for traders using the BTMM and other methods like ICT. I'll be creating more indicators for MT5 for the BTMM. Send me your suggestions to my Telegram: https://t.me/JDelgadoCR Take a look at my other products at: https://www.mql5.com/en/users/jdelgadocr/seller

Just $10 for six months!!! Displays previous days Highs & Lows. You can set the number of days to display levels for, also the line style, color and width. This is very useful for traders using the BTMM and other methods like ICT. I'll be creating more indicators for MT5 for the BTMM. Send me your suggestions to my Telegram: https://t.me/JDelgadoCR Take a look at my other products at: https://www.mql5.com/en/users/jdelgadocr/seller

Strategy Description: This EA is a trend EA. The idea is the simplest trading method of chasing up and down. It is used to cut off losses in time with mobile stop loss to make profits run. This EA mainly trades EURUSD and XAUUSD. Parameter settings: Transaction: EA will only work if Transaction=true. Lots: Single hand count, it is recommended to order 1 standard hand at 10000USD, i.e. 0.1 hand at 1000USD. Maxi_point: Maximum point difference limit. It depends on the decimal number of gold quotat
The DYJ Williams Percent Range is a unique High quality and easy to use and affordable trading tool because we have incorporated a number of proprietary features and Williams' Percent Range indicators. The Indicator values ranging between -80% and -100% indicate that the market is oversold. Indicator values ranging between -0% and -20% indicate that the market is overbought. Input Parameters WPR settings InpSpread = 50 -- When the spread is greater than or equal to 50, the signal is ignor

The expert trades at the opening of the market after the weekend, focusing on the price gap (GAP). Various sets of settings are ready (trading against or towards the GAP). At the same time, various options are available in the expert settings, allowing you to create your own unique sets yourself. Download settings (sets): https://www.mql5.com/en/blogs/post/747929 Currency pairs for which the sets have been developed: GBPUSD, AUDUSD, NZDUSD, USDCAD, EURGBP, EURCHF, GBPCAD, GBPAUD, AUDCHF, AUD
Unique trend trading algorithm with advanced filtering and many features which should become a part of your trading arsenal. This indicator can give you also trading advisors (with take profit target), success rate scanner and much more.
Important information
For additional detailed information you can visit the 747Developments website.
Features Easy to use (just drag and drop to the chart) Possible to use with any trading instrument Possible to use on any time-frame Take profit advisors Succ
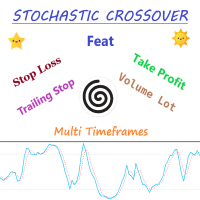
Expert Advisor Description - Basically, EA will open position in case of cross between main line and signal line on stochastic. - Unique to this EA, using the two pre-set stochastic so that the EA can open the trade position. - The first stochastic determines the cross, while the second stochastic determines the overbought or oversold levels.
Parameters Description - Volume_Lot => Number of lots determined from the balance percentage. Example Balance = 1.000 USD, Volume Lot = 100, Then lot i

Stairway to heaven It is an advanced trading system. This is a fully automatic Expert Advisor. ONLY TWO INPUT TO SELECT FOR THE TRADER 20 YEARS BT IN DIFERENT PAIRS Stairway to heaven . It is a 100% automatic system, the system controls both the inputs and the batches, the operator just has to place the robot on the graph and let it act It is an ideal system for people who do not want complications or strange configurations. The system is self-sufficient, performing all the work.

L'indicateur montre Sur le graphique de la zone de profit (Profit Zone) affichant le début et la fin de la tendance locale Profit Zone PRO est parfait pour tous les symboles meta Trader: devises, métaux, crypto-monnaies, actions et indices
Suivi des comptes réels: ici Profit Zone Expert Advisor for auto trading: here
Avantages de l'indicateur Profit zone PRO:
Signaux d'entrée sans redessiner Les algorithmes de l'indicateur vous permettent de trouver les moments idéaux pour entrer dans

Expert Advisor Description Strategy using two classic indicators in MetaTrader, stochastic oscillator and moving average Accompanied by multi timeframe and parameter that can be changed according to the strategy that suits you
Feature Money Management : Stop Loss, Take Profit, Trailing Stop Trading Option : Stochastic Oscillator, two Moving Average, Multi Timeframes https://youtu.be/3dXAUUnxg1s
youtubeembedcode.com/pl/ http://add-link-exchange.com

This indicator is based on the ICCI.
If a long pattern is detected, the indicator displays a buy arrow.
If a short pattern is detected, the indicator displays a sell arrow. Settings
CCI Period - default set to (14) Features
Works on all currency pairs and timeframes
Draws Arrows on chart Colors
Line Color
Line Width
Line Style
Arrow Color This tool can help you analyse the market and indicates market entry.

Backtest from 2015-2019 MetaQuotes Data Every Tick Mode.
Start depo 10000 USD Lot size: 0,5 (You can modify it but maintain the ratio)
EA created for EURUSD M15
Open transaction based on RVI + Momentum + MA Crossover
Close transaction based on Stochastic
The parameters of indicators have been optimized.
Change manually only lot size.
EA does one transaction at the time.
No adding position, no martingale, no grid.
To avoid risky situations.
Fell free to increase lot size while you
The DYJ Average Directional Movement Index is a unique High quality and easy to use and affordable trading tool because we have incorporated a number of proprietary features and Average Directional Movement Index indicators. The DYJ ADX recommends buying when +DI is higher than -DI, and selling when +DI sinks lower than -DI. MT5 real account video demo: https://youtu.be/McRzAkyP5I0 Input Parameters ADX settings InpADXPeriod = 14 -- ADX: averaging period InpADXLevel = 40 -- ADX Level

The DYJ Moving Average Cross is a unique High quality and easy to use and affordable trading tool because we have incorporated a number of proprietary features and Moving Average indicators. The Indicator is based on the following idea: crossing of two Moving Average lines (Fast and slow ) is used as a signal for opening and closing a position together. Go Long when Fast MA (MA1) crosses above Slow MA (MA2). Go Short when Fast MA (MA1) crosses below Slow MA (MA2). The EA uses dynamic alloca

Ondas de Divergência. Antes do mercado tomar um sentido e se manter em tendencia, existem sinais que podem ser lidos, nos permitindo assim entender o "lado mas forte", e realizar trades de maior probabilidade de acerto com risco reduzido, esses movimentos são persistentes e contínuos, proporcionando excelente rentabilidade. Ondas de Divergência é um histograma que acumula a divergência de entre preço e volume a cada tick, permitindo assim encontrar pontos de absorção, áreas de acumulo e distrib
MetaTrader mağazası, geçmiş verilerini kullanarak test ve optimizasyon için alım-satım robotunun ücretsiz demosunu indirebileceğiniz tek mağazadır.
Uygulamaya genel bakışı ve diğer müşterilerin incelemelerini okuyun, doğrudan terminalinize indirin ve satın almadan önce alım-satım robotunu test edin. Yalnızca MetaTrader mağazasında bir uygulamayı tamamen ücretsiz olarak test edebilirsiniz.
Alım-satım fırsatlarını kaçırıyorsunuz:
- Ücretsiz alım-satım uygulamaları
- İşlem kopyalama için 8.000'den fazla sinyal
- Finansal piyasaları keşfetmek için ekonomik haberler
Kayıt
Giriş yap
Gizlilik ve Veri Koruma Politikasını ve MQL5.com Kullanım Şartlarını kabul edersiniz
Hesabınız yoksa, lütfen kaydolun
MQL5.com web sitesine giriş yapmak için çerezlerin kullanımına izin vermelisiniz.
Lütfen tarayıcınızda gerekli ayarı etkinleştirin, aksi takdirde giriş yapamazsınız.