Conheça o Mercado MQL5 no YouTube, assista aos vídeos tutoriais
Como comprar um robô de negociação ou indicador?
Execute seu EA na
hospedagem virtual
hospedagem virtual
Teste indicadores/robôs de negociação antes de comprá-los
Quer ganhar dinheiro no Mercado?
Como apresentar um produto para o consumidor final?
Expert Advisors e Indicadores para MetaTrader 5 - 97

Create custom alerts and advanced alerts based on price and indicator data, setup dynamic alert messages, and send these MT5 alerts to Telegram, Discord, webhooks, mobile, and more. Stay in control of your trades with Smart Alert Manager , a powerful utility for MT5 that lets you create fully customizable alerts.
Whether you’re tracking price action or monitoring indicator signals, this tool ensures you never miss an opportunity.
It’s easy to set up, flexible to customize, and sending alerts acr

Volume Above Average Indicator - MQL5 Introduction The Volume Above Average Indicator is a custom indicator for the MetaTrader 5 (MQL5) platform that helps traders identify the current trading volume compared to the historical average. The indicator uses three different sensitivity levels to classify volume into weak, medium, and strong, providing a clear visualization of market momentum. Key Features Displays trading volume in a separate window. Compares the current volume with the historical a
FREE
Мультивалютный индикатор в отдельном окне отображает движение валютных пар в пунктах с расхождением от начала дня. Во время работы, динамически возможно включать и отключать различные пары прямо на графике. При первом запуске, возможно, потребуется продолжительное время, пока загрузиться история для основных валютных пар. Расчет всех кроссов происходит на основе мажоров. Для валют CAD, CHF, JPY - график перевернут. При повторном открытии, все настройки индикатора восстанавливаются автоматически.
FREE

A tool for creating Bill Williams indicators Our tool provides the ability to set Bill Williams indicators on a chart with a mouse click. - The Awesome Oscillator (AO) indicator helps to assess the driving force of the trend. - Alligator indicator — determines the current state of the trend and possible entry and exit points. - Fractals indicator — helps to identify significant levels - Accelerator Oscillator (AC) indicator — shows the change in trend acceleration. - Market Facilitation Index
FREE

Trade Manager – BreakEven e Stop Loss Global com um clique
Este Expert Advisor (EA) foi desenvolvido para ajudar os traders a gerir as suas posições de forma mais rápida e eficiente. Ele traz duas funções principais, acessíveis através de botões diretamente no gráfico:
Função BreakEven:
Move instantaneamente todas as operações abertas para o preço de entrada com um único clique.
Opção de adicionar uma margem configurável (ex. +2 pips) para cobrir spreads ou comissões.
Função Stop Lo
FREE

This Expert Advisor trades news on any timeframe. The news are downloaded from the Forex Factory website. Make sure to add the URL to the terminal settings. Live signal : https://www.mql5.com/ru/signals/2357864?source=Site +Signals+My
The EA is launched on a single chart and defines all necessary pairs for trading on its own. The robot works with pending orders setting two Buy stop and Sell stop orders before a news release. It determines the time zones of the calendar and terminal automatica

MyHistogram MT5 O indicador MyHistogram é uma ferramenta de análise técnica poderosa projetada para ajudar os traders a visualizar a distância entre os extremos de preço e uma média móvel. Ao calcular e exibir essa distância em um formato de histograma, o indicador MyHistogram permite que os traders avaliem rapidamente as tendências do mercado, identifiquem reversões potenciais e tomem decisões de negociação mais informadas. O indicador MyHistogram é altamente personalizável, permitindo que os u
FREE

** All Symbols x All Time frames scan just by pressing scanner button ** *** Contact me to send you instruction and add you in "Divergence group" for sharing or seeing experiences with other users. Introduction MACD divergence is a main technique used to determine trend reversing when it’s time to sell or buy because prices are likely to drop or pick in the charts. The MACD Divergence indicator can help you locate the top and bottom of the market. This indicator finds Regular divergence for pul

PositionsLimiter EA: Enforcing Trade Discipline with Position Limits The PositionsLimiter EA is a powerful risk management tool designed to help traders control the number of open positions at any given time. By allowing traders to set a maximum limit on simultaneous trades, this EA ensures that no additional trades exceed the specified threshold. If a trader or another automated system attempts to open a new position beyond the set limit, the EA will automatically close the excess trade, ensur
FREE

Bundle Risk Manager Pro EA
"Risk Manager Pro EA is an all-in-one trading utility that combines advanced risk management tools, ensuring full control over your trading account while protecting your capital and complying with trading regulations. By bundling Limit Positions , Concurrent Risk Capital , and the newly added Limit Profit , this EA is the ultimate solution for disciplined trading and achieving evaluation goals. Key Features: 1. Limit Positions : Enforces a maximum number of open posi
FREE

RSI & Moving Average Expert v1.0
A fully automated trading robot that combines the power of two classic indicators: Moving Averages and RSI, to identify strong, low-risk entries aligned with the market trend. How it works: Uses a Fast and Slow MA crossover on M15 timeframe for signal generation. Confirms trend direction using a higher timeframe EMA (default H1, 100-period). Applies RSI filtering to avoid false breakouts and extreme zones. Calculates lot size dynamically based on account risk
FREE

O indicador de intervalo de tempo Wormhole para MetaTrader 5 (MT5) não é apenas mais uma ferramenta de negociação—é sua vantagem competitiva nos mercados financeiros. Projetado tanto para traders iniciantes quanto profissionais, o Wormhole transforma a forma como você analisa dados e toma decisões, garantindo que você esteja sempre um passo à frente. Por que você precisa do indicador Wormhole Supere a concorrência: A capacidade de visualizar dois intervalos de tempo no mesmo gráfico simultaneame
FREE

This reliable, professional trade copier system is without a doubt one of the best on the market, it is able to copy trades at very fast speeds from one master account (sender) to one or multiple slave accounts (receivers). The system works very fast and mimics the master account a full 100%. So changing stop losses, take profits, pending orders on the master account is executed on the slave accounts too, like each other action. It is a 100% full copy (unlike many other copiers who only copy ma
FREE

We have all seen a currency pair enter the overbought or oversold territory and stay there for long periods of time. What this indicator does is gives you the emphasis. So if you are looking for reversals then you may want to take notice when oversold territory is entered into with a bullish engulfing candle or if the trend is your thing then check for bearish engulfing candles while entering oversold. This indicator will show a downward arrow when it detects a bearish engulfing candle while cro
FREE

For those Price Action traders who love to trade strong Price points, like today's Opening Price (or even yesterday's Price), here is an indicator to ease the identification of those values, drawn directly on your chart! Opening Price will automatically draw a line showing you this point for you, AND, if you like any OPENing price in the past, not just today's price. A must-have in your Price Action toolbox!
SETTINGS
How many past days do you want to be drawn? Do you want to draw the current da
FREE
This is a free helper indicator for MT5 that will help traders setup their constant volume charts depending on their trading style. It will calculate the number of ticks that your constant volume chart should have depending on the following trading styles: Scalper Active Day trader Day trader Swing trader Position trader Instruction video attached.
Enjoy!
FREE

I’m sharing this EA here for free to support the trading community. I hope it’s helpful, and don’t hesitate to reach out if you have any questions or feedback!
Requirements
Trading pairs all trending Pairs especially USDJPY
Timeframe M1 to H6
Minimum deposit $ 100 Leverage 1:200 Brokers Hedging Pro or ECN Account
Key Features: Versatile Timeframe Trading : Operates effectively on all timeframes, from the swift M1 to the more extended D1, accommodating a wide range of trading strategies and
FREE

This spread indicator displays the actual spread of each candle. It highlights the maximum spread and the minimum spread of the chosen symbol. This indicator is very helpful to see in real time the spread evolution helping to avoid taking a trade when the spread is too high.
Inputs:
Print value in Points: if true displays the spread as a whole number
D isplay minimum and maximum spread of the past N days: select the number of days to consider the maximum and minimum spread
Automatically adj
FREE

** All Symbols x All Time frames scan just by pressing scanner button ** *** Contact me to send you instruction and add you in "Harmonic Scanner group" for sharing or seeing experiences with other users. Introduction Harmonic Patterns are best used to predict turning point. Harmonic Patterns give you high win rate and high opportunities for trade in during one day. This indicator detects the best and successful patterns based on Harmonic Trading concepts . The Harmonic Patterns Scanner Sc

The EA is an advanced Expert Advisor (EA) designed for automated trading on the MetaTrader platform—exclusively optimized for the EURUSD market. Developed by Dafit Kris Biantoro, this free version streamlines the trading process by removing candlestick pattern recognition inputs while still delivering essential trading functions and robust risk management. Key Features Market Specific: Tailored for the EURUSD market. Risk Management: Easily configure lot size, take profit, and stop loss to mana
FREE
TradeManagerEA — Full Trade Management Solution Overview (Short Description) The TradeManagerEA is a specialized Expert Advisor designed to manage open trades across all symbols. It provides automatic breakeven rules, trailing stops, and additional settings optimized for Gold (XAU/GOLD). This tool requires minimal user intervention and can enhance the consistency of your trading approach. Detailed Description 1. Core Features Breakeven Management : Automatically moves Stop Loss to entry price p
FREE

NewTest https://backoffice.aurum.foundation/u/DHXP1U
O indicador funciona com base em indicadores de padrão interno de indicadores, indicadores indicador consideram o desempenho atual de 30 de indicadores-padrão e dar um sinal de compra ou venda, da tendência geral de todos os destinos de outros indicadores. Os parâmetros de entrada, você pode definir configurações específicas para cada indicador. indicador de desempenho, na forma de oscilador, e mostra a tendência geral e a preponderância de
FREE

Moving Average ******************* Moving Average для платформы секундных графиков Micro . ********************* Секундный график на порядок увеличит точность ваших входов и выходов. Секундный период , в привычном формате, позволит увидеть то, что ранее было скрыто. Бесплатные индикаторы, дополнят визуальную картину, что, в совокупности выведет вашу торговлю на новый уровень. Идеально подходит как скальперам, так и трейдерам торгующим внутри дня. Индикатор Moving Average для платформы Micr
FREE

Supports displaying up to 4 trading sessions with fully adjustable start and end times. Each session can be customized individually with unique colors and visual styles. Users can choose between drawing rectangles or filling areas, while the indicator clearly displays each session’s price range for better market insight.
Free to use until the end of 2025. The paid version will be available starting from 2026.
FREE

First Minute Balance Rate Prop FTMO Broker.
Only for DE40, US100, US30. This Version works with fixed Lot. Automatic add London and US Session.
One Trade a Day when SL and TP on 10k pip. Robot Strategy: Trade open = First Tick in Direction.
TP and SL can be 10k pips for a different Balance Strategy. Write me a Message of a few Questions when you are undecided. Ex4 Code by Request.
FREE

(Gráficos de criptomoeda)
Salva todos os símbolos do Binance Future em símbolos personalizados.
Adiciona o prefixo "F" aos símbolos no Binance Future.
Ele cria a infraestrutura onde os símbolos em Binance Future podem ser seguidos.
Você deve permitir o WebRequest no menu Ferramentas >> Opções >> Consultores especialistas e adicionar o URL: https://fapi.binance.com
basta clicar duas vezes no script.
Você tem a lista inteira em segundos.
veja o produto no link https://www.mql5.com/en/mar
FREE

Moving Polynomial Regression The Moving Polynomial Regression indicator provides traders with a statistically robust and adaptive method for identifying the true trend, predicting immediate momentum shifts, and filtering market noise. Unlike traditional moving averages that simply lag the price, this tool fits an optimal polynomial curve to the market, giving you a dynamic and predictive view of price action. Key Advantages Superior Noise Filtering: Uses advanced mathematical techniques
FREE

MultiTrend Commander - Automated Trading System What is it? An automated trading software that:
Intelligently identifies market trends
Makes decisions based on multiple timeframes
Automatically manages risk
What does it do? Identify Trends Analyze the market in real time
Combine signals from different time frames (15 min, 1 hr, 4 hr)
Confirm the trend direction before entering
Protect Your Capital Automatically calculates stop losses
Adjusts trade size to your risk
Stops trading if
FREE

IMPORTANT! After the purchase please send me a private message to receive the installation manual and the setup instructions.
NebulaTrade Genesis MT5 is a powerful Expert Advisor (EA) engineered for precise US30 trading during New York market hours. Designed for both Prop Firm Challenges and Personal Accounts , it executes 1-4 high-quality trades per day , ensuring low drawdowns and strategic risk management . Unlike many EAs that rely on Martingale, Grid, or Hedging , NebulaTrade Genesis follo
Dynamic Swing Anchored Bollinger Bands (Swing Point Based) Overview Dynamic Swing Anchored Bollinger Bands is a technical analysis tool that combines swing point price structure with Bollinger Bands to create a flexible, adaptive average price zone. Instead of relying on VWAP (volume-weighted average price), this indicator anchors the calculation at Swing High/Low points and uses re-initialized Bollinger Bands that adapt to current market volatility, providing highly relevant support/resistance

This multi-timeframe indicator identifies the market's tendency to trade within a narrow price band. [ Installation Guide | Update Guide | Troubleshooting | FAQ | All Products ]
It is easy to understand Finds overbought and oversold situations Draws at bar closing and does not backpaint The calculation timeframe is customizable The red line is the overbought price The green line is the oversold price It has straightforward trading implications. Look for buying opportunities when the market is o
FREE

Configurable Opening Range Breakout EA Professional opening range breakout strategy with comprehensive filtering system and advanced risk management Strategy Overview This Expert Advisor implements the proven Opening Range Breakout (ORB) strategy, designed specifically for NYSE market hours. The EA identifies the opening range during the first 15 minutes after NYSE open and executes breakout trades when price moves beyond this range with confirmation. Core Features Risk Management Configurable

The "MA Gaussiano" indicator is a custom tool for MetaTrader 5 (MQL5) that combines a Gaussian Moving Average with colored trend candles, designed to identify market trends in a visual and innovative way. It was developed with xAI assistance in 2025 and focuses on providing a smooth and sensitive representation of prices, ideal for traders looking to filter noise in charts of currencies, stocks, or cryptocurrencies. Main Components: Gaussian MA (Colored Line): Plots a line representing the Gauss
FREE
SignalFlow Pro - Professional Trend Analysis System SignalFlow Pro is a modern trend-following indicator designed to identify market reversals accurately and timely. Key Features: Dual-Color Trend Lines: Turquoise line - uptrend Fuchsia line - downtrend Clear visual separation for easy trend identification Signal Arrows: Blue arrow (↑) - Buy signal Pink arrow (↓) - Sell signal Arrows appear automatically when trend changes Customizable Parameters: Amplitude (2) - sensitivity level Arrow codes a
FREE
Hello, traders! Welcome to the introduction of Multi Timeframe Analyzer v1.0 ! ( MT5 )
This is the Meta Trader 5 version of the "Market Meeter". Click here to Get MT4 version <<---
What is this indicator? Simply put, this indicator analyzes the market across eight different timeframes , from lower to higher, and predicts the next price direction along with an estimated continuation time. It does this by using volume, volatility, and price patterns in its calculations. Let's dive into the inf

Bem-vindo ao Indicador Provlepsis
"Provlepsis" é um indicador altamente avançado projetado para o Mercado MQL. Ao analisar barras anteriores no mesmo horário do dia, ele calcula com precisão o potencial intervalo de movimento do mercado, fornecendo informações valiosas sobre futuras flutuações de preço. Ao contrário do indicador ATR tradicional, "Provlepsis" leva em consideração o fator tempo, resultando em uma ferramenta mais poderosa que se adapta às diferentes condições de mercado. Durante a
FREE

Bears Graph is a fully automatic, professional trading robot. Designed specifically for the foreign exchange market GBPUSD, time frame M30 . This EA does not need to configure parameters. Ready to work on GBPUSD M30 . You only need to decide on the choice of the lot. Default lot is 0.1 points. Trade smarter and safer with Bears graph! Our revolutionary trading EA has a smart algorithm which detect the trend, filter out market noise and make the most accurate decisions. Enjoy maximum capital
FREE

Ganhe muito enquanto negoceia de forma inteligente!
Se deseja aumentar o seu património líquido sem stress, este sistema totalmente automatizado, versátil e adaptável, o «AI GOLD ATM», foi feito para si.
A sua função é ajudá-lo a negociar o par XAUUSD com precisão, utilizando um sistema inteligente que se adapta ao mercado para que nunca perca oportunidades lucrativas.
Preço de lançamento = $299 Preço real = $1499
O AI GOLD ATM usa algoritmos avançados para identificar negociações de alta pr
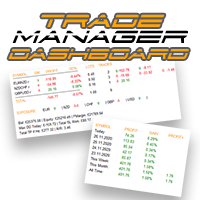
Assuma o controle de sua carteira forex. Veja instantaneamente onde você está, o que está funcionando e o que está causando dor! VERSÃO MT4 DISPONÍVEL AQUI: https://www.mql5.com/en/market/product/58375
O Painel do Trade Manager foi projetado para mostrar rapidamente onde está cada posição que você tem no mercado cambial atualmente e tornar o gerenciamento de risco e a exposição a moedas mais fáceis de entender. Para os comerciantes que escalam para o mercado gradualmente com várias posições ou

Smart Gold Trading AI. Professional XAUUSD Expert Advisor (SMC and ICT Based) Smart Gold Trading AI is a next-generation Expert Advisor designed exclusively for XAUUSD (Gold) traders who value structure, discipline, consistency, and professional market logic. It combines advanced artificial intelligence with Smart Money Concepts (SMC) and Inner Circle Trader (ICT) methodologies to analyze the market like professional and institutional traders. PLEASE ALL SCREENSHORT ARE FROM STRATEGY TESTER

A simple indicator showing the size of the spread at the current time, the maximum for the day and the maximum for the entire duration of the indicator.
Daily statistics of the maximum spread are also displayed, indicating the time when this spread was fixed.
The location of the display of the received information can be changed depending on your preferences and positioned anywhere on the screen.
It is possible to output alerts about exceeding the size of the spread specified in the input pa
FREE

If you are looking for an easy-to-use Expert Advisor, then this is what you need. No settings. All that is required of you is to choose a currency pair, a timeframe and allow automatic trading for the EA. The strategy of the expert is based on the local support and resistance levels. When a candle closes beyond any level, an order is opened in the opposite direction, expecting a price rebound. The maximum number of orders opened at a time is limited to 3. This is a safety measure, which prevents
FREE

Basing Candles indicator is an automatic indicator that detects and marks basing candles on the chart. A basing candle is a candle with body length less than 50% of its high-low range. A basing candle or basing candlestick is a trading indicator whose body length is less than half of its range between the highs and lows. That's less than 50% of its range.
The indicator highlights the basing candles using custom candles directly in the main chart of the platform. The percentage criterion can be
FREE

产品介绍 这是款非常简单有效的EA , 该EA使用布林带、AO指标以及斐波那契回调线的组合而进行工作。产品的核心理念为市场情绪的惯性交易。该EA是不考虑趋势方向的,适用于市场振幅始终的产品,多数直盘货币对均可试用。白银以及股指类慎用。
适用品种: GBP/USD JPY/USD EUR/USD
联系我: 知乎:https://www.zhihu.com/people/maysen-30 微信:maysen55
参数 介绍 开仓分数 BB、AO指标打分高于多少开仓 幻数 交易标识 布林带周期 周期,建议考虑最近5天以上数据 内偏移 偏移指数 外偏移 偏移指数(要大于内偏移) 开仓类型 固定值、资金比例 开单比例 资金比例开仓百分比 最小开仓量 固定值开仓手数 回调线观察柱数 超过柱数不再进行回调线划线
FREE

This is just a ADX with multi symbols, multi timeframes, and colors. features. different symbols and timeframes from the main chart. draw ADX and ADX moving average. easy to identify if ADX is above 25 or not. e asy to identify if ADX is above moving average or not. easy to identify the direction of the trend by color, not by DI line. unnecessary DI lines can be erased
FREE
The Buffer Reader will help you to check and export the custom indicators buffers data for your current chart and timeframe. You can select the number of buffer and historical bars to read/export. The data can be exported in a CSV format and the files will be stored in the folder: \MQL5\Files .
How it works Put the number of buffers to read in the Buffers_Total input parameter. Put the number of rows to display in the Rows_Total. Choose the CSV separator in the parameter. Copy the correct nam
FREE

Closing Assistant - One-Click Multi-Trade Management for MetaTrader
See More, Trade Better - enhance your MetaTrader experience with this essential trade management tool, extracted from the powerful Meta Extender suite. What It Offers: Close multiple trades simultaneously with a single click, organized by direction (buy/sell) or performance (winning/losing). Select from three scope options: Meta Extender trades only, current symbol trades, or all MetaTrader trades - giving you complete control
FREE
Background
This product is a practical tool to check the market based on the cycle theory . When you need to use multi cycle charts to analyze a symbol , manually adding charts with different cycles and applying templates is a very large cost. This product can help you quickly add multi cycle charts of one or more symbols, and uniformly apply the same template . After adding, you can drag the charts to the sub screen, which is suitable for multi screen analysis. Usage Method Apply this script to
FREE

The "Alligator" indicator is a powerful technical analysis tool designed to assist traders on the MetaTrader 5 (MT5) platform in identifying market trends and potential price reversal points. This indicator is based on a concept developed by Bill Williams, a renowned technical analyst in the world of trading. How the Indicator Works: The Alligator indicator operates by using three Moving Average (MA) lines with different periods. These three lines are: Jaws: This is a Moving Average line with a
FREE

The draws trend lines with adjustable trend width, with trend breakout settings and notifications of trend breakout (Alert, Sound, Email) and of a new appeared arrow. Arrows point at the direction of the order to open (BUY, SELL).
Parameters MaxHistoryBars - the number of bars in the history. Depth (0 = automatic settings) - Search area. width trend ( 0 = automatic settings) - Trend width. (true = closed bars on direction trend),(false = just closed bars for line) - true = closure of candlestic

Indicador usado para sabermos os pontos de suporte de resistência no gráfico.
Funciona em todos ativos e timeframes.
Acerte exatamente os pontos de entradas e saídas das suas operações. SEE OUR RESULTS ON INSTAGRAM: https://www.instagram.com/diogo.cansi/ TELEGRAM GROUP = https://t.me/robosdsc More information by email dscinvestimentos@gmail.com or by Whatsapp 55-991372299
FREE

The indicator is based on the relationship between two sets of Stochastic lines. The first set consists of 6 Stochastic with periods: 5, 8, 10, 12, 14, 16. The second set consists of 6 Stochastic with periods: 34, 39, 44, 50, 55, 60. These periods are customizable. Input parameters Stochastic MA Method Method of calculation ===== Short-term ===== Stochastic #1 %K Period Stochastic #2 %K Period Stochastic #3 %K Period Stochastic #4 %K Period Stochastic #5 %K Period Stochastic #6 %K Period Short
FREE

Idea I programmed this tool out of the necessity to be constantly informed about what is going on. Before I sometimes forgot to set a stopp loss, this is impossible with this tool. Further this tool allows you to make distributed entries, eg. with a first feeler with 0.1 contracts and when the direction is the right one you just put more contacts into the game. Money- and risk management is built in. If you use more then the predetermined number of contracts there is a warning. You are constantl
FREE
Descrição: O MACD Combined é um indicador avançado que integra dois modos de visualização para oferecer uma análise do Moving Average Convergence/Divergence (MACD) mais clara e adaptável. Principais características: Dois modos de operação : Modo 1 : Histograma colorido de acordo com o sinal do MACD (positivo ou negativo). Linha de sinal colorida conforme a relação entre o MACD e a própria linha de sinal. Modo 2 : Histograma colorido com base na comparação entre MACD e linha de sinal. Linha de
FREE

*** THE INPUT TEST MODE SHOULD BE SET TO FALSE*** INSTRUMENT SPECIFICATION Trading Pair: XAUUSD (Gold/US Dollar) ONLY Timeframe: M1 (1-Minute Chart) TRADING HOURS (UTC) Active Period: 13:00 - 13:59 UTC (Default Setting - Do Not Modify) Session: London Afternoon Session RISK MANAGEMENT PARAMETERS Fixed Ratio System: Take Profit : Stop Loss : Lot Size = 2 : 1 : 0.03 Pre-configured presets available from 0.03 to 1.00 lot size All scaling maintains strict proportional ratio integrity Example Config

If you like this product, please give it a 5 star rating as a token of appreciation.
This indicator plots horizontal lines on the chart representing the previous year’s high and low prices . These levels are widely used in technical analysis as major support/resistance references.
Automatically identifies the previous calendar year’s high and low . Plots horizontal lines on the chart at these levels. Customizable color, width, and style of the lines. Deletes lines on deinitialization. Updates
FREE

Sapphire Strat Maker Alt is an EA builder ( Expert Advisor Builder) . With it you can easily create new strategies and optimize them to find the bests parameters to improve your results at maximum. The objective is to bring the capabilities of MQL5 to everyone, even if you don't know how to code. Check out the Pro Version clicking here - Sapphire Strat Maker .
With this Expert Advisor you can create strategies by combining the indicators provided by the EA. A few of the functionalities ar
FREE
Spectral Frequency Engine — AI-Driven FFT Expert Advisor for EUR/USD (M1)
Spectral Frequency Engine is an advanced automated trading system (Expert Advisor) optimized for EUR/USD on the M1 (1-minute) timeframe. This EA uses cutting-edge Fast Fourier Transform (FFT) spectral analysis to identify hidden momentum waves and frequency shifts within market data — transforming raw price movement into a scientific trading signal.
Unlike conventional EAs that rely only on moving averages or oscillator
FREE

Помощник для торговой системы SystZ . Чертит трендовые линии по соседним экстремумам зигзага. Условие для линии сопротивления - правый должен быть ниже левого. Для линии поддержки - правый выше левого. Не допускается, чтобы между экстремумами, по которым проводится трендовая линии были другие. Экстремумы, удовлетворяющие этим условиям, отмечены символом фрактала. Закрытие свечи за линией - сигнал для открытия позиции.
FREE

A small utility displays the time in five time zones. You can customize the display of one to five time zones. For each time it is configured: show or not; name; time offset from GMT; color; In general settings, you can change: date / time format ("hh: mi", "hh: mi: ss", "yyyy.mm.dd hh: mi", "yyyy.mm.dd hh: mi: ss") font name; font size; offset from the left edge of the chart; offset from the top edge of the chart;
FREE

The MWC COX indicator shows the extreme zones of net short/long positions of the Commitments of Traders Report released by the CFTC once a week for four periods of time. Default settings are periods of 12, 26, 52 and 156 weeks.
Additional Features Displays the sum of all 4 periods in one line MA, MOM and RSI indicators are integrated ( not in the MQL5 Version 1.0 ) Please make sure that you download the MWC_Demo.zip file and unpack it into [...]/MQL5/Files folder. -> www.myweeklycot.com/t
FREE

Desvende o Poder Oculto de Cada Vela com o Indicador de Sombras! Cansado de análises superficiais da ação do preço? Deseja uma compreensão mais profunda da pressão de compra e venda em cada período de tempo? Apresentamos o Indicador de Sombras – sua ferramenta indispensável para visualizar e analisar a dinâmica oculta do mercado! Este poderoso indicador transforma a batalha invisível entre touros e ursos, refletida no tamanho das sombras das velas, em um histograma claro e informativo diretament
FREE

SHADOW vous donne des signaux d'achat et de vente solides avec un risque minimal. Vous pouvez voir dans quelle direction le prix évolue et la force du mouvement. Shadow filtre le bruit du marché et améliore radicalement les performances des traders.
Points forts: Détection visuelle efficace des tendances. Bruit du marché des filtres Ne repeint ni ne recalcule jamais. Signaux strictement sur "fermeture du bar". Fonctionne dans tous les symboles. Pop-up intégré, e-mail, notification push et
FREE
"All in One" panel. You can simultaneously control: up to 3 symbols; up to 6 periods; up to 31 popular signals. You can see the sum for all signals taking into account the weight of the signal Version for MetaTrader 4: https://www.mql5.com/ru/market/product/27880 Version for MetaTrader 5: https://www.mql5.com/ru/market/product/27830
Parameters NUM_BAR - number of the bar to analyze (set a value greater than 0 to work on closed bars). timeframe_1....timeframe_6 - working timeframes (if set to "c
FREE

Suitable for the EurTrendSniper trend indicator. Please download and place it in the Indicators folder of MT5.
A key element in trading is identifying the areas or levels where decisions are made to buy or sell financial instruments. Although major participants attempt to hide their presence in the market, they inevitably leave traces. Our task is to learn how to identify these traces and interpret them correctly. Bullish Signal:
The price (candlestick) is above the band-colored block, the ban
FREE

Loss Recovery 3 is an Expert Advisor for recovering losses of positions that were opened in the wrong direction (that were opened by another EA or manually). This EA recovers your loss and closes your position on Break Even or with determined profit.
Trading Strategy:
Loss Recover3 EA try to Recover Wrong Positions, by using Averaging method. There are various features on the EA to control risk of the strategy.
Using EA :
The EA is very simple and without complicated input parameters. Th

ZProfit Ai – Adaptive Trading Intelligence Overview
ZProfit Ai is an advanced Expert Advisor for MetaTrader 5 that applies adaptive algorithmic intelligence to capture market opportunities with precision.
It is designed for traders who want a clean, reliable, and professional trading system that responds dynamically to market changes. Backtest results will never match as entries and exits will be within the candle sensitively. Recommended Settings: 1H timeframe, 125s wait, 10candles SL...... Ke
FREE

1. Move SL to BE On/Off: allow EA move SL to BE or not allow. 2. BE mode: BE Single order: move SL of single order when condition match. BE multi order: Move Sl of multiple orders base on BE of multiple orders. 3. Move SL to BE when profit >= (pips): set how many pips you want EA move SL to BE when profit. 4. Add value from BE: number of pips you want to add from BE (offset). 5. Audible Alert: Enable audible alert on/off. 6. Push notification: Enable Push notification on/off. 7. Three button hel
FREE

Технический индикатор Trend Moving Average позволяет определить глобальное направление рынка. Данный технический индикатор создан для того, чтобы определить «линию наименьшего сопротивления» рынка и понять в какую сторону направлен тренд. Помимо классического использования МА, индикатор позволяет понять направленность рынка на основе динамики его значений. Так, если значение индикатора демонстрируют переход с нисходящего значения в восходящее (и наоборот) - это является дополнительным торговым с
FREE

Probability emerges to record higher prices when RVi breaks out oscillator historical resistance level. It's strongly encouraged to confirm price breakout with oscillator breakout since they have comparable effects to price breaking support and resistance levels; surely, short trades will have the same perception. As advantage, a lot of times oscillator breakout precedes price breakout as early alert to upcoming event as illustrated by last screenshot. Furthermore, divergence is confirmed in
FREE
O mercado MetaTrader é um espaço, sem precedentes, para negociar robôs e indicadores técnicos.
Leia o artigo Manual do usuário da MQL5.community para saber mais sobre os serviços exclusivos que oferecemos aos traders: cópia de sinais de negociação, aplicativos personalizados desenvolvidos por freelances, pagamentos automáticos através de sistema de pagamento e a rede em nuvem MQL5.
Você está perdendo oportunidades de negociação:
- Aplicativos de negociação gratuitos
- 8 000+ sinais para cópia
- Notícias econômicas para análise dos mercados financeiros
Registro
Login
Se você não tem uma conta, por favor registre-se
Para login e uso do site MQL5.com, você deve ativar o uso de cookies.
Ative esta opção no seu navegador, caso contrário você não poderá fazer login.