Conheça o Mercado MQL5 no YouTube, assista aos vídeos tutoriais
Como comprar um robô de negociação ou indicador?
Execute seu EA na
hospedagem virtual
hospedagem virtual
Teste indicadores/robôs de negociação antes de comprá-los
Quer ganhar dinheiro no Mercado?
Como apresentar um produto para o consumidor final?
Pagamento de Indicadores Técnicos para MetaTrader 5 - 69

Introducing the "Visual Aroon Directional Shift Indicator" – a tool designed to help traders uncover trend strength and directional shifts in the market with precision. This indicator is available for $65 and provides an unparalleled view into market dynamics for both novice and experienced traders. Not Optimized, Created for You to Optimize This indicator is intentionally designed without pre-set optimizations, giving you the freedom to adjust its settings according to your unique trading

Visual Aroon Zero Level Indicator is a powerful analytical tool designed to assist traders in identifying market trends, momentum, and potential reversals using the robust Aroon oscillator logic. It offers clear and actionable insights, making it an essential addition to your trading toolkit. Key Features and Logic Behind the Indicator: Aroon Oscillator Mechanics :
The Aroon Oscillator operates by analyzing the time since the most recent highs and lows occurred. The indicator calculates the
Introducing the Swing Point Model Indicator – A Professional Trading Tool The Swing Point Model Indicator is an innovative tool designed for traders who want to capture market structure and identify potential trading opportunities. With a logical and transparent approach, the Swing Point Model helps you gain deeper market insights and make precise trading decisions. This is multiple Timeframe indicator so you can choose Higher timeframe for detect Swing point model What Is the Swing Point Model?

The Visual Mass Reversal Indicator is an advanced analytical tool designed for traders seeking to identify potential market reversals. This indicator brings powerful visual clarity to reversal opportunities, enabling traders to spot entry points effectively. Please note, the indicator is not optimized —it is intentionally crafted for you to optimize and tailor it to your unique trading strategies. The Strategy Behind the Indicator The Mass Reversal Indicator uses a sophisticated algorithm

Unleash the Power of Market Dynamics with the Vortex Indicator! The Visual Vortex Indicator is your advanced tool for decoding market trends, reversals, and momentum shifts. Priced at $65, this indicator provides a comprehensive view of market behavior, but it’s designed for you to fine-tune and optimize it according to your unique trading strategy. What Makes It Unique? The Vortex Indicator is based on a strategy that identifies directional movements and trend strength by analyzing key pr

Visual Vortex Momentum Shift Indicator Unlock the potential of momentum shifts in the market with the Visual Vortex Momentum Shift Indicator ! This advanced tool is designed to help traders identify crucial turning points and momentum reversals with clarity and precision. However, this indicator is not optimized and is created for you to optimize based on your trading preferences and strategies. What is the Visual Vortex Momentum Shift Indicator? The indicator focuses on detecting momen
Visual Vortex Signal Indicator The Visual Vortex Signal Indicator is your pathway to exploring dynamic market conditions and refining your trading strategy. This indicator is not optimized—it is intentionally designed for traders to tweak and perfect it to suit their trading preferences and objectives. By taking full control of its parameters, you can tailor it to complement your trading approach. How It Works The Visual Vortex Signal Indicator leverages the power of the Vortex Indica

Optimize Your Trading Edge with the Vortex Trend Strength Indicator The Visual Vortex Trend Strength Indicator is your gateway to mastering market trends and capitalizing on key trading opportunities. Designed with precision and flexibility, this indicator is a dynamic tool that helps traders assess the strength and direction of trends in any market. Please note that this indicator is not optimized —it's crafted for you to customize and optimize it according to your trading preferences and

Introducing the Deriv Volatility MT5 Indicator - Your Edge in the Market This powerful indicator is designed to give you a real-time edge in trading all Deriv volatility pairs . By analyzing market volatility, it provides you with crucial insights to make informed trading decisions. Key Features: Comprehensive Volatility Analysis: The indicator continuously monitors market volatility across all Deriv volatility pairs, identifying periods of high and low volatility. This empowers you to adjust y

The Gold-Euro Edge The Gold-Euro Edge is a powerful trading tool designed to provide real-time insights into the volatility of two major markets: XAUUSD (Gold/USD) and EURUSD (Euro/USD) . Key Features Comprehensive Market Analysis : Continuously analyzes price fluctuations in both XAUUSD and EURUSD, identifying periods of heightened or diminished volatility. Real-Time Alerts : Audible Alerts : Receive immediate audio notifications directly from your trading platform, alerting you to significant

In the rapidly changing financial markets, finding reliable trading signals is the key to success!
In trading, the timing of entry is everything!!
Whether you are a short-term trader or a long-term investor, this indicator can provide you with the most accurate entry signals, helping you to seize market opportunities and become your most powerful trading assistant!
MT4: https://www.mql5.com/en/market/product/129945
Features: Accurate Entry Signals: Based on advanced algorithms and real-tim

Fibonacci Probability: O Poder da Análise Técnica ao seu Alcance Transforme sua análise de mercado com o Indicador Fibonacci Probability, uma ferramenta essencial para traders que desejam identificar níveis críticos de suporte e resistência com precisão milimétrica. Desenvolvido com base nos princípios da sequência de Fibonacci, este indicador oferece uma análise abrangente dos movimentos do mercado, ajudando você a tomar decisões mais informadas e estratégicas. Funcionalidades do Indicador: Ní
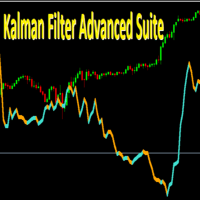
KALMAN FILTER ADVANCED SUITE O Kalman Filter Advanced Suite é um indicador profissional que utiliza um sofisticado sistema de filtragem estocástica tridimensional para análise avançada do mercado. Desenvolvido com tecnologia de ponta em processamento de sinais, este indicador se destaca por sua capacidade única de adaptação à volatilidade do mercado em tempo real. PRINCIPAIS CARACTERÍSTICAS: Sistema Tridimensional Avançado Análise simultânea de preço, velocidade e aceleração Compreensão profunda

Nome do Indicador: Indicador de Probabilidade Descrição: O Indicador de Probabilidade é uma ferramenta poderosa para traders que desejam identificar oportunidades de compra e venda com base na análise de velas anteriores. Este indicador calcula a probabilidade de alta (CALL) e baixa (PUT) com base no número de velas analisadas e exibe setas no gráfico para sinalizar possíveis pontos de entrada. Características: Análise de Velas: Analisa um número configurável de velas para calcular a probabilida
Introducing the unique trading system Dynamic trend cycles oscillator (DTC) — a powerful tool for H1-H4 trading with volatility pairs !
Technical capabilities - pairs to trade : EURUSD,GBPUSD,XAUUSD; - timeframes : M30,H1,H2,H3,H4;
Why Choose DTC? - Accurate Trend Analysis: DTC adapts to current market volatility, providing precise tracking of price trends. This allows you to confidently open positions in line with the main trend and maximize your profits. - Filtering False Signals: In times
Introducing the manual trading system "Flexi trend tracker indicator" — a powerful instrument for hour+ timeframes trading with medium/soft volatility pairs! This system offers unique features: wide range of applications: This strategy can be used on various time intervals: H1, H2, H3, and H4 timeframes, making the trading advisor a highly versatile tool for trading. the system works on comfortable USD crosses: USDCAD, USDCAD, and USDCAD pairs where you won't see overwhelming trends that wipe
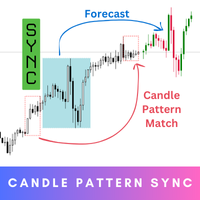
Candle Pattern Sync is your ultimate tool for precision and insight in trading. Step into the future of trading with this innovative indicator that’s designed to help you understand market behavior by analyzing historical patterns and giving you an idea of what might come next. While the forecasts provide valuable probabilities based on history, they’re not guarantees – think of them as a powerful guide to inform your decisions, not a definitive answer. MT4 Version - https://www.mql5.com/en/m

The Gann Scalping Gold Indicator is a robust technical analysis tool designed for precision trading in gold markets. It leverages Gann-based methodologies to identify key price levels, enabling traders to anticipate potential market reversals, breakouts, and areas of consolidation. Daily Reset Logic: Automatically resets touch statuses at the start of a new trading day, ensuring that the indicator aligns with fresh daily trends. How It Works: The indicator draws horizontal lines at predefine
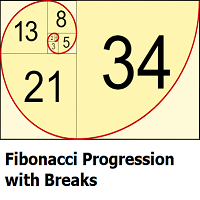
This indicator highlights points where price significantly deviates from a central level. This deviation distance is determined by a user-set value or using a multiple of a period 200 Atr and is multiplied by successive values of the Fibonacci sequence. Settings
Method: Distance method, options include "Manual" or "Atr"
Size: Distance in points if the selected method is "Manual" or Atr multiplier if the selected method is "Atr"
Sequence Length: Determines the maximum number of significant devia
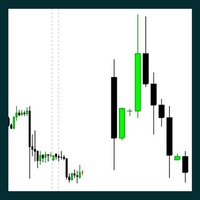
The Indicator is useful for professional trader, such as ICT , Smart Money Concept trader; who do the top-down analysis and want to display the candles of the Higher Timeframe on the Lower Timeframe. It allows you to stay in your entry timeframe while following the narrative of the Higher timeframe. Here are some easy input: Number Of Bars: The total of HTF's candle you want to display. Auto Timeframe: If true, the indicator will recommend the Higher timeframe that suit the current timeframe you

Presentation: Discover an advanced version of the Stochastic Oscillator indicator, designed for demanding traders. This tool integrates sound and visual alerts for crossovers at specific levels, providing precise analysis and clear signals to optimize your trading decisions. Key Features: Sound Alerts: Automatic audio signal for a bullish crossover (%K crossing %D upwards) between levels 0 and 60. (Adjustable Parameter) Automatic audio signal for a bearish crossover (%K crossing %D downwards) be
This is the Parabolic Dashboard MT5. This dashboard will scan multiple timeframes and symbols in MT5 platform, from M1 chart to D1 chart. It will send the buy/sell signals by alert on the platform or sending notification to your phone or message you via a email.
The buy signal is generated when the SAR changes its position from above to below of the candle. The sell signal is is generated when the SAR changes its position from below to above of the candle. The up/down trend color will be disp
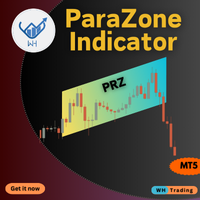
The ParaZone Indicator MT5 helps you spot areas where price trends are likely to reverse. It marks these zones on your chart using a unique parallelogram shape, making it easier to find the best points to enter or exit trades. Whether you’re a beginner or experienced trader, this tool can help improve your trading decisions. Key Features: Accurate Reversal Detection: Identifies key zones where price may change direction. Dynamic Zone Adaptation: Zones adjust in real-time to follow market movemen
There are many band type indicators. Almost all of them work in a similar way: some base value is considered a central line, and the bands are drawn from it at the same distance from the top and bottom. This is good at outlining the boundaries of price fluctuations, but usually causes a lag when the trend reverses. This lag is caused by the opposite side of the band being too far from the current price. This indicator is one way to fix this problem. Instead of bands being equidistant from the ce
At its core, the Centered Bands Channel Indicator is a tool designed to provide insights into the overall price trend of a trading instrument. It achieves this by plotting three distinct bands on the trading chart.
Band Characteristics:
Top Band: Colored in red, this band indicates potential resistance levels. Lower Band: Also colored red, this represents potential support levels. Middle Band: This is the dynamic band which changes its color based on the trend direction – turning green during
The Regression Channel Indicator builds a regression channel. The linear regression channel consists of two parallel lines, equidistant from the top and bottom of the linear regression trend line. The distance between the channel boundaries and the regression line is equal to the deviation of the maximum closing price from the regression line. Input parameters of the indicators: degree - degree of regression, varies from 1 to 61; kstd - width of the regression channel; data - starting date

Pivot Math Support and Resistance Lines indicator — indicator showing pivot lines, which will definitely help every trader who knows how to trade with resistance, support and pivot lines. It shows 8 different lines (additional lines are also possible) on the main chart, helping you find the best points to buy, sell and exit positions. Input parameters: P (default = 64) — period in bars or other periods (set using MMPeriod), on which the lines will be calculated. The smaller this number, the "f

Heat Map Indicator - Análise Avançada de Volume
Apresentando o Indicador de Heat Map - Uma Ferramenta Profissional para Análise de Volume de Mercado!
**Principais Características**
**Mapa de Calor Visual** - Visualização instantânea da intensidade do volume através de cores - Azul: Baixo volume - Verde: Volume médio - Amarelo/Laranja: Volume crescente - Vermelho: Alto volume
**Interface Intuitiva** - Escala de cores dinâmica - Indicador de porcentagem em tempo real - Indicador de nível atua

Indicador MelonMask - Ajuda a Capturar Reversões de Tendência MelonMask é uma poderosa ferramenta de análise técnica, projetada especificamente para traders profissionais, que ajuda a detectar reversões de tendência com antecedência. Com seu algoritmo avançado baseado em Zigzag, ele identifica os pontos chave de reversão no mercado e fornece sinais visuais. Características do Indicador: Sinais de seta verde e vermelha nos pontos de reversão de tendência Prediz a direção potencial da próxima vel
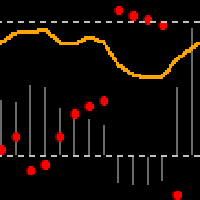
The stochastic indicator itself creates false signals. One way to determine that the price is trending is to use the parabolic SAR indicator. As a rule, it is plotted on the chart.
The projection of the SAR into the Stochastic Indicator is not complicated (pSAR-min)/(max-min). This will allow you to track price movement from two views in one place.
It depends very much on the parameter settings.
If the price is trending, the SAR moves towards the midpoints or close to them. On the other hand, a
To get access to MT4 version please click here . This is the exact conversion from TradingView: "Fearzone - Contrarian Indicator" by " Zeiierman ". This is a light-load processing and non-repaint indicator. All input options are available. Buffers are available for processing in EAs. You can message in private chat for further changes you need. Thanks for downloading
BBVectorDynamics_indicator is an innovative trading system specifically designed for volatile markets. Based on unique algorithms for analyzing market forces and identifying imbalances between buyers and sellers, this system helps you make precise and well-considered decisions in the trading process. Main features of the bb vector dynamics_indicator:
Calculation of dynamic vectors. System determines the differences between the extreme price values and smoothed averages over a specified period.

Chronolines – Temporal Support and Resistance Levels for MetaTrader 5 Introduction to Chronolines
Chronolines is a graphical indicator designed to identify and visualize temporal support and resistance levels using the Highs and Lows of four predefined periods. It is compatible with all assets available on MetaTrader 5 , including stocks, currencies, commodities, indices, and cryptocurrencies, offering a logical and structured approach to tracking market behavior. Lines and Periods
Chronolines
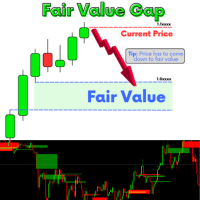
A fair value gap (FVG) is a temporary price gap that occurs when the price of a stock or security is out of line with its fair value. This gap is often caused by an imbalance between buyers and sellers. How it works Price imbalance When there is an imbalance between buyers and sellers, the price of a security can move too quickly. Price gap This creates an unadjusted area on the price chart, known as the fair value gap Price correction The price is often drawn back to the fair value gap, as i
ParabolicSAR_Fibo_Channel is an indicator built not on the price deviation from the last extremum, as in a regular similar filter, but on the readings of Parabolic SAR and its intersection with the price chart. As a result, the indicator has a smaller delay in determining a new reversal point. In addition, the filter very conveniently built in Fibonacci levels, which are built on the basis of three consecutive ZigZag peaks, as well as a channel built on the same points. As a result, this indicat
Regression_Channel_mod Indicator that expands our standard linear regression channel by adding support and resistance lines. Easy to integrate into other indicators.
The linear regression channel consists of several parallel lines equidistant from the upper and lower part of the linear regression trend line. The distance between the channel boundaries and the regression line is equal to the deviation of the maximum closing price from the regression line.
You can purchase some of our professio
FiboPivotsIndicator is the indicator for intraday traders looking for key breakout levels and target levels on the chart. It uses automatic Fibonacci extensions and pivot points to highlight price event areas. FiboPivotsIndicator is a unique combination of Fibonacci extensions and pivot points for price action traders.
This breakout trading tool is suitable for both trend following and swing trading strategies. Indicators such as moving averages, stochastics and RSI are well suited for this
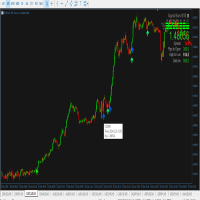
Dynamic Center of Gravity Indicator Revolutionary Price Action Trading System Harness the power of price momentum with the Dynamic Center of Gravity indicator - an advanced price action trading tool designed for serious traders. This innovative indicator identifies powerful gravity zones that attract rapid price movements, creating high-probability trading opportunities when momentum breaks free from these zones. Key Features Pure price action analysis - no lagging indicators Works effectively a
The Hybrid Trend Impulse indicator is an advanced tool that combines modern approaches to trend and impulse analysis, offering unique capabilities for effective deposit management. Key advantages of the HybridTrendImpulse_indicator: Nonlinear dynamics: The method of interaction between opening prices forms a unique nonlinear model that is particularly sensitive to significant price fluctuations, increasing their significance and making the indicator ideal for working in high volatility conditio

The Opportunity System: Forex Gold Indicator The Opportunity System is a powerful and intuitive Forex Gold Indicator designed to help traders identify prime entry and exit points for trading gold (XAU/USD). This advanced indicator combines the strengths of two of the most popular technical analysis tools – the Stochastic Oscillator and the MACD (Moving Average Convergence Divergence) – to provide precise, real-time insights into market trends and potential reversals. Key Features: Stochastic Osc

Golden Trend Pulse — trend indicator developed specifically for Gold, also applicable to the Cryptocurrency and Stock markets. The indicator is designed for precise determination of market trends using advanced analytical methods. The tool combines multifactor analysis of price dynamics and adaptive filtering of market noise, ensuring high accuracy in identifying key entry and exit points. Thanks to its intelligent system, the indicator effectively handles market variability, minimizing false
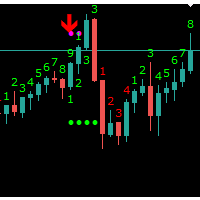
Indicator Sequential Through a multi-phase price comparative process consisting of the Setup and Countdown indicators, the Sequential indicator analyzes otherwise incongruent price data to provide insight into the strength or weakness of the market’s trend and its likelihood of reversing The Mechanics of Sequential We have the market's number The majority of the DeMARK Indicators are designed to anticipate price exhaustion as opposed to following the trend. Identifying likely inflection points
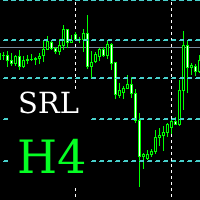
An indicator for determining and displaying support and resistance levels on the H4 chart over the past 180 days. The algorithm searches for local minima and maxima, filters levels to eliminate closely spaced values, and then visualizes them on a graph. Defining key levels Support levels: lows at which the price slowed down or reversed upward. Resistance levels: highs where the price had difficulty rising further.
O Mercado MetaTrader oferece um local conveniente e seguro para comprar aplicativos para a plataforma MetaTrader. Faça download de versões de demonstração gratuitas de Expert Advisors e indicadores a partir do seu terminal para testes no Testador de Estratégia.
Teste os aplicativos em diferentes modos para monitoramento do desempenho e assim fazer um pagamento para o produto que você deseja, usando o sistema de pagamento MQL5.community.
Você está perdendo oportunidades de negociação:
- Aplicativos de negociação gratuitos
- 8 000+ sinais para cópia
- Notícias econômicas para análise dos mercados financeiros
Registro
Login
Se você não tem uma conta, por favor registre-se
Para login e uso do site MQL5.com, você deve ativar o uso de cookies.
Ative esta opção no seu navegador, caso contrário você não poderá fazer login.