Conheça o Mercado MQL5 no YouTube, assista aos vídeos tutoriais
Como comprar um robô de negociação ou indicador?
Execute seu EA na
hospedagem virtual
hospedagem virtual
Teste indicadores/robôs de negociação antes de comprá-los
Quer ganhar dinheiro no Mercado?
Como apresentar um produto para o consumidor final?
Indicadores Técnicos para MetaTrader 5 - 97

O indicador UzFx-Total TP'SL & Timer-MT5 foi concebido para fornecer um acompanhamento em tempo real dos valores totais de Take Profit (TP) e Stop Loss (SL) em todas as transacções abertas e pendentes. Além disso, inclui um temporizador de contagem decrescente de velas para indicar o tempo restante para a vela atual fechar.
(Visite o perfil e confira todos os outros produtos MT4 / MT5) (Por favor, não se esqueça de dar uma revisão)
Principais recursos:
Calcula automaticamente o lucro e a

Currency Strength Indicator - Track Market Power
Overview: Gain a competitive edge with the Currency Strength Indicator for MetaTrader 5. This intuitive tool measures the relative strength of 8 major currencies and displays them in a clear, sortable table directly on your chart. Perfect for forex traders looking to identify strong and weak currencies at a glance. Key Features: Dynamic Strength Table: Displays real-time strength for EUR, USD, GBP, JPY, CHF, AUD, CAD, and NZD in the upper-left c
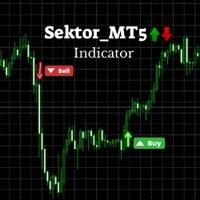
SektorMT5 - Advanced Trading Indicator Specification Automated Buy/Sell Signal Indicator for Meta Trader 5 (MT5)
Setting Description Recommended Value Timeframe (TF) The recommended chart timeframe for optimal signal accuracy. H1 (1 Hour) Symbol The financial instrument on which the indicator works best. XAUUSD (Gold) Lookback Period Number of candles used to determine breakout levels. 24 Candles (Adjustable) Buy Signal Green upward arrow appears when price breaks above resistance. Displayed on

BVP - Scanner Avançado de Mercado Comprador/Vendedor
Experimente o sentimento do mercado em tempo real através de múltiplos períodos com o BVP (Painel de Compradores/Vendedores) - uma sofisticada ferramenta de análise de mercado projetada para traders modernos. Por que BVP?
Nos mercados dinâmicos atuais, entender a dominância de compradores e vendedores é crucial. O BVP oferece feedback visual instantâneo em 12 períodos, de M1 a D1, ajudando você a detectar mudanças no mercado antes que se torne
Bollinger Gaussiano com Média Móvel Gaussiana ️ Transforme sua estratégia de trading com um indicador revolucionário que combina a poderosa Matemática Avançada com a eficiência prática das análises técnicas! ️ Seja você um iniciante ou um trader experiente, o Bollinger Gaussiano é a solução perfeita para quem deseja elevar suas análises de mercado . Este indicador único substitui a média móvel tradicional pela Média Móvel Gaussiana (GMA), criando bandas de Bollinger mais sensíveis e a

This is an indicator to determine when to sell or buy, and it can be combined with other indicators, such as the SND indicator that I also sell. This indicator is very suitable for BTC, XAU, and NAS100. This is an indicator for MT5. It is highly battle-proven if studied properly. Please consult andriawanjaya@gmail.com before using it. This product is very suitable for XAU, BTC, and NAS100. This product is very limited It is only sold on Gogo Jungle and MQL5.

No mundo do trading, onde cada tick pode ser o início de uma nova história, é crucial ter um aliado confiável. O TrendVarianceSpectrum não é apenas um robô de trading; é o seu guia em mercados voláteis. Construído com anos de experiência e treinado com mais de 25 anos de dados, ele combina a elegância da matemática com o poder da tecnologia moderna. Vantagens principais do TrendVarianceSpectrum: Drawdown mínimo : O TrendVarianceSpectrum opera com um drawdown significativamente baixo, tornando-o

Smart Detector — Os Segredos do Smart Money e ICT em Suas Mãos!
Quer operar como os grandes players? O Smart Detector revela o mundo do Smart Money e das estratégias do Inner Circle Trader (ICT) . Este indicador para MetaTrader 5 identifica instantaneamente as zonas-chave onde os market makers deixam seus rastros: poderosos blocos de ordens e gaps ocultos de Fair Value Gaps . Descubra onde a liquidez está escondida e use isso a seu favor! Smart Money: Acompanhe as ações dos bancos e fundos de h
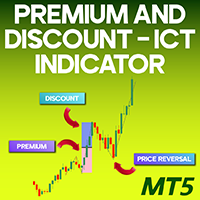
Premium and Discount PDA ICT Indicator for MT5 The Premium and Discount Indicator for MetaTrader 5 is a liquidity-based tool that tracks short-term market movements using a zigzag pattern. It highlights premium and discount zones, assisting traders in identifying optimal entry points and setting Take Profit (TP) and Stop Loss (SL) levels. This indicator is specifically designed to detect minor market shifts, placing a "D" at significant lows and a "P" at key highs. By clicking these markers, tra

TimeView Pro – Indicador Personalizável de Hora Local para MetaTrader 5 Descrição
TimeView Pro é um indicador de exibição de tempo totalmente personalizável, que ajusta automaticamente o horário com base no fuso horário do usuário conforme o relógio do PC ou país. Diferente de outros indicadores similares, TimeView Pro oferece opções avançadas de personalização sem comprometer a clareza do gráfico. Principais recursos Alinhamento com a vela (ativado por padrão) – O rótulo de tempo se ajusta aut

JAJ Binary Pro is a precision-driven binary options strategy created by Jamaine Walkin , a full-time trader and investor. Designed for adaptability in Forex and OTC markets , it focuses on high-probability trade setups and disciplined risk management. Optimised for Pocket Option & MT5 , it reflects Jamaine’s structured approach to trading Options, ensuring consistency and confidence in execution.
Always use Proper Risk Management when trading.
Este indicador é destinado principalmente para negociação manual. O indicador analisa os últimos movimentos de preços. E os processa usando seu próprio algoritmo. Com base nessa análise, o indicador calcula os níveis de preços mais importantes. Esses níveis dividem os valores de preços em três zonas: compra, venda e neutra. Novas posições só devem ser abertas se o preço estiver na zona apropriada. Se o preço estiver na zona neutra, você precisa pensar em fechar posições, movê-las para o ponto d
The Volume Difference indicator displays the difference in tick volume between the current and previous bars. It is designed to identify changes in market activity, which can signal important market actions.
Green bars show an increase in volume compared to the previous bar (positive difference).
Red bars indicate a decrease in volume (negative difference).
The indicator is built in a separate window and is suitable for use both independently and as part of more complex strategies for analyz

PipHistogram is an essential tool for traders who want to gain insight into price distribution and concentration. Its customizable, visually appealing histogram allows you to pinpoint key levels and make more informed trading decisions. Enhance your market analysis and improve your trading strategy with PipHistogram —your shortcut to understanding price dynamics in MetaTrader 5. Overview : PipHistogram is a powerful indicator for MetaTrader 5 that visually displays the percentage distribu

The best and the only World Time Display for MT5
Features :
- JAPAN, LONDON & NEW YORK Time Display
- You can customize with different Font, Color And Text Size
- You can customize Box Position and Box Color to meet your satisfaction
- Only For Metatrader 5
- Customize GMT according to your Time Zone
- Simple To Use. Just Attach to your MT5
- No hidden code or no errors

Introduction to the Manual Backtesting Indicator on MQL5 The MetaTrader platform provides an excellent backtesting tool for evaluating Expert Advisors (EAs). However, when it comes to manually backtesting a strategy to assess its effectiveness, this tool has some limitations: You cannot manually draw zones or trend lines while in backtesting mode. You cannot switch timeframes to check time alignment. For example, if my strategy requires additional confirmation from a higher timeframe (HTF), this
Product Name : SII - Synthetic Indices Indicator
Overview :
The SII (Synthetic Indices Indicator) is a specialized trading tool designed to identify high-probability levels in synthetic indices using imbalances. By leveraging the concept of imbalances, SII provides traders with precise insights into potential market reversals and continuations, enhancing trading accuracy and decision-making.
Key Features
1. Imbalance Detection: SII automatically identifies and marks imbalances on the chart,

Candle Reversal , is designed to identify and highlight key candlestick patterns that signal potential trend reversals or continuations in the market. It focuses on two primary types of patterns: 3-Line Strike Patterns (Bullish and Bearish) Engulfing Patterns (Bullish and Bearish) The indicator provides visual cues (arrows and text labels) on the chart to help traders quickly identify these patterns, making it easier to make informed trading decisions. use with MACD or awesome oscilator to

VANGARD Trade Info MT5 – Informações Avançadas e Controle Total! VANGARD Trade Info MT5 é uma ferramenta essencial para traders que desejam monitorar suas operações em tempo real com configurações de privacidade personalizáveis, interface ajustável e alertas inteligentes de margem . Este indicador fornece informações detalhadas sobre suas negociações, níveis de margem, swaps e custos, apresentadas em uma interface otimizada para decisões mais rápidas e eficientes. Por que escolher o VAN

Supertrend is a trend-following indicator based on Average True Range (ATR). The calculation of its single line combines trend detection and volatility. It can be used to detect changes in trend direction and to position stops. History The Supertrend indicator was created by Olivier Seban. Calculations To calculate bands of the Supertrend, use the following formulas: hl2 = (high + low) / 2 basicUpperBand = hl2 + (multiplier × ATR) basicLowerBand = hl2 - (multiplier × ATR) upperBand = basicUpper

PMax is a brand new indicator developed by KivancOzbilgic in earlier 2020. It's a combination of two trailing stop loss indicators; One is Anıl Özekşi's MOST (Moving Stop Loss) Indicator and the other one is well known ATR based SuperTrend. Both MOST and SuperTrend Indicators are very good at trend following systems but conversely their performance is not bright in sideways market conditions like most of the other indicators. PMax tries to solve this problem. PMax combines the powerful sides of

MATRIX Market Scanner
Comprehensive Analytics Without the Complexity Our innovative, cell-based dashboard gives you a panoramic view of the market—letting you monitor multiple instruments and timeframes seamlessly. Its high level of customization delivers an intuitive, dynamic display that adapts to your trading style, empowering you to see the bigger picture and make smarter, faster decisions. New Update The latest update to the Indicator Matrix Market Scanner introduces a powerful new feature

"Unlock deeper market insights with our advanced MQL5 Volume Indicator! This tool combines real-time volume data with an EMA25 overlay, highlighting key zones where volume surges at least 1.5 times above the EMA25—perfect for spotting high-impact trends. Customize colors and opacity effortlessly to suit your style. Plus, streamline your charts by disabling MT5’s default volume display: simply go to the chart settings, uncheck the built-in volume option, and let our indicator take the lead. Prec

A powerful trend-following tool that uses ATR-based volatility to identify market trends across multiple timeframes . This enhanced version allows you to overlay the SuperTrend of a higher timeframe directly on your current chart, helping you align your trades with the dominant trend. How It Works The indicator calculates dynamic support and resistance levels using Average True Range (ATR) : Upper Band = Source Price + (Multiplier × ATR) Lower Band = Source Price - (Multiplier × ATR) In an uptre
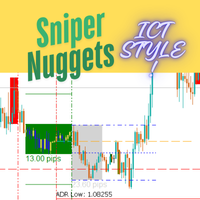
!!!!!!!! Sniper Nuggets !!!!!!!!
Sniper Nuggets is an all-in-one indicator for many things ICT style. It includes the following functionalities: Custom periods : which allow you to set custom daily period start and end times according to your taste. ADR Markers: which plots the average daily range. Worktime: which plots the various boxes on the chart for Asia range (including its high, low and midpoints, standard deviation predictions ), London open, New York open, CME open and London close.

### Introducing the Price Action Ultimate Suite – The Ultimate Trading Tool for Professional Traders!
Are you searching for a powerful tool to elevate your Price Action trading strategy? Look no further than the **Price Action Ultimate Suite** – a comprehensive and intelligent indicator for MetaTrader 5 (MT5) – designed to be your trusted partner in conquering the financial markets! Packed with advanced features and user-friendly functionality, this indicator helps you identify key price patte
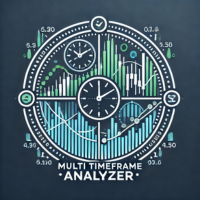
Hello, traders! Welcome to the introduction of Multi Timeframe Analyzer v1.0 ! ( MT5 )
This is the Meta Trader 5 version of the "Market Meeter". Click here to Get MT4 version <<---
What is this indicator? Simply put, this indicator analyzes the market across eight different timeframes , from lower to higher, and predicts the next price direction along with an estimated continuation time. It does this by using volume, volatility, and price patterns in its calculations. Let's dive into the inf

A powerful high-frequency tick analysis tool that automatically processes vast streams of market data and provides traders with an accurate picture of market activity to seize trading opportunities. Easily adaptable to any trading style, TickFlow becomes your personal analytical assistant, instantly responding to market changes and helping to identify key support, resistance, and cluster zones. TickFlow is a modern analytical platform that combines intelligent big data processing with intuitive
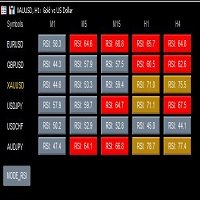
This is a powerful multi cycle, multi currency pair, and multi indicator monitoring tool for MT5 version, with main functions including: 1. Monitor real-time performance of multiple indicators, including RSI, MACD, MA, and STO. 2. Monitor multiple currency pairs, customizable to add or delete currency pairs, and automatically update indicators. 3. Monitor multiple currency pairs over multiple cycles. 4. After clicking, you can directly switch to the chart and cycle you want to view. 5. Click th

This is a custom indicator script for MetaTrader, designed to generate buy and sell signals based on price action relative to Bollinger Bands. It identifies potential trade opportunities when the closing price crosses the lower Bollinger Band, plotting arrows on the chart to highlight entry points. Key Features: Buy and Sell Signals: A buy signal is generated when the closing price moves above the lower Bollinger Band after being below it. A sell signal is triggered when the closing price moves
QUICK OVERVIEW: Use AI to predict the markets with AI Arrow, the ultimate trading tool, let it manage the probabilities and send you a simple signal in the form of an arrow, ready to trade, no complex configurations. The indicator will analyze the market and let you know when a potential movement will happen, sometimes it takes some extra bars for the movement to happen as it can't predict the exact top/bottom every time. Arrow will appear at the start of a new bar and alert you, so you have ti

Scalping Signals Pro is a powerful custom indicator designed to help traders identify key market turning points with ease. It provides clear Buy and Sell signals directly on the chart, making it ideal for traders who want to enhance their decision-making process. Key Features:
️ Intuitive and user-friendly interface
️ Non-repainting Buy and Sell signals
️ Works across different timeframes and assets
️ Designed for trend-following and reversal strategies
️ Customizable settings to fit yo

AdaptiveMomentumCCI Indicator
The AdaptiveMomentumCCI is a custom technical indicator for MetaTrader 5 that enhances the traditional Commodity Channel Index (CCI) by incorporating adaptive period adjustments, momentum analysis, and signal filtering. It calculates a smoothed CCI based on a user-defined price source (e.g., HLC/3, OHLC/4, or close), with its period dynamically adjusted using the Average True Range (ATR) to reflect market volatility. The indicator features a dual-line system with

Mini Índice Composition: A Revolução na Análise do Mini Índice! O Mini Índice Composition é um indicador inovador que monitora em tempo real as principais ações que compõem o mini índice, trazendo uma visão quantitativa poderosa sobre o fluxo de ordens do mercado! Como Funciona? Diferente de outros indicadores que utilizam apenas dados históricos, o Mini Índice Composition faz uma leitura ao vivo das ordens que entram e saem das ações, pesando o impacto direto no mini índice. Com

Fibomathe Indicator: Support and Resistance Tool for MT5 The Fibomathe Indicator is a technical analysis tool designed for MetaTrader 5 (MT5) that assists traders in identifying support and resistance levels, take-profit zones, and additional price projection areas. It is suitable for traders who use structured approaches to analyze price action and manage trades. Key Features Support and Resistance Levels:
Allows users to define and adjust support and resistance levels directly on the chart.

Buy Signal Indicator This indicator generates a Bu y Signal when a potential upward movement is detected. A G reen Arrow appears below the price chart, indicating a possible entry point for a long position. The signal helps traders identify moments of strength in the market.
TIP:- USE 1 HOUR OR BIGGER TIMEFRAMES FOR BETTER RESULTS. TRAIL STOP LOSS BY USING NEAREST SWING HIGHS AND LOWS. NOTE:- THIS INDICATOR GIVES ONLY BUY SIGNALS FOR SELL SIGNAL USE MY OTHER INDICATOR.

Sell Signal Indicator This indicator generates a Sell Signal when a potential downward movement is detected. A Red Arrow appears above the price chart, indicating a possible entry point for a short position. The signal helps traders identify moments of strength in the market.
TIP:- USE 1 HOUR OR BIGGER TIMEFRAMES FOR BETTER RESULTS. TRAIL STOP LOSS BY USING NEAREST SWING HIGHS AND LOWS. NOTE:- THIS INDICATOR GIVES ONLY SELL SIGNALS FOR BUY SIGNAL USE MY OTHER INDICATOR.

Matrix Currency - Ferramenta de Análise Multi-Timeframe O Matrix Currency é um indicador avançado para análise de força das moedas no mercado Forex, projetado para oferecer monitoramento eficiente e suporte estratégico nas suas operações de trading. Características Principais: Análise Multi-Timeframe : Monitora múltiplos períodos simultaneamente (M1 a MN1) com atualização em tempo real em uma matriz intuitiva. Sistema de Alertas : Notificações configuráveis, via pop-up, email e dispositivos móv
CS Bollinger – é um indicador de sinais baseado nas Bandas de Bollinger, desenvolvido para identificar rapidamente níveis importantes de suporte e resistência, utilizando sinais visuais de negociação. Com uma lógica aprimorada para mudança de níveis, o indicador ajusta automaticamente os níveis no gráfico, exibindo setas sinalizadoras ao confirmar reversões de preço. Isso permite aos traders identificar rapidamente momentos favoráveis para entrada e saída do mercado. O indicador oferece configur

This is a true trend lines indicator for MT4/MT5.
This indicator draw real trend lines.
Usually the trend line is drawn as a solid line.
The next trend line that is likely to be valid is drawn as a dotted line.
The most recent invalidated trend line is drawn as a dashed line.
Three-touch lines is drawn as a bright colors.
If the starting point of the trend line is new, the blue line is displayed(call shortline),
if it is old, the gold line is displayed(call longline).
The number of bars border

Parabolic SAR + Deviation [BigBeluga] is an enhanced Parabolic SAR indicator designed to detect trends while incorporating deviation levels and trend change markers for added depth in analyzing price movements. Key Features: > Parabolic SAR with Optimized Settings: Built on the classic Parabolic SAR, this version uses predefined default settings to enhance its ability to detect and confirm trends. Clear trend direction is indicated by smooth trend lines, allowing traders to easily visuali

O indicador mostra os sinais para comprar e para vender.
Taymfrem: qualquer.
Valyunaya Casal: qualquer.
AlertsMessage Parâmetro - desabilitar e habilitar a caixa de mensagem.
Parâmetro alertsSound - desativa ou ativa o som.
Parâmetro Seta Tipo - selecione o ícone para o atirador,
Três não é uma forma complicada de filtrar o indicador de sinal:
1) Para verificar a direção dos indicadores com prazos mais sênior. 2) Use o MACD gráfico padrão. 3) Use o indicador de parabólica.
Também nã
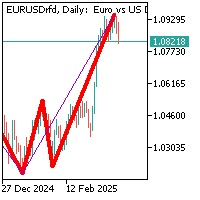
Neste indicador, dois ziguezagues são formados com períodos diferentes de 13 e 55.
Quando dois segmentos do indicador são formados e unidos no lugar, formando assim um preço mínimo ou máximo em um determinado período de tempo, o indicador sinaliza uma possível reversão do preço na direção oposta. Se, ao formar um ziguezague com o menor período (período 13), o maior período (período 55) permanecer no mesmo mínimo ou máximo, isso significa que um movimento corretivo para o máximo ou mínimo anteri

Trend Risk Analyzer intelligently identifies trends, impulses, and corrections, calculating optimal trade volumes and safe levels for stop-loss and take-profit. Increase your accuracy, reduce risks, and boost your trading profits! This product is also available for MetaTrader 4 => https://www.mql5.com/en/market/product/134800 The key feature of Trend Risk Analyzer is its capability to calculate the average range of each market element, enabling traders to set justified stop-loss and take-profi

API BullBearPower mtf MT5 Designed for traders who rely on BullBearPower, this tool provides a multi-timeframe (MTF) view of BullBearPower, helping you identify possible dominant trends. Key Features: Multi-Timeframe Analysis – Analyze BullBearPower across different timeframes in real time. Dynamic Color Changes – Identify possible BullBearPower per individual timeframe with color changes. Volume Integration – Get a picture of possible trend strength with BullBearPower volume of each time

Elite Market Precision Indicator: Outsmart Institutional Manipulation with Fibonacci & Pivot Synergy The Institutional Trap: Why Most Traders Fail The financial markets are a battlefield where institutional traders manipulate price action to create false breakouts, liquidity hunts, and engineered reversals. Most retail traders fall victim to these deceptive moves, leading to emotional trading, fake signals, and capital losses. The Solution: Precision Trading with Fibonacci, Pivot Points & Candle

Trend magic indicator uses cci and atr to create buy and sell in the market . this a a line that changes its color when any of the conditions occur ie buy and sell . I find the indicator given you a bit of a better entry when you change the parameters to CCI=20, ATR=100, ATR MULTIPLIER= 2.
Set up entry just above the indicatror afetr a retracement. Set your stop loss a 20 cents to a dollar (depending on share size) below your entry. Be ready to enter a new position above indicator again if you

The indicator is a combination of 3 identical moving averages with a JMA calculation option with different smoothing depth settings. When the fast line crosses the middle and slow lines, the color of all lines changes, and only when the fast line crosses the middle and slow lines in the opposite direction will the color change - a trigger is triggered that does not allow switching directions if only the middle or slow line was crossed, so that the readings do not jump and there is a confident

TickATR Indicator for MT5 Description The TickATR indicator is a powerful volatility measurement tool for MetaTrader 5 that displays the Average True Range (ATR) in terms of actual price ticks. This innovative approach provides traders with a more precise and instrument-independent way to gauge market volatility compared to traditional ATR indicators. By measuring volatility in ticks rather than price units, TickATR offers consistent readings across different instruments regardless of their pric
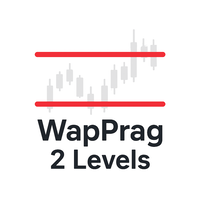
The WapPrag indicator is a reliable tool for determining the trend. It is based on comparing the levels of two periods - senior and junior. This allows you to accurately determine the market direction and avoid false signals in the sideways.
When the level of the junior period is above the level of the senior, and the price is fixed above both levels - this is a clear signal of an upward trend. When the level of the junior period is below the senior, and the price falls below both levels - thi

Gold Rush Scalper The Gold Rush Scalper is a simple yet powerful trading indicator designed for scalping gold (XAU/USD) on the 5-minute chart. It provides clear Buy and Sell arrows, helping traders identify potential trade opportunities with ease.
Key Features:
Buy & Sell Arrows Only: No extra indicators, just precise entry signals. 5-Minute Timeframe : Specifically designed for fast-paced gold trading.
Gold ( XAU/USD ) Only: Not intended for other assets .
No Built-in Risk Management: Trade

FX QUICKSTRIKE Is a high-speed scalping tool designed for gold and forex pairs, providing precise buy and sell arrow signals on the 5-minute timeframe. It leverages momentum shifts, volatility spikes, and price action patterns to detect optimal entry points.
Trade Filtering: Avoids choppy markets by detecting low volatility zones to reduce false signals.
Lot Size Management: Recommends adjusting lot size based on account balance to prevent overexposure.
Spread Protection: Ensures trades are

Spike Hunter B500 A precision trading tool designed exclusively for the B500 1-minute chart. It identifies sharp price movements and potential trade opportunities with built-in risk indication features to help manage volatility. Ideal for traders looking to capitalize on quick market spikes. Alert notifications Push notifications
Disclaimer: Trading involves significant risk of capital loss. You trade at your own risk. Past performance does not guarantee future results. Use proper risk manage
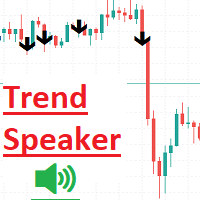
O indicador Trend Speaker é uma ferramenta poderosa projetada para traders que desejam facilmente rastrear e analisar as tendências do mercado em tempo real. Ele fornece sinais claros e confiáveis de compra e venda no gráfico, tornando muito conveniente avaliar a tendência atual do mercado. Com sua interface amigável, o Trend Speaker garante que você nunca perca uma oportunidade de negociação potencial, ajudando você a tomar decisões informadas e melhorar sua estratégia de negociação. Ele exibe

Receive notifications for multi-trendline or single trendline breakout. Yes! You heard us right! You will be notified the moment price crosses any and all the timeframe trendlines that you have chosen. 1. ADDING MULTIPLE OR SINGLE TRENDLINES IN THE SAME DIRECTION To trigger a stronger trading opportunity you can require that price breaks one or more trend lines of different timeframes in the same direction. To do this navigate to the timeframe for which you want to add a trendline and click
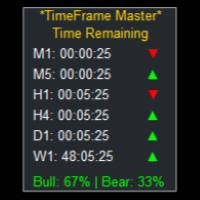
TimeFrame Master: Multi-Timeframe Countdown & Trend Analyzer Unlock the Power of Precise Market Timing with TimeFrame Master: Your Ultimate Multi-Timeframe Countdown Solution! Elevate your trading game with this revolutionary indicator designed to transform your MetaTrader into a powerful time management and trend analysis tool. Key Features: Real-Time Countdown Timers : Never miss a candle close again with precise countdown timers for all your favorite timeframes. Multi-Timeframe Analysis : M
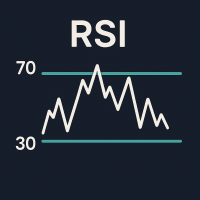
RSI Power Bars – Clear and Precise Momentum Visualization Description: This indicator upgrades the classic RSI into a much more visual and powerful tool. Instead of a flat line, it displays colored bars that instantly show the direction and strength of price movement. Red = bullish momentum
Green = weakness or pullback No more guessing trend shifts or calculating momentum mentally — you see it instantly . Key Benefits: Instantly spot trend reversals Visualize market momentum with bars

Spearman Rank MTF – Momentum Oscillator with Trend Intelligence The Spearman Rank MTF is a powerful oscillator designed to measure trend strength and direction using a statistical approach based on Spearman's Rank Correlation . This indicator excels at detecting trend changes, key reversals, and overbought/oversold conditions with precision and clear visual cues. Key Benefits Multi-Timeframe (MTF) support – analyze higher timeframes without leaving your current chart. Dual smoothing modes –
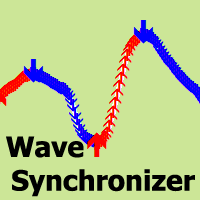
O Wave Synchronizer é um indicador visual de análise de ondas. Combina sequências de movimentos de velas e cria ondas direcionais, produzindo movimentos sincronizados juntamente com o mercado.
O início de cada onda começa com uma seta de sinalização, existindo também alertas.
O indicador nunca redesenhará ou moverá as setas no histórico anterior.
Aparecem setas de sinal no fecho da vela.
Adapta-se para trabalhar com quaisquer instrumentos de negociação e prazos.
Fácil de utilizar e configurar,
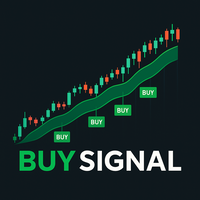
This indicator has been developed as an analytical tool based on exponential moving averages (EMA) . Its purpose is to provide additional insights into market dynamics using two exponential moving averages (EMA) and one smoothed exponential moving average (SMMA) . The indicator can be applied to different financial instruments and timeframes, depending on user preferences. Some traders use it on 30-second charts , complementing it with a 2-minute chart . How the Indicator Works The analysis is b

O Indicador Stats Probability (CStatsBoard) para MQL5 é uma ferramenta analítica avançada projetada para medir estatisticamente as flutuações de preço em porcentagens, apresentadas em uma tabela profissional em tempo real dentro de uma sub-janela. Com atualizações rápidas e alta precisão, este indicador é essencial para traders que buscam entender o comportamento do mercado e tomar decisões informadas. Recursos principais:
A ferramenta é exibida em uma sub-janela como uma tabela profissional e

Fibo Harmonic Levels Indicator Overview The Fibo Harmonic Levels indicator is a powerful MetaTrader 5 (MT5) tool designed to automatically plot harmonic Fibonacci-based support and resistance levels on your chart. These levels and can be applied to different timeframes (Daily, Weekly, Monthly) either automatically or manually. The indicator also includes an alert system that notifies traders when price touches or crosses any harmonic level, with configurable pause intervals to prevent

O Live Trades and History Visualizer é um poderoso indicador do MetaTrader 5 concebido para ajudar os negociadores a acompanharem as suas posições abertas e fechadas com indicações visuais muito claras. Quer esteja a monitorizar negociações em tempo real ou a analisar o desempenho passado, esta ferramenta fornece visualizações intuitivas e personalizáveis de pontos de entrada/saída, lucros/perdas e estatísticas de negociação - diretamente no seu gráfico.
Visite o perfil e confira todos os outr

RTS5Pattern-Profi for BTC Professional pattern recognition for MetaTrader 5, made for Bitcoin trading RTS5Pattern-Profi is a powerful tool designed for MetaTrader 5 and fine-tuned for traders working with Bitcoin and other volatile markets. It focuses purely on price action, showing you how patterns repeat over time. There are no indicators, no overfitted systems—just market structure and clean historical insights. Why traders use RTS5Pattern-Profi when trading BTC Each candle in Bitcoin price

ReversalRadar: Precision Trend Identification Indicator Trade With Confidence, Trade With The Trend ReversalRadar is a powerful trend identification tool designed to give traders the edge in spotting high-probability trading opportunities. By accurately identifying the current market direction, this indicator allows you to align your trading strategy with the prevailing trend, significantly increasing your potential for profitable trades. Key Features: Real-time Trend Analysis : Dynamic visual s

Full Functionality of the MT5
"TWR MTF BREAKOUT" INDICATOR
FOR APP SOURCE CODE: t.me/KingRennie
APP SOURCE CODE WORKS FOR MT4 AND MT5
FEE =$1500 The MT5 " TWR MTF BREAKOUT " INDICATOR is a comprehensive trading tool designed to help traders make informed decisions by utilizing Fibonacci levels, time-based analysis, and demarcating major trading sessions. This INDICATOR is ideal for both novice and experienced traders who want to enhance their trading strategies with advanced technical analys
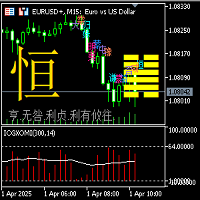
Indicator description of Yijing Guaxiang Oscillation Mean Indicator: (1) This Yijing Guaxiang change indicator is based on the Yin-Yang transformation thought of the "I Ching" philosophy in ancient Chinese culture, integrating the results of the long-short game in each candlestick K-line period of the financial trading K-line chart, using China's oldest prediction coding method, in the form of the 64 hexagrams of the I Ching, combining the Yin-Yang of each line of the hexagram with the Yin-Yang
Full Functionality of the MT5
"TWR DERIV MTF BREAKOUT" INDICATOR
FOR APP SOURCE CODE: t.me/KingRennie
APP SOURCE CODE WORKS FOR MT4 AND MT5
FEE =$1500 The MT5 " TWR DERIV MTF BREAKOUT " INDICATOR is a comprehensive trading tool designed to help traders make informed decisions by utilizing Fibonacci levels, time-based analysis, and demarcating major trading sessions. This INDICATOR is ideal for both novice and experienced traders who want to enhance their trading strategies with advanced tech

Indicator Statistics MultiPairs
1. Current Openning Ords
- Symbols Openning
+ Buy Orders
+ Buy Volume
+ Sell Orders
+Sell Volume
- Floating by Symbols
2. Closed Orders
- Statistics by Today, Week, Month, YTD and Volume
- Sum of Closed Orders by Symbol
3. Statistics by Day
- Statistics by Day and Volume
4. DrawDown by Day
- Each day DrawDown in Week
- Percent of DrawDown
Contact me at Telegram @MaiMew68

A state-of-the-art trading indicator, designed with advanced analytical and mathematical programming, delivers top-tier buy and sell signals. Simply enter a small buy position when a green arrow appears and a small sell position when a red arrow is shown. While signals from this indicator are infrequent, they boast exceptional accuracy when generated. Please apply your own stop-loss and take-profit levels as needed.
O Mercado MetaTrader é a única loja onde você pode baixar um robô demonstração de negociação gratuitamente para testes e otimização usando dados históricos.
Leia a visão geral e opiniões de outros clientes sobre os aplicativos, faça o download para o seu terminal e teste um robô de negociação antes de comprá-lo. Apenas no Mercado MetaTrader você pode testar um aplicativo de forma absolutamente gratuita.
Você está perdendo oportunidades de negociação:
- Aplicativos de negociação gratuitos
- 8 000+ sinais para cópia
- Notícias econômicas para análise dos mercados financeiros
Registro
Login
Se você não tem uma conta, por favor registre-se
Para login e uso do site MQL5.com, você deve ativar o uso de cookies.
Ative esta opção no seu navegador, caso contrário você não poderá fazer login.