YouTubeにあるマーケットチュートリアルビデオをご覧ください
ロボットや指標を購入する
仮想ホスティングで
EAを実行
EAを実行
ロボットや指標を購入前にテストする
マーケットで収入を得る
販売のためにプロダクトをプレゼンテーションする方法
MetaTrader 5のためのテクニカル指標 - 97

Currency Strength Indicator - Track Market Power
Overview: Gain a competitive edge with the Currency Strength Indicator for MetaTrader 5. This intuitive tool measures the relative strength of 8 major currencies and displays them in a clear, sortable table directly on your chart. Perfect for forex traders looking to identify strong and weak currencies at a glance. Key Features: Dynamic Strength Table: Displays real-time strength for EUR, USD, GBP, JPY, CHF, AUD, CAD, and NZD in the upper-left c
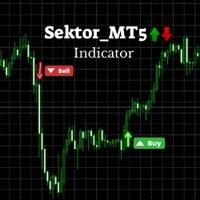
SektorMT5 - Advanced Trading Indicator Specification Automated Buy/Sell Signal Indicator for Meta Trader 5 (MT5)
Setting Description Recommended Value Timeframe (TF) The recommended chart timeframe for optimal signal accuracy. H1 (1 Hour) Symbol The financial instrument on which the indicator works best. XAUUSD (Gold) Lookback Period Number of candles used to determine breakout levels. 24 Candles (Adjustable) Buy Signal Green upward arrow appears when price breaks above resistance. Displayed on

BVP - 高度な買い手/売り手市場スキャナー
BVP(バイヤー/セラーパネル)で複数の時間枠にわたるリアルタイムの市場センチメントを体験 - 現代のトレーダーのために設計された洗練された市場分析ツールです。 なぜBVPなのか?
今日のダイナミックな市場では、買い手と売り手の優位性を理解することが重要です。BVPは、M1からD1まで12の時間枠で即座の視覚的フィードバックを提供し、市場の変化が明らかになる前に察知することができます。 主要機能
動的パーセンテージバーを備えたモダンな視覚的インターフェース リアルタイムの買い手/売り手強度指標 一画面での複数時間枠分析 カラーコード化されたアラートを備えたスマートシグナルシステム 情報に基づいた判断のための正確なパーセンテージ計算 技術革新
BVPは、市場センチメントを判断するための高度な計算方法を使用し、直感的でクリーンなインターフェースを通じてリアルタイムで更新される買い手/売り手比率を表示します。 実践的なメリット
即座の市場センチメント概要 トレンド強度の明確な視覚的シグナル 複数時間枠での確認 迅速な意思決定サポート プロフェッ
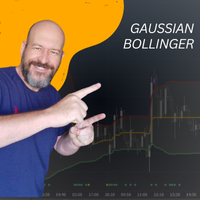
ガウス移動平均を使用したガウスボリンジャーバンド ️ 高度な数学とテクニカル分析の実用性を融合させた革新的なインジケーターで、トレーディング戦略を変革しましょう! ️ 初心者でも熟練トレーダーでも、 ガウスボリンジャーバンド は、市場分析を 次のレベルへ進化させたい 方に最適なソリューションです。この特別なインジケーターは、従来の移動平均をガウス移動平均(GMA)に置き換え、より 敏感で市場環境に適応した ボリンジャーバンドを実現します。 ガウスボリンジャーバンドの主な特徴 ️ ユニークなガウス移動平均: 価格データを効率的に平滑化し、正確なトレンドの読み取りを可能にします。 ️ カスタマイズ可能なバンド: 期間、標準偏差、オフセットの調整が可能で、さまざまな資産や市場状況に対応できます。 ️ 簡単かつ高度な構造: 初心者から上級者まで、視覚的に分かりやすい結果を提供する設計です。 活用法と戦略 「外側にクローズ、内側にクローズ」戦略: 価格が バンドの外側でクローズし 、その後 内側に戻ってクローズする 状況を見つけましょう。

This is an indicator to determine when to sell or buy, and it can be combined with other indicators, such as the SND indicator that I also sell. This indicator is very suitable for BTC, XAU, and NAS100. This is an indicator for MT5. It is highly battle-proven if studied properly. Please consult andriawanjaya@gmail.com before using it. This product is very suitable for XAU, BTC, and NAS100. This product is very limited It is only sold on Gogo Jungle and MQL5.

トレーディングの世界では、すべてのティックが新しい物語の始まりとなる可能性があります。信頼できる味方を持つことが重要です。TrendVarianceSpectrumは単なるトレーディングロボットではありません。それはボラタイルな市場におけるあなたのガイドです。長年の経験を基に構築され、25年以上のデータでトレーニングされたこのシステムは、数学の優雅さと現代技術の力を組み合わせています。 TrendVarianceSpectrumの主な利点: 最小限のドローダウン : TrendVarianceSpectrumは非常に低いドローダウンで動作し、信頼性を重視するトレーダーにとって最も安定したソリューションの1つです。 ボラティリティへの適応性 : このシステムはEURUSD、XAUUSD、EURJPYなどの挑戦的な通貨ペアで優れたパフォーマンスを発揮し、市場の高波動期でも耐性を示します。 複数のタイムフレームでの汎用性 : M30、H1、H2、H3、H4のいずれであっても、TrendVarianceSpectrumはあなたのトレーディングスタイルにシームレスに適応します。 最先端のテクノロ

スマート・ディテクター — スマートマネーとICTの秘密があなたの手に!
大口トレーダーのように取引したいですか? Smart Detector は「スマートマネー (Smart Money)」と Inner Circle Trader (ICT) の戦略を解き明かします。このMetaTrader 5向けインジケーターは、マーケットメーカーが痕跡を残す重要ゾーンを瞬時に特定。強力なオーダーブロックや隠れた Fair Value Gaps (公正価値ギャップ) を見つけ出します。
流動性の隠れ場所を見抜き、それを武器にしよう! スマートマネー – 銀行やヘッジファンドの動向を、蓄積ゾーンとブレイクアウトで追跡。
ICT – 市場構造を深く理解し、転換点や大衆の罠を見抜く。 シンプルかつ効果的! Smart Detector は複雑な分析をシンプルに。
赤色のシグナル → 売り
緑色のシグナル → 買い 推測は不要! 明確なシグナルで、より賢いトレードを実現しよう!

Premium and Discount PDA ICT Indicator for MT5 The Premium and Discount Indicator for MetaTrader 5 is a liquidity-based tool that tracks short-term market movements using a zigzag pattern. It highlights premium and discount zones, assisting traders in identifying optimal entry points and setting Take Profit (TP) and Stop Loss (SL) levels. This indicator is specifically designed to detect minor market shifts, placing a "D" at significant lows and a "P" at key highs. By clicking these markers, tra

TimeView Pro – カスタマイズ可能なローカル時間インジケーター (MetaTrader 5) 概要
TimeView Proは、ユーザーのPCや国の時間に自動的に適応する、完全にカスタマイズ可能な時間表示インジケーターです。類似のインジケーターとは異なり、TimeView Proは高度なカスタマイズオプションを提供し、チャートの視認性を維持しながら時間管理を強化します。 主な機能 ローソク足にスナップ (デフォルトで有効) – タイムラベルが最も近いローソク足に自動的に揃います。 ワンクリックで表示/非表示 – Click Chart + H を使用して、インジケーターの表示を瞬時に切り替え可能。 カスタマイズ可能なライン – 水平線 (デフォルト: 非表示) や 垂直線 (デフォルト: 表示) のオン/オフ切り替えが可能。 柔軟なデザイン設定 – フォントサイズや背景色 などのカスタマイズが可能。 エッジオーバーラップ防止 – ラベルがチャートの端で見えなくなるのを防ぎます。 自由な位置設定 – 上部、中央、下部、またはカスタム位置 に配置可能。 追加情報表示 – サー

JAJ Binary Pro is a precision-driven binary options strategy created by Jamaine Walkin , a full-time trader and investor. Designed for adaptability in Forex and OTC markets , it focuses on high-probability trade setups and disciplined risk management. Optimised for Pocket Option & MT5 , it reflects Jamaine’s structured approach to trading Options, ensuring consistency and confidence in execution.
Always use Proper Risk Management when trading.
このインジケーターは主に手動取引を目的としています。 このインジケーターは最新の価格変動を分析します。独自のアルゴリズムを使用して処理します。 この分析に基づいて、インジケーターは最も重要な価格レベルを計算します。これらのレベルは、価格値を買い、売り、中立の 3 つのゾーンに分割します。価格が適切なゾーンにある場合にのみ、新しいポジションを開く必要があります。価格が中立ゾーンにある場合は、ポジションをクローズしたり、損益分岐点に移動したりすることなどを検討する必要があります。また、このインジケーターはポジションを開くための独自の推奨事項も提供します。これらの瞬間はグラフ上で点で示されます。右隅のパネルには、信号強度の推定値がパーセンテージで表示されます。 インジケータの使用。時間枠を選択します(M5 - D をお勧めします)。希望するインジケーター期間を設定します。インジケーターが初めて起動するときは、数秒かかる場合があります。これは、インジケーターが履歴データから収集する統計を必要とするためです。また、インジケーターにはアラートを有効にしてメッセージを送信する機能もあります。ただし
The Volume Difference indicator displays the difference in tick volume between the current and previous bars. It is designed to identify changes in market activity, which can signal important market actions.
Green bars show an increase in volume compared to the previous bar (positive difference).
Red bars indicate a decrease in volume (negative difference).
The indicator is built in a separate window and is suitable for use both independently and as part of more complex strategies for analyz

PipHistogram is an essential tool for traders who want to gain insight into price distribution and concentration. Its customizable, visually appealing histogram allows you to pinpoint key levels and make more informed trading decisions. Enhance your market analysis and improve your trading strategy with PipHistogram —your shortcut to understanding price dynamics in MetaTrader 5. Overview : PipHistogram is a powerful indicator for MetaTrader 5 that visually displays the percentage distribu

The best and the only World Time Display for MT5
Features :
- JAPAN, LONDON & NEW YORK Time Display
- You can customize with different Font, Color And Text Size
- You can customize Box Position and Box Color to meet your satisfaction
- Only For Metatrader 5
- Customize GMT according to your Time Zone
- Simple To Use. Just Attach to your MT5
- No hidden code or no errors

Introduction to the Manual Backtesting Indicator on MQL5 The MetaTrader platform provides an excellent backtesting tool for evaluating Expert Advisors (EAs). However, when it comes to manually backtesting a strategy to assess its effectiveness, this tool has some limitations: You cannot manually draw zones or trend lines while in backtesting mode. You cannot switch timeframes to check time alignment. For example, if my strategy requires additional confirmation from a higher timeframe (HTF), this

Product Name : SII - Synthetic Indices Indicator
Overview :
The SII (Synthetic Indices Indicator) is a specialized trading tool designed to identify high-probability levels in synthetic indices using imbalances. By leveraging the concept of imbalances, SII provides traders with precise insights into potential market reversals and continuations, enhancing trading accuracy and decision-making.
Key Features
1. Imbalance Detection: SII automatically identifies and marks imbalances on the chart,

Candle Reversal , is designed to identify and highlight key candlestick patterns that signal potential trend reversals or continuations in the market. It focuses on two primary types of patterns: 3-Line Strike Patterns (Bullish and Bearish) Engulfing Patterns (Bullish and Bearish) The indicator provides visual cues (arrows and text labels) on the chart to help traders quickly identify these patterns, making it easier to make informed trading decisions. use with MACD or awesome oscilator to

VANGARD Trade Info MT5 – 高度な取引情報と完全なコントロール! VANGARD Trade Info MT5 は、 リアルタイムで取引状況を監視したいトレーダー にとって必須のツールです。 カスタマイズ可能なプライバシー設定、調整可能なインターフェース、スマートマージンアラート を備え、 取引の詳細情報、マージンレベル、スワップ、コスト などを最適化されたインターフェースで表示します。これにより、より迅速かつ効率的な意思決定が可能になります。 VANGARD Trade Info MT5 を選ぶ理由 リアルタイムの詳細情報 – オープントレード、P&L(損益)、マージンレベル、スワップ、マージンコストを即座に確認。 カスタマイズ可能なプライバシー設定 – 残高、マージン、資産情報の表示・非表示を自由に切り替え可能。 調整可能なインターフェース – フォント、カラー、スタイルを変更して、自分好みにカスタマイズ可能。 スマートマージンアラート – MetaTraderアラート、PUSHモバイル通知、Eメール通知 で、マージンが危険水準

Supertrend is a trend-following indicator based on Average True Range (ATR). The calculation of its single line combines trend detection and volatility. It can be used to detect changes in trend direction and to position stops. History The Supertrend indicator was created by Olivier Seban. Calculations To calculate bands of the Supertrend, use the following formulas: hl2 = (high + low) / 2 basicUpperBand = hl2 + (multiplier × ATR) basicLowerBand = hl2 - (multiplier × ATR) upperBand = basicUpper

PMax is a brand new indicator developed by KivancOzbilgic in earlier 2020. It's a combination of two trailing stop loss indicators; One is Anıl Özekşi's MOST (Moving Stop Loss) Indicator and the other one is well known ATR based SuperTrend. Both MOST and SuperTrend Indicators are very good at trend following systems but conversely their performance is not bright in sideways market conditions like most of the other indicators. PMax tries to solve this problem. PMax combines the powerful sides of

MATRIX Market Scanner
Comprehensive Analytics Without the Complexity Our innovative, cell-based dashboard gives you a panoramic view of the market—letting you monitor multiple instruments and timeframes seamlessly. Its high level of customization delivers an intuitive, dynamic display that adapts to your trading style, empowering you to see the bigger picture and make smarter, faster decisions. New Update The latest update to the Indicator Matrix Market Scanner introduces a powerful new feature

"Unlock deeper market insights with our advanced MQL5 Volume Indicator! This tool combines real-time volume data with an EMA25 overlay, highlighting key zones where volume surges at least 1.5 times above the EMA25—perfect for spotting high-impact trends. Customize colors and opacity effortlessly to suit your style. Plus, streamline your charts by disabling MT5’s default volume display: simply go to the chart settings, uncheck the built-in volume option, and let our indicator take the lead. Prec

A powerful trend-following tool that uses ATR-based volatility to identify market trends across multiple timeframes . This enhanced version allows you to overlay the SuperTrend of a higher timeframe directly on your current chart, helping you align your trades with the dominant trend. How It Works The indicator calculates dynamic support and resistance levels using Average True Range (ATR) : Upper Band = Source Price + (Multiplier × ATR) Lower Band = Source Price - (Multiplier × ATR) In an uptre
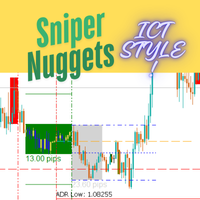
!!!!!!!! Sniper Nuggets !!!!!!!!
Sniper Nuggets is an all-in-one indicator for many things ICT style. It includes the following functionalities: Custom periods : which allow you to set custom daily period start and end times according to your taste. ADR Markers: which plots the average daily range. Worktime: which plots the various boxes on the chart for Asia range (including its high, low and midpoints, standard deviation predictions ), London open, New York open, CME open and London close.

### Introducing the Price Action Ultimate Suite – The Ultimate Trading Tool for Professional Traders!
Are you searching for a powerful tool to elevate your Price Action trading strategy? Look no further than the **Price Action Ultimate Suite** – a comprehensive and intelligent indicator for MetaTrader 5 (MT5) – designed to be your trusted partner in conquering the financial markets! Packed with advanced features and user-friendly functionality, this indicator helps you identify key price patte
Hello, traders! Welcome to the introduction of Multi Timeframe Analyzer v1.0 ! ( MT5 )
This is the Meta Trader 5 version of the "Market Meeter". Click here to Get MT4 version <<---
What is this indicator? Simply put, this indicator analyzes the market across eight different timeframes , from lower to higher, and predicts the next price direction along with an estimated continuation time. It does this by using volume, volatility, and price patterns in its calculations. Let's dive into the inf

このツールは、強力な高頻度ティック分析ツールであり、膨大な市場データを自動的に処理し、トレーダーに市場活動の正確な全体像を提供することで、取引機会を捉えることができます。あらゆる取引スタイルに簡単に適応できるTickFlowは、市場の変化に即座に対応し、重要なサポートレベル、レジスタンスレベル、クラスタゾーンを特定するあなたの個人的な分析アシスタントとなります。 TickFlowは、インテリジェントなビッグデータ処理と直感的な視覚化を組み合わせた現代的な分析プラットフォームです。このインジケーターは、隠れたトレンドや価格のダイナミクスを明らかにし、あなたの戦略に素早く適応するための柔軟な設定を提供します。現在のティックデータと過去のティックデータを慎重に集計することで、重要な市場ゾーンをタイムリーに特定します。TickFlowは、単独の分析ツールとして使用することも、既存の手法の補完として使用することもでき、市場の微細構造に深い洞察を提供します。 TickFlowが提供するもの: 価格ダイナミクスの便利な表示。 需給バランスの理解。 市場のボラティリティへの迅速な適応。 市場の重要な
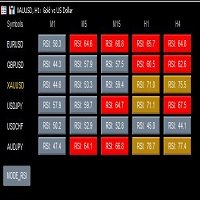
This is a powerful multi cycle, multi currency pair, and multi indicator monitoring tool for MT5 version, with main functions including: 1. Monitor real-time performance of multiple indicators, including RSI, MACD, MA, and STO. 2. Monitor multiple currency pairs, customizable to add or delete currency pairs, and automatically update indicators. 3. Monitor multiple currency pairs over multiple cycles. 4. After clicking, you can directly switch to the chart and cycle you want to view. 5. Click th

This is a custom indicator script for MetaTrader, designed to generate buy and sell signals based on price action relative to Bollinger Bands. It identifies potential trade opportunities when the closing price crosses the lower Bollinger Band, plotting arrows on the chart to highlight entry points. Key Features: Buy and Sell Signals: A buy signal is generated when the closing price moves above the lower Bollinger Band after being below it. A sell signal is triggered when the closing price moves
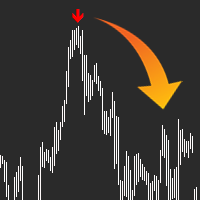
QUICK OVERVIEW: Use AI to predict the markets with AI Arrow, the ultimate trading tool, let it manage the probabilities and send you a simple signal in the form of an arrow, ready to trade, no complex configurations. The indicator will analyze the market and let you know when a potential movement will happen, sometimes it takes some extra bars for the movement to happen as it can't predict the exact top/bottom every time. Arrow will appear at the start of a new bar and alert you, so you have ti

Scalping Signals Pro is a powerful custom indicator designed to help traders identify key market turning points with ease. It provides clear Buy and Sell signals directly on the chart, making it ideal for traders who want to enhance their decision-making process. Key Features:
️ Intuitive and user-friendly interface
️ Non-repainting Buy and Sell signals
️ Works across different timeframes and assets
️ Designed for trend-following and reversal strategies
️ Customizable settings to fit yo

AdaptiveMomentumCCI Indicator
The AdaptiveMomentumCCI is a custom technical indicator for MetaTrader 5 that enhances the traditional Commodity Channel Index (CCI) by incorporating adaptive period adjustments, momentum analysis, and signal filtering. It calculates a smoothed CCI based on a user-defined price source (e.g., HLC/3, OHLC/4, or close), with its period dynamically adjusted using the Average True Range (ATR) to reflect market volatility. The indicator features a dual-line system with

Mini Índice Composition: A Revolução na Análise do Mini Índice! O Mini Índice Composition é um indicador inovador que monitora em tempo real as principais ações que compõem o mini índice, trazendo uma visão quantitativa poderosa sobre o fluxo de ordens do mercado! Como Funciona? Diferente de outros indicadores que utilizam apenas dados históricos, o Mini Índice Composition faz uma leitura ao vivo das ordens que entram e saem das ações, pesando o impacto direto no mini índice. Com

Fibomathe Indicator: Support and Resistance Tool for MT5 The Fibomathe Indicator is a technical analysis tool designed for MetaTrader 5 (MT5) that assists traders in identifying support and resistance levels, take-profit zones, and additional price projection areas. It is suitable for traders who use structured approaches to analyze price action and manage trades. Key Features Support and Resistance Levels:
Allows users to define and adjust support and resistance levels directly on the chart.

Buy Signal Indicator This indicator generates a Bu y Signal when a potential upward movement is detected. A G reen Arrow appears below the price chart, indicating a possible entry point for a long position. The signal helps traders identify moments of strength in the market.
TIP:- USE 1 HOUR OR BIGGER TIMEFRAMES FOR BETTER RESULTS. TRAIL STOP LOSS BY USING NEAREST SWING HIGHS AND LOWS. NOTE:- THIS INDICATOR GIVES ONLY BUY SIGNALS FOR SELL SIGNAL USE MY OTHER INDICATOR.

Sell Signal Indicator This indicator generates a Sell Signal when a potential downward movement is detected. A Red Arrow appears above the price chart, indicating a possible entry point for a short position. The signal helps traders identify moments of strength in the market.
TIP:- USE 1 HOUR OR BIGGER TIMEFRAMES FOR BETTER RESULTS. TRAIL STOP LOSS BY USING NEAREST SWING HIGHS AND LOWS. NOTE:- THIS INDICATOR GIVES ONLY SELL SIGNALS FOR BUY SIGNAL USE MY OTHER INDICATOR.

Matrix Currency – Multi-Timeframe Analysis Tool The Matrix Currency is an advanced indicator designed to analyze currency strength in the Forex market. It provides efficient monitoring and strategic support for traders seeking clear and actionable insights. Key Features Multi-Timeframe Analysis : Simultaneously monitors multiple timeframes (from M1 to MN1) with real-time updates, displayed in an intuitive matrix format. Alert System : Customizable notifications via pop-up, email, and mobile devi
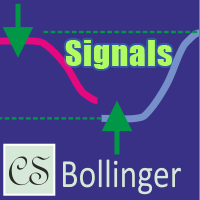
CS Bollinger – ボリンジャーバンドをベースにしたシグナルインジケーターであり、主要なサポートおよびレジスタンスの水準を迅速に特定し、視覚的なトレードシグナルを提供します。レベル切替えの改良されたロジックにより、インジケーターはチャート上で自動的にレベルを調整し、価格の反転が確認されるとシグナル矢印を表示します。これにより、トレーダーは市場へのエントリーおよびエグジットに最適なタイミングを素早く見つけることができます。柔軟な設定により個々のトレード戦略に合わせて調整可能であり、初心者から経験豊富なトレーダーまで幅広く対応しています。
パラメータ
デフォルト値
説明
BollingerPeriod
5 ボリンジャーバンドの計算期間。平均値を計算するためのバーの数を指定します。
BollingerDeviation
5 バンドの上限および下限ラインを計算するための偏差係数
CheckZeroBar
false シグナル生成時に最新バー(ゼロバー)をチェックするかどうか
ColorResistance
clrDeepPink
上から下への反転レベルを示すレ

This is a true trend lines indicator for MT4/MT5.
This indicator draw real trend lines.
Usually the trend line is drawn as a solid line.
The next trend line that is likely to be valid is drawn as a dotted line.
The most recent invalidated trend line is drawn as a dashed line.
Three-touch lines is drawn as a bright colors.
If the starting point of the trend line is new, the blue line is displayed(call shortline),
if it is old, the gold line is displayed(call longline).
The number of bars border

Parabolic SAR + Deviation [BigBeluga] is an enhanced Parabolic SAR indicator designed to detect trends while incorporating deviation levels and trend change markers for added depth in analyzing price movements. Key Features: > Parabolic SAR with Optimized Settings: Built on the classic Parabolic SAR, this version uses predefined default settings to enhance its ability to detect and confirm trends. Clear trend direction is indicated by smooth trend lines, allowing traders to easily visuali

インジケータは、売買シグナルを示しています。 任意の時間枠、任意の通貨ペア。 パラメータ: alertsMessage-メッセージウィンドウを無効にして有効にします。 alertsSound-サウンドをオフまたはオンにします。 矢印の種類-矢印アイコンを選択するためのものです。 インジケータ信号をフィルタリングする3つの簡単な方法: より古い時間枠からの表示器の読書との方向を点検しなさい。 標準のMACDチャートを使用します。 放物線インジケータを使用してください。 責任の免責事項: また、お金の管理を忘れて損失を止めるべきではありません。 レバレッジを使って外国為替やその他の金融商品を取引することは非常に危険であり、重大な損失につながる可能性があります。 市場での取引操作を行うことは、すべての人に適しているわけではありません。 質問や疑問がある場合は、すべてのリスクを認識し、独立した財務アドバイザーの助けを求める必要があります。 あなたの取引システムの補助要素として指標を使用することをお勧めします。 指標を購入することで、外国為替通貨市場に存在するすべてのリスクを理解し、受け入れます
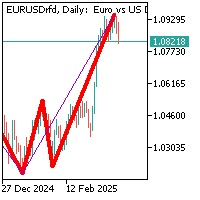
この指標には、周期が13と55の異なる2つのジグザグが形成されています。
インジケータの2つのセグメントが所定の位置に形成されて接続され、それによって特定の時間枠で価格の最小値または最大値を形成すると、インジケータは反対方向の可能性のある価格反転を通知します。 最小期間(期間13)でジグザグを形成するときに、最大期間(期間55)が同じ最小または最大のままである場合、これは前の最大または最小への修正移動が可 重要! より短い期間のジグザグインジケータの新しいアームが形成された後に位置を追加する必要があります。 それ以外の場合は、負の利益値が可能です。また、ジグザグのジュニアアームを形成した後、それは可能です 90%の信任の損失なしでこの器械の位置を再配列するため。 この方法では、価格を絞ることができます。ジグザグインジケータには重大な欠点があることに注意してください, これは、強い価格の動きで価格を書き換えることで表現されます。したがって、私は価格の動きのフィルタとして追加の他の指標を使用することをお勧めします。

Trend Risk Analyzer intelligently identifies trends, impulses, and corrections, calculating optimal trade volumes and safe levels for stop-loss and take-profit. Increase your accuracy, reduce risks, and boost your trading profits! This product is also available for MetaTrader 4 => https://www.mql5.com/en/market/product/134800 The key feature of Trend Risk Analyzer is its capability to calculate the average range of each market element, enabling traders to set justified stop-loss and take-profi

API BullBearPower mtf MT5 Designed for traders who rely on BullBearPower, this tool provides a multi-timeframe (MTF) view of BullBearPower, helping you identify possible dominant trends. Key Features: Multi-Timeframe Analysis – Analyze BullBearPower across different timeframes in real time. Dynamic Color Changes – Identify possible BullBearPower per individual timeframe with color changes. Volume Integration – Get a picture of possible trend strength with BullBearPower volume of each time

Elite Market Precision Indicator: Outsmart Institutional Manipulation with Fibonacci & Pivot Synergy The Institutional Trap: Why Most Traders Fail The financial markets are a battlefield where institutional traders manipulate price action to create false breakouts, liquidity hunts, and engineered reversals. Most retail traders fall victim to these deceptive moves, leading to emotional trading, fake signals, and capital losses. The Solution: Precision Trading with Fibonacci, Pivot Points & Candle

Trend magic indicator uses cci and atr to create buy and sell in the market . this a a line that changes its color when any of the conditions occur ie buy and sell . I find the indicator given you a bit of a better entry when you change the parameters to CCI=20, ATR=100, ATR MULTIPLIER= 2.
Set up entry just above the indicatror afetr a retracement. Set your stop loss a 20 cents to a dollar (depending on share size) below your entry. Be ready to enter a new position above indicator again if you

The indicator is a combination of 3 identical moving averages with a JMA calculation option with different smoothing depth settings. When the fast line crosses the middle and slow lines, the color of all lines changes, and only when the fast line crosses the middle and slow lines in the opposite direction will the color change - a trigger is triggered that does not allow switching directions if only the middle or slow line was crossed, so that the readings do not jump and there is a confident

TickATR Indicator for MT5 Description The TickATR indicator is a powerful volatility measurement tool for MetaTrader 5 that displays the Average True Range (ATR) in terms of actual price ticks. This innovative approach provides traders with a more precise and instrument-independent way to gauge market volatility compared to traditional ATR indicators. By measuring volatility in ticks rather than price units, TickATR offers consistent readings across different instruments regardless of their pric
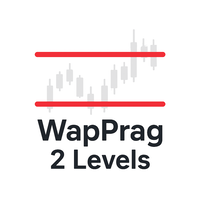
The WapPrag indicator is a reliable tool for determining the trend. It is based on comparing the levels of two periods - senior and junior. This allows you to accurately determine the market direction and avoid false signals in the sideways.
When the level of the junior period is above the level of the senior, and the price is fixed above both levels - this is a clear signal of an upward trend. When the level of the junior period is below the senior, and the price falls below both levels - thi

Gold Rush Scalper The Gold Rush Scalper is a simple yet powerful trading indicator designed for scalping gold (XAU/USD) on the 5-minute chart. It provides clear Buy and Sell arrows, helping traders identify potential trade opportunities with ease.
Key Features:
Buy & Sell Arrows Only: No extra indicators, just precise entry signals. 5-Minute Timeframe : Specifically designed for fast-paced gold trading.
Gold ( XAU/USD ) Only: Not intended for other assets .
No Built-in Risk Management: Trade

FX QUICKSTRIKE Is a high-speed scalping tool designed for gold and forex pairs, providing precise buy and sell arrow signals on the 5-minute timeframe. It leverages momentum shifts, volatility spikes, and price action patterns to detect optimal entry points.
Trade Filtering: Avoids choppy markets by detecting low volatility zones to reduce false signals.
Lot Size Management: Recommends adjusting lot size based on account balance to prevent overexposure.
Spread Protection: Ensures trades are

Spike Hunter B500 A precision trading tool designed exclusively for the B500 1-minute chart. It identifies sharp price movements and potential trade opportunities with built-in risk indication features to help manage volatility. Ideal for traders looking to capitalize on quick market spikes. Alert notifications Push notifications
Disclaimer: Trading involves significant risk of capital loss. You trade at your own risk. Past performance does not guarantee future results. Use proper risk manage
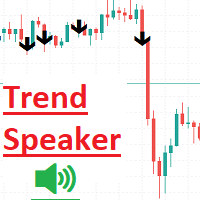
Trend Speakerインジケーター は、リアルタイムで市場のトレンドを簡単に追跡し、分析したいトレーダーのために設計された強力なツールです。チャート上で明確で信頼できる買いと売りのシグナルを提供し、市場の現在のトレンドを非常に便利に評価できます。ユーザーフレンドリーなインターフェースを備えたTrend Speakerは、潜在的な取引機会を見逃すことなく、情報に基づいた意思決定を行い、取引戦略を強化するのに役立ちます。すべてのBUYおよびSELLシグナルには、ストップロス(Stop Loss)とテイクプロフィット(Take Profit)が表示されます。 スクリーンショットでは: 緑の点は、TP1からTP7までのTake Profitを表します 赤い点は、Stop Lossを表します。 使用法: すべての時間枠で実行できます。 BUYおよびSELLの矢印の色と幅を自分で簡単に変更できます。 このインジケーターの使用は非常に簡単で便利です。リラックスして、すべてがうまくいきます。 プロパティを変更することで、TPとSLを簡単に表示または非表示にできます。
もしこのインジケーターが

Receive notifications for multi-trendline or single trendline breakout. Yes! You heard us right! You will be notified the moment price crosses any and all the timeframe trendlines that you have chosen. 1. ADDING MULTIPLE OR SINGLE TRENDLINES IN THE SAME DIRECTION To trigger a stronger trading opportunity you can require that price breaks one or more trend lines of different timeframes in the same direction. To do this navigate to the timeframe for which you want to add a trendline and click
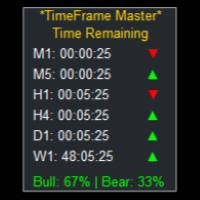
TimeFrame Master: Multi-Timeframe Countdown & Trend Analyzer Unlock the Power of Precise Market Timing with TimeFrame Master: Your Ultimate Multi-Timeframe Countdown Solution! Elevate your trading game with this revolutionary indicator designed to transform your MetaTrader into a powerful time management and trend analysis tool. Key Features: Real-Time Countdown Timers : Never miss a candle close again with precise countdown timers for all your favorite timeframes. Multi-Timeframe Analysis : M
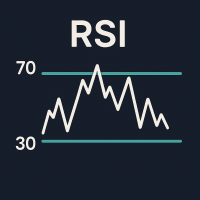
RSI Power Bars – Clear and Precise Momentum Visualization Description: This indicator upgrades the classic RSI into a much more visual and powerful tool. Instead of a flat line, it displays colored bars that instantly show the direction and strength of price movement. Red = bullish momentum
Green = weakness or pullback No more guessing trend shifts or calculating momentum mentally — you see it instantly . Key Benefits: Instantly spot trend reversals Visualize market momentum with bars

Spearman Rank MTF – Momentum Oscillator with Trend Intelligence The Spearman Rank MTF is a powerful oscillator designed to measure trend strength and direction using a statistical approach based on Spearman's Rank Correlation . This indicator excels at detecting trend changes, key reversals, and overbought/oversold conditions with precision and clear visual cues. Key Benefits Multi-Timeframe (MTF) support – analyze higher timeframes without leaving your current chart. Dual smoothing modes –
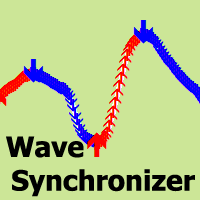
Wave Synchronizer は、波動分析の視覚的なインジケーターです。ローソク足の動きのシーケンスを組み合わせて方向性のある波を構築し、市場と同期した動きを生み出します。
各波の始まりはシグナル矢印で始まり、アラートもあります。
インジケーターは、以前の履歴の矢印を再描画したり移動したりすることはありません。
シグナル矢印は、ローソク足の終値に表示されます。
あらゆる取引商品や時間枠で動作するように適応します。
使いやすく設定も簡単で、入力パラメーターは 2 つだけです。選択したパラメーターで使用する時間枠の選択と、MA ラインの計算方法です。
推奨パラメーターは 1 ~ 2 期間シフトできます。
取引資産を購入する場合は矢印の方向が赤になります。
取引資産を売却する場合は矢印の方向が青になります。
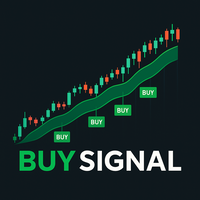
This indicator has been developed as an analytical tool based on exponential moving averages (EMA) . Its purpose is to provide additional insights into market dynamics using two exponential moving averages (EMA) and one smoothed exponential moving average (SMMA) . The indicator can be applied to different financial instruments and timeframes, depending on user preferences. Some traders use it on 30-second charts , complementing it with a 2-minute chart . How the Indicator Works The analysis is b

Stats Probability (CStatsBoard) MQL5 インジケーターは、価格の変動をパーセンテージとして統計的に測定し、サブウィンドウ内にプロフェッショナルなテーブル形式でリアルタイムに表示する先進的な分析ツールです。高速な更新と抜群の精度を備えており、市場の動向を深く理解し、情報に基づいた意思決定を行いたいトレーダーにとって必須のツールです。 主な機能:
このツールは、サブウィンドウ内にスタイリッシュでプロフェッショナルなテーブル(CStatsBoard)として表示され、リアルタイムで更新されます。高速なパフォーマンスと高い精度を保証し、以下の4つの分析オプションを提供して価格のボラティリティを評価します: 最大レンジ統計 (Max Range Stats): 1か月内の最高価格と最低価格の間のパーセンテージ範囲を計算します。 始値-高値統計 (Open - High Stats): その月の始値からその月の高値までのパーセンテージ差を測定します。 始値-安値統計 (Open - Low Stats): その月の始値からその月の安値までのパーセンテージ差を測定

Fibo Harmonic Levels Indicator Overview The Fibo Harmonic Levels indicator is a powerful MetaTrader 5 (MT5) tool designed to automatically plot harmonic Fibonacci-based support and resistance levels on your chart. These levels and can be applied to different timeframes (Daily, Weekly, Monthly) either automatically or manually. The indicator also includes an alert system that notifies traders when price touches or crosses any harmonic level, with configurable pause intervals to prevent

ライブトレードと履歴ビジュアライザーは、トレーダーがオープンポジションとクローズポジションを鮮明なビジュアルアイコンで追跡できるように設計された強力なMetaTrader 5インジケーターです。ライブトレードを監視する場合でも、過去のパフォーマンスを分析する場合でも、このツールは、エントリー/エグジットポイント、利益/損失、およびトレード統計を、チャート上に直接、直感的かつカスタマイズ可能に表示します。
プロフィールを訪問 & 他のMT4/MT5製品すべてをチェックアウト
レビューをお忘れなく
主な特徴:
エントリーと現在価格を結ぶダイナミックなラインにより、アクティブなトレードを視覚化
リアルタイムで損益を即座に更新
エントリー/エグジットマーカーとトレンドラインにより、過去のトレードを表示
トレードの詳細(利益、獲得/損失ポイント、ポジションサイズ)を一目で表示
トレードタイプ(買い/売り)とリミット表示履歴によるフィルタリング
最近のトレードと損益を表示するサマリーテーブル(オプション)
パフォーマンスを素早く確認できる、すっきりと整理されたレイアウト

RTS5Pattern-Profi for BTC Professional pattern recognition for MetaTrader 5, made for Bitcoin trading RTS5Pattern-Profi is a powerful tool designed for MetaTrader 5 and fine-tuned for traders working with Bitcoin and other volatile markets. It focuses purely on price action, showing you how patterns repeat over time. There are no indicators, no overfitted systems—just market structure and clean historical insights. Why traders use RTS5Pattern-Profi when trading BTC Each candle in Bitcoin price

ReversalRadar: Precision Trend Identification Indicator Trade With Confidence, Trade With The Trend ReversalRadar is a powerful trend identification tool designed to give traders the edge in spotting high-probability trading opportunities. By accurately identifying the current market direction, this indicator allows you to align your trading strategy with the prevailing trend, significantly increasing your potential for profitable trades. Key Features: Real-time Trend Analysis : Dynamic visual s

Full Functionality of the MT5
"TWR MTF BREAKOUT" INDICATOR
FOR APP SOURCE CODE: t.me/KingRennie
APP SOURCE CODE WORKS FOR MT4 AND MT5
FEE =$1500 The MT5 " TWR MTF BREAKOUT " INDICATOR is a comprehensive trading tool designed to help traders make informed decisions by utilizing Fibonacci levels, time-based analysis, and demarcating major trading sessions. This INDICATOR is ideal for both novice and experienced traders who want to enhance their trading strategies with advanced technical analys
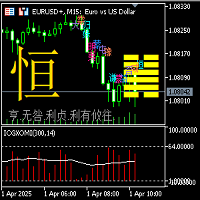
Indicator description of Yijing Guaxiang Oscillation Mean Indicator: (1) This Yijing Guaxiang change indicator is based on the Yin-Yang transformation thought of the "I Ching" philosophy in ancient Chinese culture, integrating the results of the long-short game in each candlestick K-line period of the financial trading K-line chart, using China's oldest prediction coding method, in the form of the 64 hexagrams of the I Ching, combining the Yin-Yang of each line of the hexagram with the Yin-Yang
Full Functionality of the MT5
"TWR DERIV MTF BREAKOUT" INDICATOR
FOR APP SOURCE CODE: t.me/KingRennie
APP SOURCE CODE WORKS FOR MT4 AND MT5
FEE =$1500 The MT5 " TWR DERIV MTF BREAKOUT " INDICATOR is a comprehensive trading tool designed to help traders make informed decisions by utilizing Fibonacci levels, time-based analysis, and demarcating major trading sessions. This INDICATOR is ideal for both novice and experienced traders who want to enhance their trading strategies with advanced tech

Indicator Statistics MultiPairs
1. Current Openning Ords
- Symbols Openning
+ Buy Orders
+ Buy Volume
+ Sell Orders
+Sell Volume
- Floating by Symbols
2. Closed Orders
- Statistics by Today, Week, Month, YTD and Volume
- Sum of Closed Orders by Symbol
3. Statistics by Day
- Statistics by Day and Volume
4. DrawDown by Day
- Each day DrawDown in Week
- Percent of DrawDown
Contact me at Telegram @MaiMew68

A state-of-the-art trading indicator, designed with advanced analytical and mathematical programming, delivers top-tier buy and sell signals. Simply enter a small buy position when a green arrow appears and a small sell position when a red arrow is shown. While signals from this indicator are infrequent, they boast exceptional accuracy when generated. Please apply your own stop-loss and take-profit levels as needed.
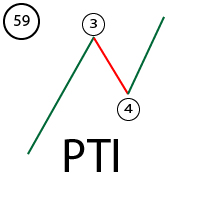
PTI is an index developed by Tom Joseph, which compares the points of Purchase/Third Wave Sales with a Buying Momentum/Sales of The Fourth Wave. This comparison will then be transferred to an algorithm that calculates the VALUE of the PTI INDEX. You can learn more about this index by reading his book Simplified Wave Analysis.
This indicator is an example of my understanding of this index.
This index should be used as follows: 1) You need to click on the "Start Calculation" chart 2) Make the
MetaTraderマーケットは、開発者がトレーディングアプリを販売するシンプルで便利なサイトです。
プロダクトを投稿するのをお手伝いし、マーケットのためにプロダクト記載を準備する方法を説明します。マーケットのすべてのアプリは暗号化によって守られ、購入者のコンピュータでしか動作しません。違法なコピーは不可能です。
取引の機会を逃しています。
- 無料取引アプリ
- 8千を超えるシグナルをコピー
- 金融ニュースで金融マーケットを探索
新規登録
ログイン