Conheça o Mercado MQL5 no YouTube, assista aos vídeos tutoriais
Como comprar um robô de negociação ou indicador?
Execute seu EA na
hospedagem virtual
hospedagem virtual
Teste indicadores/robôs de negociação antes de comprá-los
Quer ganhar dinheiro no Mercado?
Como apresentar um produto para o consumidor final?
Pagamento de Indicadores Técnicos para MetaTrader 4 - 14
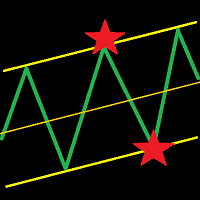
This indicator draws a trend line and a trend tunnel on the chart. You can choose several calculation methods, alerts, notifications, and other settings. It can also draw trendlines from another TimeFrame. You can also use this indicator for your ExpertAdvisor. The current values of the lines are stored in the memory buffer from where the EA can load them. You can trade the price bounce from the upper and lower lines . Settings TimeFrame – trend timeframe Description – show description of line

Grey worm This indicator is a group of indicators combined
Volatility and saturation give us buying and selling and many more things
Use this indicator with your technical analysis or strategy
Do not use it alone and it will give you very good results
It is valid to work on all pairs, metals and instruments
If you have any question, I will be happy to answer it
Please do not forget to rate the good and the positive comment
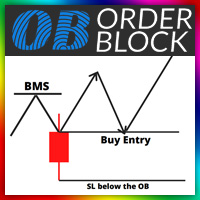
Orde Block Detector: The order block detector can automatically identify the breakthrough of the market structure. After the trend framework breaks through, the order block area can be drawn automatically. In order to draw the OB area more accurately, we also automatically find the candle on the left and right sides of the original candle according to its trading principle, and draw a more accurate ob area through more subtle quantitative rule judgment. Futures : 1. Customize the BMS color, and

Algo Trading Indicaor
With this indicator , you’ll have zones and trends that hight probability the price will reverse from it. so will gives you all the help that you need
Why should you join us !? 1-This indicator is logical since it’s working in previous days movement , to predict the future movements.
2-Algo trading indicator will help you to draw trends which is special and are too strong than the basics trend , trends will change with the frame time that you work on .
3-We can

Average Daily Weekly Monthly Range Alerts.
The most complete multi-period dynamic range indicator with full alert options. Visually displays the Average Range lines on chart + real time distances to the Range Highs and Lows. Notifications are sent when the average ranges are hit. An essential tool for any serious trader! Average period ranges, especially the ADR (Average Daily Range) for day traders, are one of the most useful and consistently reliable indicators available to traders. Always a

OFFER! OFFER ! After 3 weeks the unlimited price will be 500$ and in the future you will regret why you didn't make a purchase at this lowest price. Dear Traders, the atomic power Entries Indicator is one of the indicators that if used wisely and correctly can help you to find an edge over the market. The indicator will work for all forex pairs, all markets and all timeframes. Still it is your duty to find the most effective timeframe for you. When the sell or buy arrow appears you will get a

It is based on Multiple EMA indicators. The idea is that how to display multiple Exponential Moving Averages on the chart easily without placing them one by one. It has also BLUE-RED trend lips to define UPTREND and DOWNTREND whichas BLUE is UPTREND and RED is DOWNTREND.You can change the colors by going to Indicator properties --- colors. There are 2 external setting. They are Period and Shift. When you change them (period and or shift ) then all will automatically adjust. For any currency pair
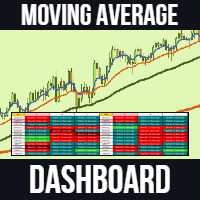
Moving Average Dashboard Pro is an improved and advanced indicator of the free version "Moving Average Crossover Bars ago Dashboard" The moving average dashboard pro gives you a dashboard view of bullish and bearish moving average crossovers. For example, if there was a bullish moving average crossover 5 sessions ago, then you would see 5 bars ago . This indicates that there was a bullish crossover 5 sessions ago. This indicator is useful if you want to catch the trend early on when using moving

Elliott Wave Trend was designed for the scientific wave counting. This tool focuses to get rid of the vagueness of the classic Elliott Wave Counting using the guideline from the template and pattern approach. In doing so, firstly Elliott Wave Trend offers the template for your wave counting. Secondly, it offers Wave Structural Score to assist to identify accurate wave formation. It offers both impulse wave Structural Score and corrective wave Structure Score. Structural Score is the rating to sh

- Real price is 70$ - 50% Discount ( It is 35$ now )
Contact me for instruction, any questions! Introduction The Elliott Wave in technical analysis describes price movements in the financial market that are related to changes in trader sentiment and psychology. The 5 W Pattern (Known as 3 Drives) is an Elliott Wave pattern that is formed by 5 consecutive symmetrical moves up or down. In its bullish form, the market is making 5 drives to a bottom before an uptrend forms. In a bearish 5-dri
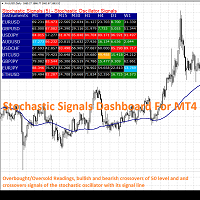
Stochastic Signals is a simple dashboard type indicator that displays the values of the stochastic oscillator on various instruments and time frames chosen by the user. The stochastic is usually used in many trading strategies, especially in countertrend systems when the price reaches overbought/oversold conditions. In addition, this indicator can be configured by the trader to show signals when the stochastic oscillator is in an overbought/oversold condition, when it crosses these levels or whe

OFFER! OFFER! NEXT Price Will be 650$ and the rental option will be removed after this. Don't miss the current price offer before it is too late. Dear Traders I am so glad to introduce my Super Powers Indicator. The purpose of this trading tool is to help serious traders who want to make trading one of their main source of income. I know trading is not an easy task but if you have the right tools, knowledge and motivation to trade then you are ready to go in this industry. My role is to help y

The indicator displays peak levels of activity formed by the maximum volume, tracks the correlation of the candles on all timeframes (from the highest to the lowest one). Each volume level is a kind of key trading activity. The most important cluster is inside a month, week, day, hour, etc.
Indicator operation features A volume level receives Demand status if the nearest volume level located to the left and above has been broken upwards. A volume level receives Supply status if the nearest vol
The indicator determines the ATR value (points) in a classic way (taking into calculation paranormal bars/candles) and more correctly - ignoring paranormal movements of the Instrument. Correctly it is excluding paranormal bars from the calculation, extremely small bars (less than 5% of the standard ATR) and extremely large bars (more than 150% of the standard ATR) are ignored. The Extended version - allows you to set calculation parameters and a lot of other input parameters Ver

BeST_Chande TrendScore Indicator points the start of a trend with high degree of accuracy and it is amazing for scalping on the 1min timeframe. It is also a simple way to rate trend strength. It indicates both the direction and strength of a trend and can be easily combined with various trend-following, swing and scalping strategies. As of a trend’s direction and strength a value of +10 signals a strong uptrend while a value of -10 signals a strong downtrend. Generally a positive score show
Gamma Signal - индикатор предназначенный для поиска локальных экстремумов, определения текущей тенденции. В расчетах индикатора используется авторская методика. С помощью индикатора можно определять места возможного разворота цены желательно в направлении тенденции, но также с достаточной точностью и против нее. Также с помощью индикатора можно определять текущую тенденцию. Индикатор подходит для любых валютных пар, но для адекватного отображения показания необходимо, чтобы было достаточно ист
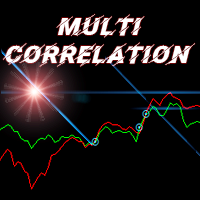
Indicator of correlation of two trading instruments.
Ideal for pair trading.
Example of use: if there is a significant divergence of correlated trading instruments, open two deals in the direction of each of them. Trades are closed when the correlation lines are crossed. Settings: First symbol (if empty - current) - The first trading instrument (if empty, the current one); Second tool (if empty - current) - Second trading instrument (if empty - current); Number of bars - Number of bars for
Introducing the Engulfing Goddess Metatrader 4 (MT4) Indicator , a revolutionary tool designed for traders who seek to harness the power of candlestick patterns in their trading strategy. This indicator is built on the principles of engulfing candlestick patterns , a popular method used by successful traders worldwide. Our Engulfing Goddess Indicator stands out with its ability to detect various kinds of engulfing patterns . It employs a range of filters, providing you with a comprehensiv

Round Numbers And Psychological Levels (Multi Pair And Multi Time Frame) : ---LIMITED TIME OFFER: NEXT 25 CLIENTS ONLY ---46% OFF REGULAR PRICE AND 2 FREE BONUSES ---SEE BELOW FOR FULL DETAILS Studies show that more orders end in '0' than any other number. Also know as 'round numbers', or 'psychological levels',
these levels act as price barriers where large amounts of orders will generally accumulate. And the larger the number,
the larger the psychological significance. Meaning that even
It is a tool for technical analysis. It allows you to make measurements: Fibo, including the search for clusters Fibo levels (by the DiNapoli method) Overbalance Trend line Selecting S/D levels
Input parameters Trend_Color - color of the trend line Trend_Width - width of the trend line Trend_info - if true, along with the trend line additional information is displayed (low, high, medium of the trend line) Trend_info_color_up_dn - color of the text describing the trend line Trend_info_font_up_d
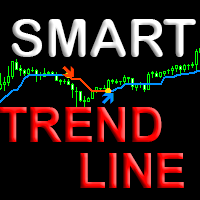
Indicator with an innovative algorithm for determining the direction of the trend. Shows the best results for determining the trend on any currency pairs, stocks, cryptocurrency without redrawing the result. It will help you immediately determine the profitability of the current pair and timeframe. Uses Price action patterns in conjunction with the author's unique algorithm. Suitable for both beginners and professionals for all types of trading. How to choose a profitable timeframe and optimize

Advanced indicator of a professional trader - is a professional indicator based on the popular Stochastic Oscillator. Advanced indicator of a professional trader is an oscillator with dynamic overbought and oversold levels, while in the standard Stochastic Oscillator, these levels are static and do not change. This allows Advanced indicator of a professional trader to adapt to the ever-changing market. When a buy or a sell signal appears, an arrow is drawn on the chart and an alert is trigge
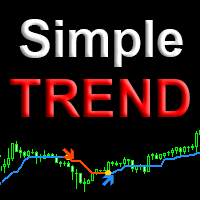
Simple trend is a professional version of the trend indicator and entry points. It uses Price action and a unique filtering algorithm to determine the trend. Shows the change in the direction of price movement on any currency pairs, without redrawing the result. Suitable for determining entry points for scalping and swing, as well as for intraday, medium-term trading. Features Marks trend reversal locations and directions. Suitable for all types of trading, in any markets. Allows you to enter
Este indicador de vários símbolos foi projetado para identificar automaticamente quando o preço atinge os principais níveis psicológicos. Também conhecido como números redondos, números inteiros ou níveis-chave. Como um bônus, ele também pode verificar o nível do ponto de pivô em um período de tempo selecionado. Combinado com suas próprias regras e técnicas, este indicador permitirá que você crie (ou aprimore) seu próprio sistema poderoso. Recursos Pode gravar os sinais em um arquivo que pode se

Este indicador de vários períodos e vários símbolos identifica padrões de fuga de alta probabilidade. Ele faz isso identificando flâmulas e triângulos fortes e simétricos. Este padrão NÃO aparece com muita frequência em prazos superiores. Mas quando isso acontece, é uma configuração de probabilidade muito alta. O indicador também inclui um scanner de barras internas. Pode, por exemplo, ser usado para detectar um tipo especial de formação de barras internas que é formado por uma vela mestre (MC)
Note: This indicator cannot be tested in the strategy tester. Please download the free demo version from https://www.mql5.com/en/market/product/48627 RFX Delta Volume is an indicator to show bullish and bearish volumes separately for each trading candle. The indicator uses history data of one minute (M1) to estimate the true bullish and bearish volumes in a sub-window. There are two modes of operations for this indicator. In mode "Delta Volume", the indicator shows the difference in bullish a

The market is unfair if only because 10% of participants manage 90% of funds. An ordinary trader has slim changes to stand against these "vultures". This problem can be solved. You just need to be among these 10%, learn to predict their intentions and move with them. Volume is the only preemptive factor that faultlessly works on any timeframe and symbol. First, the volume appears and is accumulated, and only then the price moves. The price moves from one volume to another. Areas of volume accumu
Analyzing of multiple charts has always been one of the biggest challenges for professional traders. However, this can be overcome by increasing the number of monitors. But we'll give you a simple, cost-effective solution here.
A simple Solution ISO Charts Organizer (Chart Clipper) allows you to categorize a large number of open charts without having to increase the number of monitors and easily access them all quickly or enjoy auto switching feature.
All features that you need Charts can be

Gold Pro MT4 is a trend indicator designed specifically for gold and can also be used on any symbol. The indicator does not redraw and does not lag.
Free Dashboard : monitor All pairs and timeframes here: https://www.mql5.com/en/market/product/60431 SETTINGS Factor 1: use to calculate different methods of drawing indicator line Factor 2: use to calculate different methods of drawing indicator line AlertByPopup - true/false popup alerts. AlertBySound - true/fals

Magic Moving is a professional indicator for the MetaTrader 4 terminal. Unlike Moving Average , Magic Moving provides better signals and is able to identified prolonged trends. In the indicator, you can set up alerts (alert, email, push), so that you won't miss a single trading signal. MT5 version can be found here You can test the program by downloading the demo version: https://www.mql5.com/en/blogs/post/749430 Advantages of the indicator Perfect for scalping. Generates minimum false signals.

BPS BoS - Break of Structure
BoS - Fractal mode , MTF
BoS - Zigzag mode , MTF
Show HH and LL
Alerts - Popup , Push notification and eMail Option to create screenshot on alert Enable / Disable Indicator with a button on chart to select options
Choose corner of button location
It is not a system but a indicator to help identify break of structure points
MT5 version here : https://www.mql5.com/en/market/product/84734?source=Site+Profile+Seller
Other Indicators : https://www.mql5.

i-Orders is a simple indicator to monitor your own trade/analyze others' trades. I use it for a long time and do not imagine a chart without these arrows, lines and trade result numbers. The features allow you to:
disable display of opened and closed positions ( Show OPENED , Show CLOSED , Show PENDING ), change colors of arrows and lines for profitable and loss-making buy and sell positions separately ( Color for profitable/ losing BUYs/SELLs ), change style and width of the lines connec

All Symbols AND All Time frames Scan
Document Introduction
A breakout refers to when the price of an asset moves above a resistance zone or moves below a support zone. A breakout indicates the potential for a price trend to break.Break provides a potential business opportunity. A break from the top signals to traders that it is better to take a buy position or close a sell position. A breakout from the bottom signals to traders that it is better to take sell positions or close the

About Scanner:
Detailed blog post is here: https://www.mql5.com/en/blogs/post/749119
BB Squeeze Scanner uses bbsqueeze.ex4 in background to calculate when BB Squeeze (Bollinger Bands Squeeze) happens and when BBands expand. It is attached with the above blog post.
What is Bollinger Bands Squeeze:
The Bollinger bands squeeze is a special pattern when the volatility of a market decreases after trending periods. It is generally observed the price is ranging during this period until a

Important!! ZO Trend can't work on MN timeframe. /*--------------------------------------------------------------------------------------------------------------------------------------------------------------------------------------------- ZO Trend an indicator used to search for entry point. With the session candle algorithm on many timeframe, ZO Trend creates an area for traders find good Entry Point. ZO SYSTEM BASIC SETUP : https://www.youtube.com/watch?v=qdNOXHWozNw ZO TREND User guide :

"Make it Horizontal" will convert any trendline to horizontal by just selecting it and then pressing the H key. This tool must be included in your charts as an indicator. It has no inputs, just drag it to your charts and that's it! I created this tool because the MT4 doesn't have any built-in feature like this. How many times have you drawn a line and you need to double click it in order to configure the start and end price level so you can make it horizontal? Well, that's not an issue anymore!

Indicator that alerts by push notification to the mobile phone or by alert on the platform of the touch of the candle with the selected average. The alarm can be set to receive "x" seconds before the candle closes. Specially suitable for those who cannot or want to spend a lot of time in front of the screens to see a movement start from a moving average and therefore miss the movement. You can configure any average method and the time to receive the alert before the candle closes.
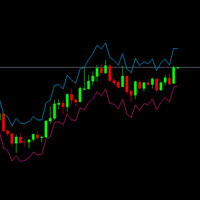
For all temporalities and all charts. Based on the ATR indicator. Calculates and draws on the chart the appropriate points to place Stop Loss or Take Profit according to the current market volatility. The following inputs can be adjusted for a more customized use of the indicator: ATR_Period: number of previous candles to be taken into account for the calculation. ATR_Multiplier: Number by which the ATR will be multiplied to draw the points on the chart. A low multiplier will mean a high risk a

Indicador Forex Metatrader 4 das bandas VWAP
O indicador VWAP Bands Metatrader 4 Forex é bastante semelhante às bandas de Bollinger, mas apresenta a média ponderada do volume como o valor central das bandas.
Há uma opção de usar o volume de tick ou volume real para cálculo ao usar o indicador forex personalizado VWAP Bands Metatrader 5, especialmente quando o corretor forex exibe o símbolo ao lado do volume real.
Da mesma forma, você pode decidir se os desvios são calculados com a correçã

Some candles have a strong tendency to continue the movement or to revert it. With the help of the Colored candles indicator such movements are clearly visible. This indicator calculates the parameters of each candle, as well as its volume, and after that it paints the candles depending on its strength and direction. Bullish candles are colored green and bearish candles - red. The greater the power of the bulls or the bears, the brighter the color. You can change the colors if you want. The indi
Zig Zag Swing Detector is a talking indicator tool, that let you track new highs and lows using Zig Zag patterns and allows you to react to new highs and lows. For example for uptrend each time there is higher hi spotted, the strength of the trend is increased. Trend is ended with lower low than the previous one. Be notified by Alerts, Speech and Notifications and be alerted about new highs/lows! You can also setup conditions to open trades automatically on new heights. Speech synthesis allows y
Price Alert Indicator PRO
Description:
Configurable price alert indicator for when the price crosses upwards or downwards.
Characteristics:
It can be configured one-way, or both ways.
Horizontal lines are used to indicate the level to which you want to be alerted.
On-screen buttons to hide or show the lines.
Alerts:
MT4 alert.
Push alert to mobile phone.
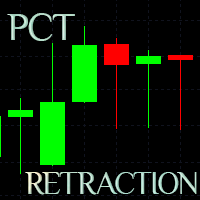
Desenvolvido para auxiliar em operações de retração em opções binárias, este indicador mostrará os melhores pares para operar retração de vela!
Como funciona:
O indicador irá calcular o comprimento total de cada vela (low ao high), o total do corpo e total de sombras (cima e baixo) e calcular a porcentagem total de pavio de vários ativos configuráveis. O contador é atualizado a cada nova vela.
ATENÇÃO: A demo no testador de estratégias não é funcional em vários pares.

Weddell Pro is a good trading tool that is suitable for both a beginner and an experienced trader.
It can be used both separately and combined with other strategies and indicators
Configured for currency pairs was tested several times on cryptocurrency but did not show a high result
Currency pairs USD/EUR AUD/CAD GBP/USD Showed itself very well here
The percentage of correct transactions is above 68%, which does not make it perfect and bad
Doesn't draw or disappear
The red arrow sho

Graphic Shapes -using history, it projects four types of graphical shapes at the moment, allowing you to determine the main ranges of price movement in the future, as well as gives an understanding of the main market reversals, while giving entry points by priority!The panel contains three types of figure sizes expressed by timeframes. They allow you to conduct a complete market analysis without using additional tools! The indicator is a powerful tool for forecasting price movements in the forex

"AV Stop Hunter" is an indicator for MetaTrader 4, which draws entry arrows for long and short after so-called Stop Hunt candles and has several notifications about them. Since this is a smart money concept , the periods H1 and H4 are the best. Increasing volume improves the signal, lines and arrows are then thicker. The MQL5 variant has colored stop-hunting candles.
Definition :
Stop hunting, also known as stop running, is the practice of institutional traders (smart money) of driving t

This is a multicurrency and multitimeframe indicator that calculates the angle between two points. Points for measuring the angle can be taken from the ZigZag (the last two points), or from the Moving Average (between two given bars), or it can be the closing prices of bars.
Angle measurement is possible in degrees or in radians. You can select the scale for the calculation. For a better understanding of the indicator, you can study the free Angle High Low indicator. In the parameters you can

The Quality trend indicator expresses the ratio of the strength of a trend or the speed of its growth (fall) to the degree of its noisiness or a certain norm of amplitudes of chaotic fluctuations of a growing (falling) price. The position of the indicator line above zero shows an increasing trend, below zero - a falling trend, the fluctuation of the indicator line near zero shows a flat. If the indicator line begins to fluctuate rapidly around zero and approach it, then this indica

The indicator signals the appearance of a possible divergent bar based on the shape of the bar without angulation detection. A bullish divergent bar is a bar that closes in its upper half (the higher the better), has a lower minimum than the previous bar, and drops sharply away from the Alligator indicator. A bearish divergent bar is a bar that closes in its lower half (the lower the better), has a higher high than the previous bar, and moves up sharply from the Alligator.
SETTINGS History - h
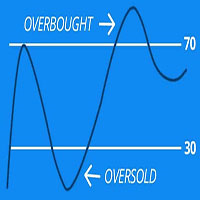
Scan all your favorite pairs with RSI, and get notified on your preferred time frames.
Settings are Customizable
Click to change time frame or open new pairs
Notification: Phone/Popup/Email The relative strength index (RSI) is a technical indicator used in the analysis of financial markets. It is intended to chart the current and historical strength or weakness of a pair/stock based on the closing prices of a recent trading period. The RSI is most typically used on a 14 period, measured o
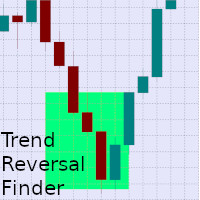
Listed in his faous book "Trading chart patterns like the pros", Suri Duddrella outlines the N-bar rally and decline reversal pattern, which simply states that when stocks make a new high or new low, momentum players will push this stock down or up until eventually they run out of steam. This indicator will look back a certain number of bars to find a continuous uninterrupted rally or decline. Once found, the pattern will look forwards to find the first bar that closes, within a certain range,
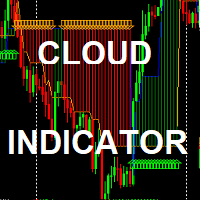
The Simple Cloud Indicator : (FREE limited time for evaluation) Strategy: Strategy is based on moving averages indicator in addition to support /resistance levels crossing *It works on any timeframe *it works on any symbols *it generates alerts *it draws uptrend / Downtrend clouds and BUY/SELL arrows inputs : *drawn start point ( in bars): not affecting strategy - it just gives you indicator history depth *alerting enable/disable

''Trendlines'' is an Indicator, that every Trader need and shows Trendline and Support and resistance levels in all Timeframe's. Also In 1-hour, 4-hour and daily time frames and Current timeframes, support, and resistance levels are specified and trend lines are drawn so that the trader can see all levels on a chart. In Properties it is possible to turn off unnecessary Lines.
In ' Tendency indicator '' , as full package of Predictions that every Trader need, there is also the Predic
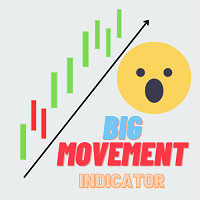
Big movement indicator is a very simple indicator which draws a pattern of boxes where price has moved significantly on a particular timeframe. It also displays the number of candles the strong movement is continuing till now. This indicator work based on zig zag indicator when there is a minimum gap between the last 2 zigzag values we draw a box around this. We can also capture the point where it meet the criteria as buffer values
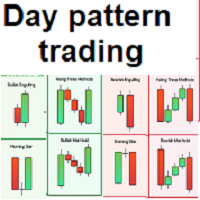
Simple and effective indicator based on some candle patterns recognition Arrows appear on candles when bear signal / bull signal based on candle pattern recognition -----> TWO strategies available you can enable / disable one of them Indicator can work on any chart and time frame I prefer to work on high time frames especially the Daily charts D1 and H4 Red arrows appears above candle showing a bear signal after candle completed - arrow will be blue during candle formation Green arrows appears b
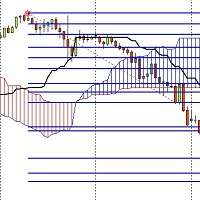
I have developed an indicator based on both the fibo musang strategy and the price breaking of the ichimoku cloud and it has amazing results
the features are:
1- Once activated it give you the trend where you are from the chart
2- After a trend change it gives you an alert on PC or notification on your phone if you are away.
3- It sends you the exact prices to take an order and 3 take profit levels and your stoploss.
4- It works on every timeframes from 1m to MN.
5- It works on pairs
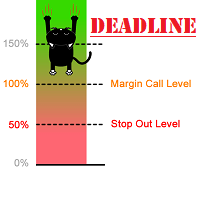
The indicator can display Stop Out, Free Margin and Margin Call lines on the chart. Y ou can also set your own line at the custom level.
Displaying these lines on the chart is especially useful for people who trade with high leverage or go all-in, where the risk is very high. You can adjust the line color, style, thickness and visibility ( for each one separately). The last parameter that can be changed is the refresh interval. If you have open orders on several stocks, the line levels will c

The SuperTrend indicator is a popular technical analysis tool used by traders and investors to identify trends in the price of a financial instrument, such as a stock, currency pair, or commodity. It is primarily used in chart analysis to help traders make decisions about entering or exiting positions in the market. this version of super trend indicator is exactly converted from trading view to be used in MT4
The Royal Mint New indicator for MetaTrader is a trend-following system that analyzes the trend bias of any currency pair. It is a superior version of the regular Heiken Ashi indicator, designed with more advanced technical tools like the trend reversals, a T3 line, and the moving average. The T3 line of the indicator works as an extra layer of confluence to confirm when the moving average crosses over. Moreover, the Heiken Ashi bars of the indicator would change to blue to depict a potential bu
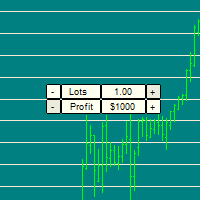
Easily manage your risk and position sizing! It can be tricky to size your trade in the moment, due to different currency / commodity values. For example, placing a 1 Lot position on XAUUSD can easily blow an account that could handle 1 lot on GBPUSD. See screenshots to see how Gold can move $500 on 1 lot much faster than GBPUSD.
THe indicator draws horizontal lines that allow you to easily compare the potential risk/reward across timeframes and symbols. ---- Inputs are: Risk Size: The Loss/Pr
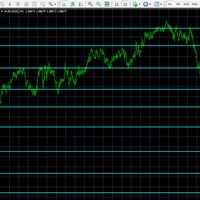
A powerful chart indicator which intelligently analyses Index, FX & Commodity prices to identify the strongest support and resistance price boundaries. Each line shows where prices consistently close, while the frequency of these matching prices is quoted to reflect each boundary strength. Use these predictive boundaries to identify pivot points, resistance and support levels for crossover, trending, reversal and channel strategies. For FX pairs, set volatility filter = 1 For Indices & Commodi

缠中说禅在MT4的应用,该指标自动识别分型,划笔,划线段,显示笔中枢,线段中枢,也可以根据需求在参数中设置显示自己所需要的。 1.笔采用条件较为宽松的新笔。 2.当前分型与前面分型不能构成笔时,若与前面笔同向且创新高或新底时会延伸笔,若与前面笔异向且符合替换条件则去除倒数第一笔,直接倒数第二笔。 3.线段的终结第一类情况:缺口封闭,再次创新高或新底新低,则判为终结,同时破坏那一笔的右侧考虑特征序列包含。 4.线段终结的第二类情况,缺口未封闭,考虑后一段特征序列分型出现新的顶底分型,同时做了包含处理。 5.中枢显示笔中枢和段中枢可在参数选择 6.第一类买卖点两种方式可选,参数1为MACD动能柱面积,参数2为斜率

The Prop Trading Scalper indicator is a tool used for manual traders to assist in passing prop trading challenges, which are evaluations set by proprietary trading firms to determine a trader's skill and discipline. This indicator is particularly designed for scalping, a strategy that involves making numerous small trades to capitalize on minor price movements.

Indicatorul excepțional ISKANDER
Bun venit!
Studiați și experimentați excepționalul indicator IKANDER! Merita.
Funcționează pe toate intervalele de timp și pe toate perechile. Observați rezultatele foarte bune prezentate în aceste imagini și în videoclip.
Succes!
Notă Este posibil ca acești indicatori și experți pe care i-am scos la vânzare să nu funcționeze pe anumite platforme. De câțiva ani, unele platforme cu noi versiuni MT4 nu afișează toți indicatorii personalizați.
O soluție

Indicator fantastic
Bună ziua!
Indicatorul fantastic funcționează cel mai bine pe M5, M15, M1. Rezultatele sunt fantastice.
Pe perioade mai lungi de timp, semnalele sunt corecte, dar sunt rare.
Marcatorul nu revopsește.
Recomand un TPmin. = 5, 10 sâmburi pentru M5.
Acest indicator are potențialul de a declanșa tranzacții mult mai lungi.
Experimentează-l!
Noroc!
Note Dacă indicatorul nu este afișat, citiți comentariul meu în secțiunea de comentarii pentru a afla cum să faceți a
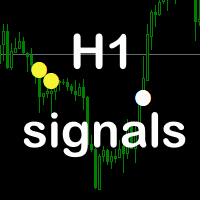
Semnal H1
Studiați indicatorul de semnal H1. Rezultate foarte bune. Este creat pentru gama H1.
Succes!
Note Dacă indicatorul nu este afișat, citiți comentariul meu în secțiunea de comentarii pentru a afla cum să faceți acest lucru.
IMPORTANT! Verificați mai întâi indicatorul sau expertul pe un cont DEMO, înainte de a-l cumpăra! Analizați-l bine!
Închiriați-l pentru o perioadă mai scurtă de timp. Pentru a vedea cum funcționează și dacă funcționează pe computer.

The indicator plots higher timeframe Kijun-sen (of Ichimoku ) on lower timeframes.
To change timeframes, in the timeframe field enter the number:
M1 PERIOD_M1 1 1 minute. M5 PERIOD_M5 5 5 minutes. M15 PERIOD_M15 15 15 minutes. M30 PERIOD_M30 30 30 minutes. H1 PERIOD_H1 60 1 hour. H4 PERIOD_H4 240 4 hour. D1 PERIOD_D1 1440 Daily. W1 PERIOD_W1 10080 Weekly. MN1 PERIOD_MN1 43200 Monthly.
By default, the Kijun is shifted 3 periods forward but if you wish to have it exactly

Индикатор I Special ZigZag отмечает на графике максимумы и минимумы 3-х порядков, а именно краткосрочные , среднесрочные и долгосрочные и соединяет их линией подобно ZigZag без перерисовки. Идея построения индикатора взята из книги Ларри Вильямса "Долгосрочные секреты краткосрочной торговли" и адаптирована под современный рынок. В настройках индикатора можно задать нужную толщину и цвет для каждого вида экстремума для удобства восприятия на графике цены. С помощью данного индикатора легче понять

Previous Period High Low . This indicator shows the previous Day, Week, Month and Years High and Low. It's great for price action strategies. : Provides clear and visible breaks in structure. : Easy to see breakout levels. : Easy to see gaps between previous high, low levels after breakouts have occurred. The indicator works on every time frame. Multiple periods can be selected and be seen on the same chart. Every line can be customized to Your liking. Color, style and thickness. Enjoy!
One of the basic needs of every trader is to have a checklist to enter every position. Of course, using pen and paper may not be convenient forever. With this indicator, you can have a small checklist next to the screen for each of your charts and use it for better use in your trades. MT5 Version This indicator will have many updates and special settings will be added to it.
You can contact us via Instagram, Telegram, WhatsApp, email or here. We are ready to answer you.
O mercado MetaTrader é um espaço, sem precedentes, para negociar robôs e indicadores técnicos.
Leia o artigo Manual do usuário da MQL5.community para saber mais sobre os serviços exclusivos que oferecemos aos traders: cópia de sinais de negociação, aplicativos personalizados desenvolvidos por freelances, pagamentos automáticos através de sistema de pagamento e a rede em nuvem MQL5.
Você está perdendo oportunidades de negociação:
- Aplicativos de negociação gratuitos
- 8 000+ sinais para cópia
- Notícias econômicas para análise dos mercados financeiros
Registro
Login
Se você não tem uma conta, por favor registre-se
Para login e uso do site MQL5.com, você deve ativar o uso de cookies.
Ative esta opção no seu navegador, caso contrário você não poderá fazer login.