Conheça o Mercado MQL5 no YouTube, assista aos vídeos tutoriais
Como comprar um robô de negociação ou indicador?
Execute seu EA na
hospedagem virtual
hospedagem virtual
Teste indicadores/robôs de negociação antes de comprá-los
Quer ganhar dinheiro no Mercado?
Como apresentar um produto para o consumidor final?
Indicadores Técnicos para MetaTrader 4 - 34

It's a simple indicator based on Moving Average. It's still a beta version. Good for a Day trader to identify market movement. No Repaint but It doesn't mean that all signals should be a win. There are no trading rules which you can gain 100%. You have to accept the losses.
Recommendations: 5 or 15 Min Any Pair Try to switch the timeframe 5 or 15 to find out best TF for your pair. Tips - Don't forget to set SL and TP. Thank you.
FREE
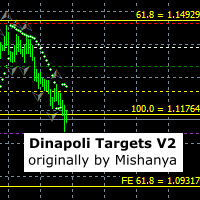
This indicator sets stop, start and target 1, 2 and 3 levels based on detected market swings on multiple timeframes. It was originally written by Mishanya and has been updated by Ramoletane to move with the price and automatically update the levels. A trade can be placed when price has crossed the white start line and stop loss placed on the red stop line. The lot size can be reduced at the green target 1 level, the yellow target 2 level and the position finally closed at target 3. Most of the t
FREE

Introducing Round Range 5, a versatile and dynamic indicator designed to optimize your trading strategies on MT4. Let's explore how this indicator can revolutionize your trading experience by adapting round number levels to suit the unique characteristics of each instrument.
In the fast-paced world of financial markets, round numbers play a crucial role. These price levels, ending with multiple zeros or other significant digits, often act as psychological barriers that influence market sentim
FREE
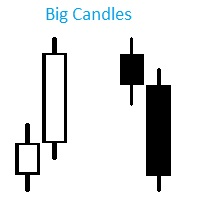
Индикатор Big Candles показывает кратное превышение размера свечи относительно среднего показателя рассчитанного за определенный период. Индикатор отмечает размер свечи на графике в пипсах и сигнализирует о появлении “большой” свечи. Описание параметров: HistoryBars - Количество баров для отображения индикатора countN - Период расчета среднего размера свечи f actor - Во сколько раз длина свечи превышает средннее значение, для отображения сигнала
FREE

RaysFX Trade Info Ciao a tutti, sono entusiasta di presentarvi il nostro ultimo indicatore, RaysFX Trade Info . Questo strumento è stato progettato per fornire informazioni dettagliate sulle vostre operazioni di trading direttamente sul vostro grafico MT4. Caratteristiche principali Informazioni in tempo reale : RaysFX Trade Info fornisce informazioni in tempo reale sulle vostre operazioni aperte e chiuse. Potete vedere il profitto in punti, in valuta e in percentuale. Personalizzabile : L’in
FREE

Indicator SR levels true in small time frames is very useful for scalping while in bigger ones it is good for day or position trading.
SR levels true can draw 4 support/resistance levels based on defined maximum rebouds from price level. Indicator scans defined number of bars in time axis and defined number of pips in price axis (both sides - up and down) and calculates how much times price was rejected from scanned price levels. At the price levels where maximum rebounds are counted, support
FREE

This indicator draws regular bullish and bearish divergences in real-time onto the charts. The algorithm to detect those divergences is based on my 10+ years experience of detecting divergences visually. The divergences are drawn as green and red rectangles on the charts. You can even do forward testing in the visual mode of the strategy tester. This FREE Version is restricted to EURUSD and GBPUSD. The full version without restrictions is here: https://www.mql5.com/en/market/product/42732
Para
FREE
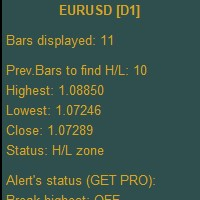
Higher Timeframe Chart Overlay will display higher timeframe candles, including the number of candles high/low you specify.
You no longer need to switch timeframes to check the candles. Everything can be shown in one chart. Get Full Version - https://www.mql5.com/en/market/product/115680 Please feel free Contact me if you have any questions regarding this tool.
FREE

ADR 20 mostra l'intervallo medio di pips di una coppia Forex, misurato su un numero di 20 giorni . I traders possono utilizzarlo per visualizzare la potenziale azione dei prezzi al di fuori del movimento medio giornaliero.
Quando l'ADR è al di sopra della media, significa che la volatilità giornaliera è superiore al normale, il che implica che la coppia di valute potrebbe estendersi oltre la sua norma.
L'ADR è utile anche per il trading di inversioni intraday. Ad esempio, se una coppia di v
FREE

This indicator allows you to overlay three different moving averages on the chart simultaneously. Each of these moving averages has additional settings such as: -Time frame
-Shift
-MA method
-Applied price
Using this indicator, you can easily set up three moving averages and find the one that suits you the best. You can also use this indicator to determine the trend when the moving averages cross.
FREE

GTAS FidTdi is a trend indicator using combination of volatility and potential retracement levels. This indicator was created by Bernard Prats Desclaux, proprietary trader and ex-hedge fund manager, founder of E-Winvest.
Description The indicator is represented as a red or green envelope above or under prices.
How to use Trend detecting When the envelope is green, the trend is bullish. When it is red, the trend is bearish.
Trading Once a trade is opened, GTAS FibTdi shows retracement zones
FREE

RaysFX EMA Crossover Scopri i potenziali punti di inversione del mercato con l’indicatore di Crossover EMA di RaysFX. Questo indicatore utilizza una combinazione di due medie mobili esponenziali (EMA) - una più veloce e una più lenta - per identificare i possibili punti di ingresso e uscita. Caratteristiche principali : Due EMA : Utilizza una EMA più veloce e una più lenta per catturare i movimenti di mercato a breve e lungo termine. Segnali di crossover : Genera un segnale quando l’EMA più v
FREE

High and Low Levels EMA Технический индикатор в помощь трейдеру. Однажды пришла идея при изучении индикатора Moving A verage ( MA ).
Так как мувинги эти сглаженное, среднее значения цены за выбранный период, то как и у обычной цены и у мувинга
должны быть «хаи и лои».
Данный индикатор, показывает уровни High и Low . Динамических уровней поддержки и сопротивления.
О понятии High и Low .
Хай — от английского high — обозначает наиболее высокую цену («рынок на хаях » — капитализ
FREE
This indicator displays on the price chart signals about the standard MACD crossing the zero value, as well as about crossing the signal line. The indicator does not redraw. Signals are shown on fully formed candles. The indicator can send notifications of its signals to the terminal and email. Custom Parameters: Fast_EMA_Period - fast moving average period; Slow_EMA_Period - slow moving average period; Signal_Period - signal line period; MACD_Price - the price at which the indicator is built
FREE

This indicator is designed based on the Moving Origin indicator
When the moving origin indicator breaks the price, this indicator gives a signal
It is useful for better viewing of signals and analysis on them
Attributes: Can be used in all symbols Can be used in all time frames Too many signals Simple and quick settings Easy way to work
Settings: period: like moving average settings alarmShow: If you want to receive an alert in Metatrader after receiving the signal, enable this setting
a
FREE
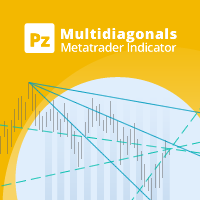
This indicator connects past price points drawing diagonals and trend lines, which converge in the future creating hidden reversal points. [ Installation Guide | Update Guide | Troubleshooting | FAQ | All Products ] Find hidden reversal points Spot convergence zones easily Dense criss-cross zones are reversal points Configurable amount of lines and price points Configurable colors
How to use the indicator The indicator draws several lines on the chart, and where many of these lines converge a
FREE
Indicator Rua Alert Trend Line. This indicator will notify when the price breaks any trendline on the chart. Notifications will be sent to the phone and on MT4. Custom parameters: in_NumbersAlert: The number of notifications that will be sent when the price breaks the trendline. A product of Ruacoder Provide code indicator and EA services upon request. Contact: Telegram : https://t.me/Ruacoder
FREE

Description I think, almost all traders dream about non-lagging MA. I have realized that dream in my indicator. It allows forecasting future MA values! The indicator can be used in four different ways: The first one - forecast for the desired amount of bars. Thus, you are able to evaluate future price behavior. The second one - generating non-lagging "averages". That can be implemented by moving MA back by the half of the averaging period and setting the forecast the necessary amount of bars ahe
FREE

This semaphore indicator is based in the standard RSI, which is applied over the Envelopes indicator that shows an envelope or envelope fluctuation borders. This is a version of RSI vs Envelopes Graph drawn in a separate window . A sell signal emerges when the upper envelope/border is broken by the RSI indicator from top to bottom. A buy signal emerges when the lower envelope/border is broken by the RSI indicator from bottom upwards. The indicator can draw arrows on the indicator, draw vertical
FREE

Индикатор отображает бары в системе High-Low-Close ( HLC ). Имеется возможность выделять бары с увеличенным объемом. Простые понятные настройки цвета, толщины баров. Входные параметры Width Line – толщина баров. Color Down Bar – цвет медвежьего бара. Color Up Bar – цвет бычьего бара. Color Undirected Bar – цвет ненаправленного бара. Volume Level (0-off) – уровень объема для показа бара с увеличенным объемом (0-отключено). Color Volume Bar – цвет бара с увеличенным объемом.
FREE

Indicator overview Trend indicator usage Moving averages. Highest quality alerts that need no introduction. It is completely loyal to the original algorithm and uses other useful features.
Easy to trade Carry out all kinds of notifications It's not a new paint and it's not a back paint. Setting Indicator WMA50 in Time frame H1 for any pair currency and Gold Spot. EMA200 in Time frame H1 for any pair currency and more than EMA250 for Gold spot. Using it for maximum benefit Set up notificatio
FREE
The Symbol and Timeframe Display Indicator for MetaTrader 4 (MQ4) is a versatile tool designed to enhance your trading experience by providing essential information about the current chart's symbol and timeframe directly on the screen. This user-friendly indicator offers customizable features that allow you to position the text display according to your preferences and enables convenient text toggling through keyboard interactions. Key Features: Symbol and Timeframe Display: The indicator promin
FREE

Alert TIME LINE indicator warns that the price has reached a specified time level.
Drag the indicator onto the chart, press the SET TIME LINE button, move the line that appears to the desired time, when the chart reaches the specified time, an alert will be triggered.
This indicator is used as an auxiliary tool when trading time zones, using the free TIME LINE Forex System , see the results and screenshots below.
You can get the system for free in the technical support chat https://t.me/C
FREE
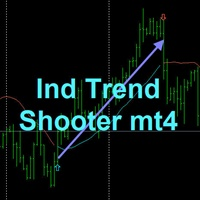
TREND SHOOTER Without alerts
It is a trend indicator based on moving averages that very efficiently calculates changes in market direction.
This has the ability to anticipate changes of direction very early.
FEATURES
This indicator particularly draws two moving averages that are used only to show color changes. they can wear these moving stockings as they wish as they do not affect the color change behavior bullish blue color
bearish red color where the line is interrupted it is not
FREE

Here is the most unpretentious indicator to use, but one of the most useful. It signals the near reversal of the growing volatility. It is volatility that gives income to the trader. The indicator is especially useful for those who do not want to wait for the right moment in front of the monitor. The indicator is installed on the charts M15 and M30. According to the observations on these timeframes, it best fixes the approach of wide price waves. Well-established on the USDZAR currency pair (Att
FREE

Current Pips and Money Profit This indicator displays the results of the currently open position on the graph. Result in pips and in the invoice currency. Thanks to this, you can enlarge the chart to the entire screen and have control over the result of trading without opening a terminal window which takes a space of a screen. The display positions of this data can be adjusted at the user's discretion and colors also.
FREE

Commodity Channel Index and Moving Average [CCI MA] A combination of CCI and MA to create a crossover trading setup Input parameters: signal mode: set it to true if you want to plug it into STAT (Signal Tester and Trader) arrow shift: distance between fast EMA line to arrow on chart price line filter CCI period CCI price method Moving average period Averaging method upper level lower level You can find the best setting for 4 hour EURUSD on this video
FREE
Concept:
This indicator will help you find Spike Bar. 1/ Check Yesterday Range (Open-Close ) 2/ Check Today pips: Price from Daily Open to current price (Bid/Ask) Then alert for you when the pips range of current candle is equal to or greater than the user defined minimum range. This indicator is related to Strategy: Daily Range Spike and Pull Back, you can find it on FFX forum
FREE

'Circle Rising Point' is an indicator based on the cycle theory. No matter whether your trading cycle is short or long, you can use this indicator to find the rise and fall points of different cycles and different bands. Therefore, the signals displayed to you on charts of different cycles are different, and applicable to left side transactions. This indicator is recommended to be used together with the multi cycle window for analysis. Indicator introduction Applicable products This indicato
FREE

Olá!
Sou Tatsuron, um investidor de varejo japonês. Gerenciamos mais de 1 bilhão de ienes em Forex.
Então, deixe-me apresentar um indicador muito útil que uso.
O indicador que é a base do preço de mercado.
A ThreeLine melhorou a média móvel (SMA) para responder às configurações numéricas de SMA de longo prazo.
Quanto mais você repetir as negociações e verificações diárias, mais confiável será a Três Linhas.
Se o ângulo de ThreeLine for para cima, ele será branco. Se estiver volt
FREE

Após 7 anos, decidi liberar alguns dos meus próprios indicadores e EAs gratuitamente.
Se você os achar úteis, por favor Mostre seu apoio com uma avaliação de 5 estrelas! Seu feedback mantém as ferramentas gratuitas chegando! Veja também as minhas outras ferramentas gratuitas aqui
_________________________________ Índice de Intensidade Intradia (III) para Precisão em Operações Forex O Índice de Intensidade Intradia, desenvolvido meticulosamente em MQL4, é uma ferramenta de ponta
FREE

Porque o estilo é importante
Sei como é irritante clicar nas propriedades cada vez que se muda a cor da vela, o fundo para claro ou escuro, e colocar ou remover a grelha. Aqui está a solução com um clique: Três botões personalizáveis para escolher o estilo de vela que os comerciantes desejam. Um botão para alternar entre o modo Diurno e Nocturno. Um botão para mostrar ou esconder a grelha nos gráficos. ***** Nas definições, pode escolher onde os botões devem ser mostrados no ecrã***** Por fa
FREE

Pontos Importantes do Dia Indicador que mostra os pontos considerados importantes de X dias. (Abertura, Fechamento, Máxima, Mínima). Usado bastante por quem faz Day Trade, esses pontos podem ser usados para a tomada de decisão de um trader.
Configuração Máxima/Mínima/Fechamento/Abertura Show - Mostrar Days - Quantidade de dias que irá mostrar no gráfico Color - Cor da Linha Style - Estilo da linha
FREE

万能线段划分指标简介: 万能线段划分是依照两根相互缠绕的均线,依金死叉为标准,将金死叉两边的高低点进行连接开成线段划分。本指标可以设定不同参数多级别叠加使用。 万能分段的原理: 在任意一组均线组成的均线系统中,均线之间的相互缠绕,形成的金死叉是有位次关系的。这点,作者在这里算是首次对外公开这个秘密。上图的均线系统中,走势处于一个较大级别的振荡行情中,均线之间相互缠绕比较频繁,金死叉的数量较多,所以,情况比较复杂。 我们知道,均线可按其周期大小进行位次排序。上图均线依照周期从小到大排序为:MA10,MA30,MA60,MA144,MA233,依照这组均线的位次关系,将每相邻两根均线金死叉做上标注。如:MA10&MA30金死叉标注为“1”,MA30&MA60金死叉标注为“2”,MA60&MA144金死叉标注为“3”,MA144&MA233金死叉标注为“4”。我们将两相邻均线金死叉完全标注完毕后,发现图上还有部份金死叉并未被标注到,这些未被标注到的金死叉全部是非相邻均线之间发生的金死叉。我们依照以上方法,可以识别出均线组之间金死叉的级别位次关系。市场行情的发展是依照此级别位次关系,从小到大
FREE
Check out other great products from https://www.mql5.com/en/users/augustinekamatu/seller
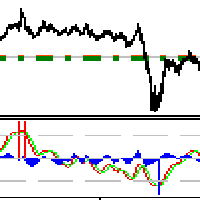
This indicator is the best so far at estimating reversal points especially on high time frames. It does not repaint and is based on a combination of moving averages computed using custom functions. No inputs required, it is simple plug and play. The principles used ensure that it can be used on CFDs, Commodities and Stock with incredibly great results. With proper money management and portfolio balancin
FREE

Th3Eng HistoMaster indicator Free Histogram Indicator to detect the current trend direction. The indicator is based on CCI indicator. Also draw arrows when it detect the trend is strong buy or strong sell, with Alerting system (Popup with sound, Email alerting and mobile notification). Also draws a dashboard shows all Time-Frames' current signal.
Requirements
works with all pairs, stocks, CFDs and crypto currencies. works with all Spreads works with all Account types works on all Time-Frames
FREE

Simple indicator that shows external ( outside ) bars. In certain cases, external bars can be seen as strong trend bars instead of range bars. This can be observed when a with-trend external bar occurs at a reversal from a strong trend. It will help you notice more easily different patterns like - Inside-outside-inside, Inside- Inside -inside, outside - Inside -outside, etc. Works perfectly with my other free indicators Internal bar and Shadows
Inputs: How many history bars to calculate on l
FREE

This indicator is an addition to "Trend Edges."
The "Trend Edges histogram" indicator determines whether the trend is rising or falling. It is suitable for any time frame (tested on DAX).
Find a trending pair, index or CFD. Additionally :
-Sound alert on trend change.
-Alert Notification
-Alert Notification on your mobile phone Check my other indicators.
FREE

iRSI in iMA is indicator to change color in iMA if iRSI crosses level up (up trend) or crosses level down (down trend). It is a useful tool to track when the upside and the downside iRSI on iMA.
You can to get source code from here.
Parameters MA_Periods — Period for iMA. MA_Method — Method for iMA. RSI_Periods — Period for iRSI. RSI_ApliedPrice — Price used for iRSI. RSI_LevelsUp — Level iRSI for up trend. RSI_LevelsDN — Level iRSI for down trend. BarsCount — How many bars will show the li
FREE
Description:
This Free Indicator will allow you to monitor the Max/Min spread in a bar/candle. By running it 24h/24h will allow you to recognize which period of time having maximum spread, based on that you will understand the market more, and could develop/improve to have better trading strategy.
Parameters: limit: <specify the limit of spread, above which the indicator will mark the price, at which high spread occurs>
Note: Beside the price marked due to high spread above, the indicator
FREE
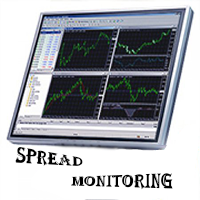
Spread Monitoring is a unique product for analyzing a spread. Unlike most similar indicators, Spread Monitoring uses ticks rather than bars allowing you to detect abnormal spread expansions. Features
Works on ticks rather than bars. Simple and easy indicator configuration. Works on all timeframes. Works on any financial instrument. No repainting.
Parameters
Total - number of displayed ticks. clrSpread - indicator line color.
FREE
Highly configurable Momentum indicator.
Features: Highly customizable alert functions (at levels, crosses, direction changes via email, push, sound, popup) Multi timeframe ability Color customization (at levels, crosses, direction changes) Linear interpolation and histogram mode options Works on strategy tester in multi timeframe mode (at weekend without ticks also) Adjustable Levels Parameters:
Momentum Timeframe: You can set the lower/higher timeframes for Momentum. Momentum Bar Shift
FREE

O indicador "Two Moving Average Crossover" para MetaTrader 4 (MT4 é uma ferramenta de análise técnica que apresenta duas médias móveis e notifica quando as médias móveis se cruzam. O indicador calcula e traça duas médias móveis, uma das quais é mais rápida e a outra é mais lenta. Quando a média móvel mais rápida se cruza acima da média móvel mais lenta, é considerada um sinal de alta, indicando uma potencial inversão de tendência ou o início de uma nova tendência de alta. Pelo contrário, quando
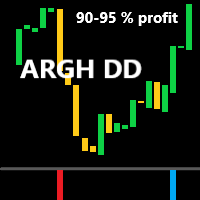
Indicador de compra e venda ARGH DD
Este indicador é um indicador de histograma.
É um indicador poderoso e preciso com poucos falsos positivos.
As negociações que eles acionam duram dias ou semanas.
Mas são transações muito estáveis.
Claro, as regras de entrada são muito simples:
️ a barra azul do histograma indica a abertura de uma posição de compra;
️ a barra vermelha do histograma indica a abertura de uma posição de venda.
Não devemos nos surpreender que, após a abertura de
Este indicador cria um canal em relação a outro indicador de gráfico: indicador + ATR e indicador - ATR . Útil para saber se o preço subiu muito da sua linha de base. Os níveis de ATR podem ser ajustados com um multiplicador. Esta versão tem mais complexidade do que sua contraparte MT5 para evitar algumas das limitações do MT4: você precisa introduzir o nome da sua linha de base , parâmetros (em uma string separada por vírgulas) e buffer . Certifique-se de que sua linha de base t
FREE

Advanced Trend Breaker Free Dashboard!!! Advanced Trend Breaker DashBoard: https://www.mql5.com/en/market/product/66336 Breaker's smart algorithm detects the trend,Support and resistance, filters out market noise and find entry signals!!! Test the demo version and explore its features, it would be useful tool added to your trading arsenal. Do not foget down load Free DashBoard!!! Advanced Trend Breaker DashBoard !!!
Advantages You Get Easy, visual and effective trend detection. Support a
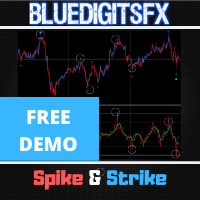
NOTE : This Free version only works for the EURUSD & AUDUSD Symbol !
MT4 Version Available Here: https://www.mql5.com/en/market/product/43438
MT5 Version Available Here: https://www.mql5.com/en/market/product/50255
Telegram Channel & Group : https://t.me/bluedigitsfx
V.I.P Group Access: Send Payment Proof to our Inbox
Recommended Broker: https://eb4.app/BDFXOsprey
* Breakthrough Solution For Reversal Trading And Filtering With All Important Features Built Inside One Tool!
FREE
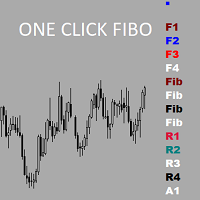
Утилита предназначена для упрощения графического анализа.Настроив один раз , можно сохранить в шаблон,все настройки сохранятся.В настройках меняются уровни фибоначчи , цвета,стили и толщина линий также текстовые метки на кнопках.Есть возможность расширить функционал , добавить временные зоны Фибоначчи ,Фибо арки ,линии по углу ,продление прямоугольных зон до текущей цены.Присылайте рекомендации,все можно осуществить в рамках бесплатной утилиты.
FREE
This indicator displays signals about the standard MACD crossing the zero value, as well as about crossing the signal line. The indicator does not redraw. Signals are shown on fully formed candles. The indicator can send notifications of its signals to the terminal and email. Custom Parameters: Fast_EMA_Period - fast moving average period; Slow_EMA_Period - slow moving average period; Signal_Period - signal line period; MACD_Price - the price at which the indicator is built;
Alerts - show a
FREE

Relative Strength Index Cross [RSI Cross] A combination of 2 RSI to create a crossover trading setup Input parameters: signal mode: set it to true if you want to plug it into STAT (Signal Tester and Trader) arrow shift: distance between fast EMA line to arrow on chart price line filter fast RSI period slow RSI period RSI price method price upper level price lower level You can find the best setting for 4 hour EURUSD on this video
FREE

Divergence Reader - индикатор который поможет Вам идентифицировать на графике дивергенцию и конвергенцию.
Настройки Type - выбор типа сигнала (дивергенция, конвергенция, оба сигнала); Minimum length of divergence (Candle) - минимальная длинна сигнала (в свечах); MACD SETTINGS - настройки индикатора МАСD; Важно! Индикатор не рисует графику на истории! Для визуальной проверки индикатора рекоммендую использовать тестер.
FREE

The Indicator automatically draws trend lines ( Support & Resistance Lines) when attached to any opened chart with any time frame. Button controls with on(green)/off(red) are provided to display the Support & Resistance lines of short, medium, long, very long, v.v.long trends. For ex: to display only short, long term trend lines, make sure that the short and long buttons are in green color and the remaining 3 buttons in red color. This free version works only with EURJPY pair. Please buy paid ve
FREE

***IMPORTANT: This free indicator works with the paid for Strong Weak Forex Expert Advisor. The EA also depends on the following custom indicators: Strong Weak Heiken Ashi Strong Weak Parabolic Strong Weak Values Strong Weak Symbols Download them for free in the Market. The EA will not work without it. These are all custom indicators which the Strong Weak Forex Expert Advisor relies on to generate trading signals. If you have any problems with installation send me a message.
FREE
The indicator is a complex of MACD and OsMA, built according to the complex of several popular oscillators. This combination allows you to get the best out of both types of indicators. On the one hand, a quick response to changes in the market environment, on the other hand, effective market following and noise filtering. The indicator values on a fully formed candle are not redrawn.
FREE

The Commitments of Traders Ratio Indicator is one of these things you never thought about it before you really see the magic behind it. The indicator shows the Ratio of long/short positions released by the CFTC once a week.
If you have a look on the Sreenshot you can see two (three) zones of interest. Zone 1: The Switches (Red -> Green, Green -> Red) Zone 2: MA cross Zone 3: If you combine this with the COX indicator an additional zone will appear. You also can experiment with Ratio crossing M
FREE

Risklimiter
Limit your risk with this dynamic stop loss indicator. It will show you exactly where to place your initial stop & subsequent stops as the price goes in your favour. Works on any time frame as well as any symbol. It is not restricted in any way nor does it need optimisation. Simply drag and drop on to a chart for it to display a stop loss. You may find at times, it shows a stop on the other side of your trade, this will change as soon as price closes above/below it.
DOES NOT RE
FREE
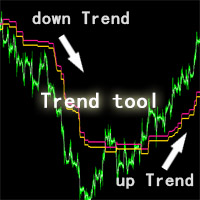
Esta ferramenta ZhiBiQuShi é adequada para todas as variedades e é adequada por mais de 5 minutos. É uma boa ferramenta para julgar tendências!
O preço é uma tendência de queda abaixo das duas linhas, e o preço é uma tendência ascendente acima das duas linhas.
DESCRIÇÃO DAS CONFIGURAÇÕES
till_breakeven_rate: Determina com que proximidade o canal seguirá o preço até que a negociação se estabilize. RECOMENDAR 1 space1: Determina a largura do canal desde o início de uma negociação até
FREE

RaysFX Stochastic L'indicatore RaysFX Stochastic è un indicatore personalizzato per la piattaforma MetaTrader 4.
Caratteristiche principali:
-Indicatori separati: L'indicatore viene visualizzato in una finestra separata sotto il grafico principale. -Livelli dell'indicatore: L'indicatore ha due livelli predefiniti, 20 e 80, che possono essere utilizzati come livelli di ipervenduto e ipercomprato. -Buffer dell'indicatore: L'indicatore utilizza quattro buffer per calcolare e memorizzare i suo
FREE
The presented indicator is a trend indicator that displays with a colored line the current direction of price movement and the support/resistance zone in the form of a cloud. The indicator also marks points of change in price direction with arrows that appear after the bar is fully formed. The arrows are not redrawn. The rules for using the indicator are simple: We open a position when the price overcomes the high/low of the bar marked with an arrow in the direction opposite to the cloud. Arrow
FREE

This indicator draws on the chart high and low prices of different periods . And If you want, Indicator can alert you when the current price arrive these levels. Alert Options: Send Mobil Message, Send E-mail, Show Message, Sound Alert Time Periods: M1, M5, M15, M30, H1, H4, D1, W1, MN Inputs: TimeShift: You can set start hour for calculating. And that way you can see levels independently from broker server's time-zone. PipDeviation: You can set price sensibility for alert (Default: 3) Lines
FREE

Индикатор отображает скользящие средние на заданном количестве баров ( Count bar for show MA ). Данный способ отображения упрощает анализ, так как график не загромождён лишними линиями. Так же имеется текстовая метка с отображением текущей цены скользящей средней и периода графика. Горячие клавиши служат для упрощения использования индикатора.
Настройки индикатора: Moving average #1 - скользящая средняя #1 Period - период усреднения Mode - метод сглаживания Price - используемая цена для расч
FREE
Highly configurable OBV indicator.
Features: Highly customizable alert functions (at levels, crosses, direction changes via email, push, sound, popup) Multi timeframe ability Color customization (at levels, crosses, direction changes) Linear interpolation and histogram mode options Works on strategy tester in multi timeframe mode (at weekend without ticks also) Adjustable Levels Parameters:
OBV Timeframe: You can set the lower/higher timeframes for OBV. OBV Bar Shift: Y ou can set the offs
FREE
List of buttons to switch between symbols on multiple charts 1. Set x, y coordinates (horizontal, vertical) for list of buttons. 2. Show/hide buttons by clicking button or keypress. 3. The number of columns of the button list. 4. The color of the buttons and the color of the current symbol button. 5. The button list is separated by commas. If the list is empty, the indicator takes the list of symbols in the Market Watch. 6. Set the keypress to show and hide the list of buttons. 7. Multiple Char
FREE

The indicator informs when the current bar closes and a new bar opens. TIME is an important element of trading systems. BarTimerPro indicator helps you CONTROL THE TIME . Easy to use: place on the chart and set “alarms” if it necessary. In the tester, the indicator does not work. Key Features
Shows the time elapsed since the opening of the current bar Indicator Updates Every Second Setting the appearance (31-36) and the location (21-24) of the indicator, changing all texts (41-50). 4 types of
FREE

The block of bars is collected under condition of convergence . If the convergence conditions are not met, the block is deleted. More precisely, the condition is the transition of the block of bars from the state of convergence to the state of divergence . Blocks are formed selectively with gaps. Gaps are characterized by the state of divergence of bars. Before removing the block, we find the extreme bars inside the block (min, max). The line connects the extreme bars. The line is drawn on
FREE

There is a very simple and surprisingly effective indicator called Pi Cycle, which starts to give the first warning. It is worth a look, so as not to miss the giant elephant in the living room!))
What is Pi Cycle?
Pi Cycle is a very simple indicator created by analyst Philip Swift . It takes into account two (DMA biased moving averages ): 350-day average x 2 111-day average Both can be considered long-term indicators. The second one is obviously more sensitive to current market changes, sin
FREE

The YK-LOT-SIZE is an indicator that displays the total Lot Size and profit/loss of all trade orders for the current symbol on the price chart. It has the following features: Shows the total Lot Size of buy orders (BUY) and sell orders (SELL) on separate lines. Displays the profit/loss of buy orders (BUY) and sell orders (SELL) by calculating the sum of profit, commission, and swap. Users can customize the color of the displayed text through the input parameter. The information is displayed at t
FREE

Indicator of vertical lines on the timeframes М5 and М1. It draws the lines for the period of the current day and the previous day. This indicator visualizes visually shows the trader the beginning and end of the chart hour, as well as the past hourly periods, 30-minute and 5-minute chart intervals. The advantage provided by this indicator is that the trader using this indicator on a chart of a currency pair with the smaller timeframe will always be aware of when the new hour begins.
On the co
FREE

A. Este indicador de pivô mostra os dias Preço Dinâmico.
B. Também mostra Resistência R0.5, R1, R1.5, R2, R2.5 e R3
C. Também mostra suporte S0.5, S1, S1.5, S2, S2.5 e S3
ENTRADA:
Sob entrada você verá 3 variáveis
1.ExtFomula. Aqui você pode definir sua saída preferida em uma resistência ou suporte na janela do gráfico com valor não superior a 1 ou 2 ou 3. 1 representa a saída na resistência ou no suporte 1. 2 representa a saída na resistência ou no suporte 2. 3 representa a saída na r
FREE

The product Divergence Cci Force Stddev Ac Atr is designed to find the differences between indicators and price. It allows you to open orders or set trends using these differences. The indicator has 4 different divergence features.
Divergence types Class A Divergence Class B Divergence Class C Divergence Hidden Divergence
Product Features and Rec ommendations There are 5 indicators on the indicator Indicators = CCI, Force, Stdandard Deviation, Acelereator, Atr 4 different divergence ty
FREE
O Mercado MetaTrader é a única loja onde você pode baixar um robô demonstração de negociação gratuitamente para testes e otimização usando dados históricos.
Leia a visão geral e opiniões de outros clientes sobre os aplicativos, faça o download para o seu terminal e teste um robô de negociação antes de comprá-lo. Apenas no Mercado MetaTrader você pode testar um aplicativo de forma absolutamente gratuita.
Você está perdendo oportunidades de negociação:
- Aplicativos de negociação gratuitos
- 8 000+ sinais para cópia
- Notícias econômicas para análise dos mercados financeiros
Registro
Login
Se você não tem uma conta, por favor registre-se
Para login e uso do site MQL5.com, você deve ativar o uso de cookies.
Ative esta opção no seu navegador, caso contrário você não poderá fazer login.