Aleksey Ivanov / 프로필
- 정보
|
6+ 년도
경험
|
32
제품
|
140
데몬 버전
|
|
0
작업
|
0
거래 신호
|
0
구독자
|
---------------------------------------------------------------------------------------------------------------------
💰 제시된 제품
1) 🏆 시장 소음을 최적으로 필터링하는 표시기(오픈 및 클로징 위치 선택용).
2) 🏆 통계 지표(글로벌 추세를 결정하기 위한).
3) 🏆 시장 조사 지표(가격의 미세 구조를 명확히 하고, 채널을 구축하고, 추세 반전과 후퇴 간의 차이점을 식별하기 위해).
----------------------------------------------------------------------------------------------------------------------------------
☛ 더 많은 정보는 블로그에서 https://www.mql5.com/en/blogs/post/741637
차트에서 보는 추세가 항상 수익을 올릴 수 있는 추세는 아닙니다. 트렌드에는 두 가지 종류가 있다: 1) 안정적이고 따라서 거래자에게 신뢰할 수 있는 이익을 제공할 수 있는 근본적인 경제적 이유에 의해 야기되는 진정한 추세; 2) 추세처럼 보이지만 일련의 무작위 이벤트로 인해 발생하는 잘못된 추세 섹션 - 가격(주로)을 한 방향으로 이동. 이러한 잘못된 추세 섹션은 짧고 언제든지 방향을 바꿀 수 있습니다(그리고 일반적으로 식별 후 즉시 역전됨). 따라서 잘못된 추세로 돈을 버는 것은 (우연이 아닌) 불가능합니다. 시각적으로 참과 거짓 추세는 처음에는 구별할 수 없습니다. 더욱이 무작위 가격 변동이나 그에 의해 생성된 잘못된 추세는 항상 실제 추세에 중첩되어 특히 실제 추세에서 후퇴를 일으킬 수 있습니다. 그러한

https://www.mql5.com/en/market/product/56194
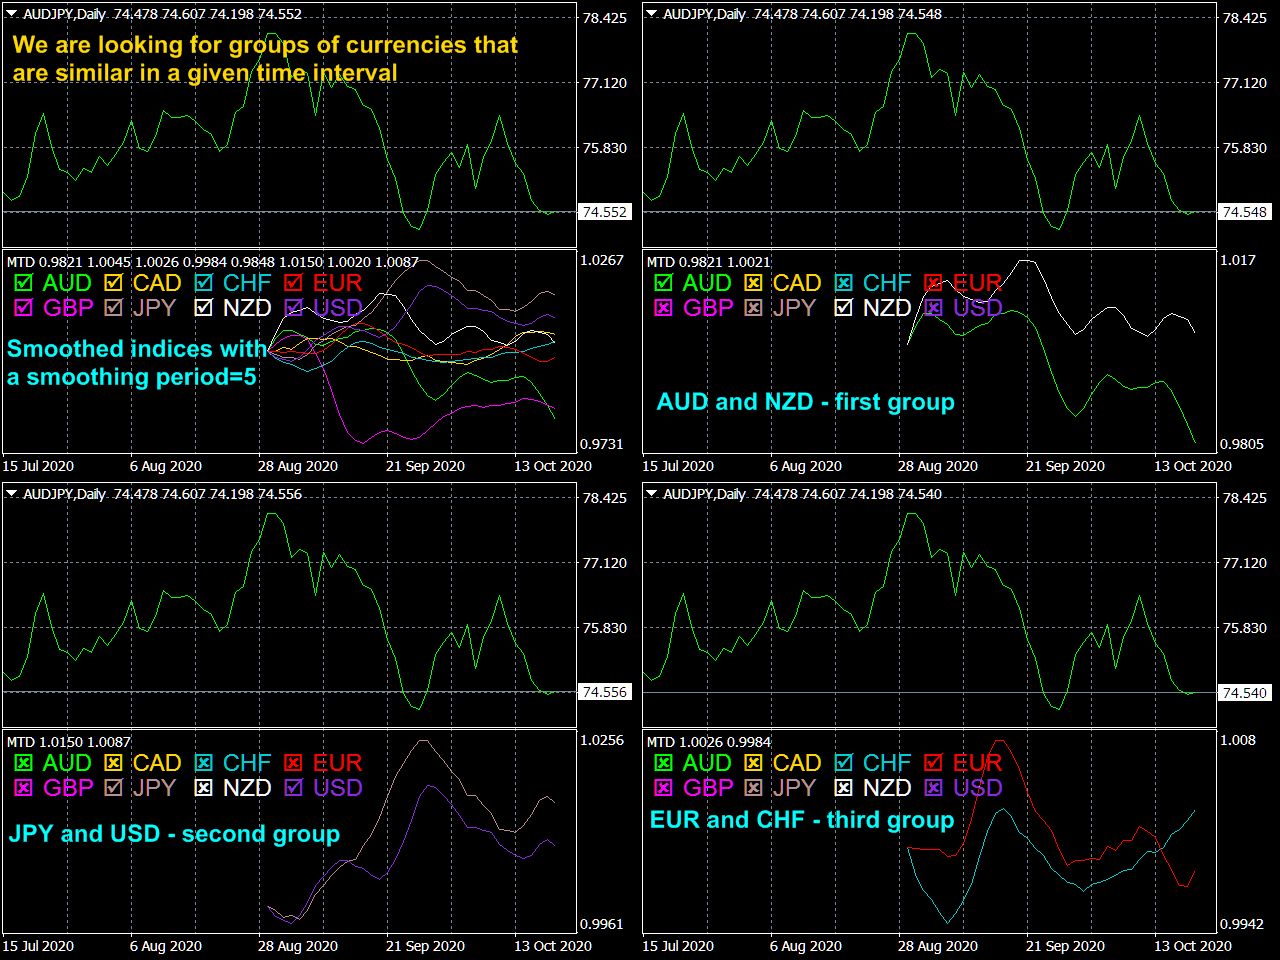
In addition, the indicator on a given time interval easily identifies similarly changing currencies X, Z, etc., which allows you to compose such portfolios of currency pairs X/Y, Z/X, etc. in which separate multidirectional price fluctuations will compensate each other, reducing drawdowns.


The Velocity of price change ( VP ) indicator shows the average rate of price change at those characteristic time intervals where this rate was approximately constant. The robust algorithm used in VP to smooth out the price from its random jumps, ensures the reliability of the indicator reading, which does not react to simple price volatility and its insignificant movements


The TrueChannel indicator shows us the true price movement channels. This indicator resembles Donchian Channel in its appearance, but is built on the basis of completely different principles and gives (in comparison with Donchian Channel , which is better just to use to assess volatility) more adequate trading signals. As shown in the

The StatZigZag indicator looks like a regular ZigZag , but is built on the basis of completely different algorithms. The StatZigZag indicator is a broken line built from segments of regression lines of different lengths, the beginning of each of which comes from the end of the previous segment. Each regression segment is built until the variance or spread of price around it begins to exceed a certain


https://www.mql5.com/en/market/product/56194
In addition, the indicator on a given time interval easily identifies similarly changing currencies X, Z, etc., which allows you to compose such portfolios of currency pairs X/Y, Z/X, etc. in which separate multidirectional price fluctuations will compensate each other, reducing drawdowns.

https://www.mql5.com/en/market/product/56194
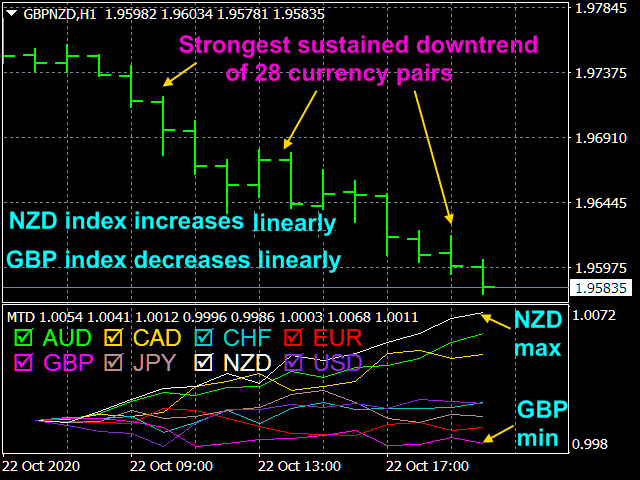
The Multicurrency Trend Detector (MTD) indicator allows you to immediately and on one chart on a selected time interval (extending from a zero bar to a bar set in the settings by the value horizon) determine the presence, direction and strength of trends in all major currencies, as well as assess the reliability of these trends.


The Multicurrency Trend Detector ( MTD ) indicator allows you to immediately and on one chart on a selected time interval (extending from a zero bar to a bar set in the settings by the value horizon) determine the presence, direction and strength of trends in all major currencies, as well as assess the reliability of these trends. This is


