Aleksey Ivanov / 프로필
- 정보
|
6+ 년도
경험
|
32
제품
|
140
데몬 버전
|
|
0
작업
|
0
거래 신호
|
0
구독자
|
👑 이론물리학자, 프로그래머. 저는 15년 동안 시장에서 수학적 패턴을 찾는 데 중점을 두고 거래해 왔습니다.
---------------------------------------------------------------------------------------------------------------------
💰 제시된 제품
1) 🏆 시장 소음을 최적으로 필터링하는 표시기(오픈 및 클로징 위치 선택용).
2) 🏆 통계 지표(글로벌 추세를 결정하기 위한).
3) 🏆 시장 조사 지표(가격의 미세 구조를 명확히 하고, 채널을 구축하고, 추세 반전과 후퇴 간의 차이점을 식별하기 위해).
----------------------------------------------------------------------------------------------------------------------------------
☛ 더 많은 정보는 블로그에서 https://www.mql5.com/en/blogs/post/741637
Aleksey Ivanov

StatPredict indicator https://www.mql5.com/en/market/product/38721
The indicator predicts the price in accordance with the prevailing trend and its own small statistical price fluctuations around this trend.
The indicator predicts the price in accordance with the prevailing trend and its own small statistical price fluctuations around this trend.

소셜 네트워크에 공유 · 1
Aleksey Ivanov
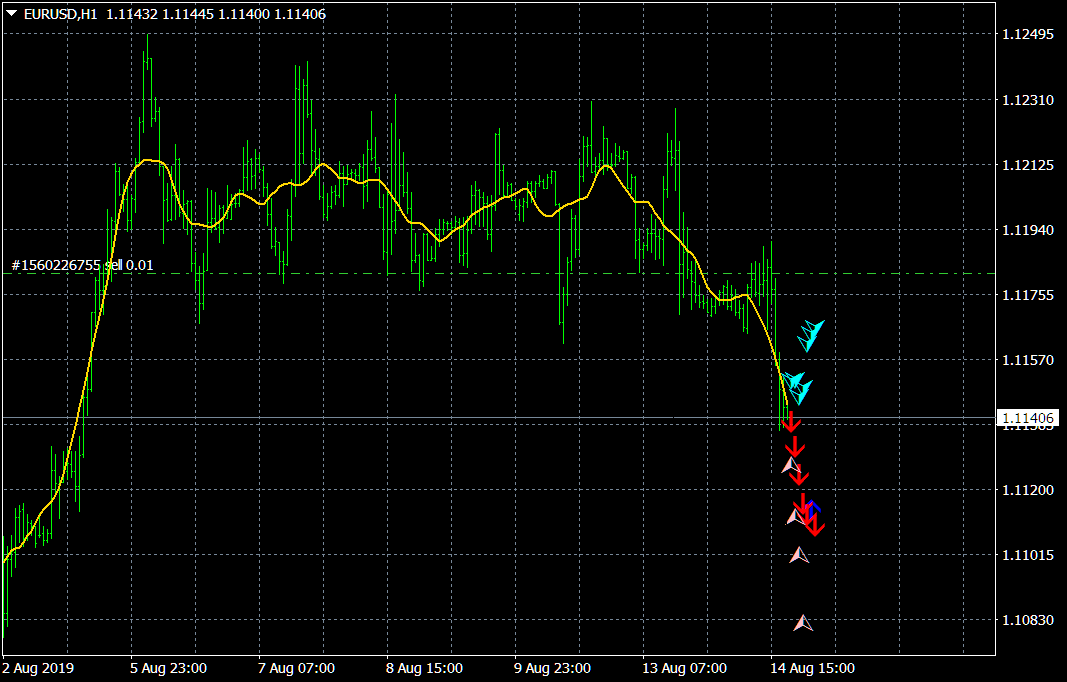
StatPredict indicator https://www.mql5.com/en/market/product/38721
The indicator predicts the price in accordance with the prevailing trend and its own small statistical price fluctuations around this trend.
The indicator predicts the price in accordance with the prevailing trend and its own small statistical price fluctuations around this trend.

소셜 네트워크에 공유 · 1
Aleksey Ivanov

Probabilities distribution of price (new version V2.0) indicator https://www.mql5.com/en/market/product/27070
PDP indicator is used for:
1.defining price probability distributions. This allows for a detailed representation of the channel and its borders and forecast the probability of a price appearing at each segment of its fluctuations;
2.defining the channel change moment.
PDP indicator is used for:
1.defining price probability distributions. This allows for a detailed representation of the channel and its borders and forecast the probability of a price appearing at each segment of its fluctuations;
2.defining the channel change moment.

소셜 네트워크에 공유 · 1
Aleksey Ivanov

Signal Bands v. 2.0 https://www.mql5.com/en/market/product/29171
Signal Bands is a sensitive and convenient indicator, which performs deep statistical processing of information. It allows to see on one chart (1) the price trend, (2) the clear price channel and (3) latent signs of trend change. The indicator can be used on charts of any periods, but it is especially useful for scalping due to its high sensitivity to the current market state.
Signal Bands is a sensitive and convenient indicator, which performs deep statistical processing of information. It allows to see on one chart (1) the price trend, (2) the clear price channel and (3) latent signs of trend change. The indicator can be used on charts of any periods, but it is especially useful for scalping due to its high sensitivity to the current market state.

소셜 네트워크에 공유 · 1
Aleksey Ivanov
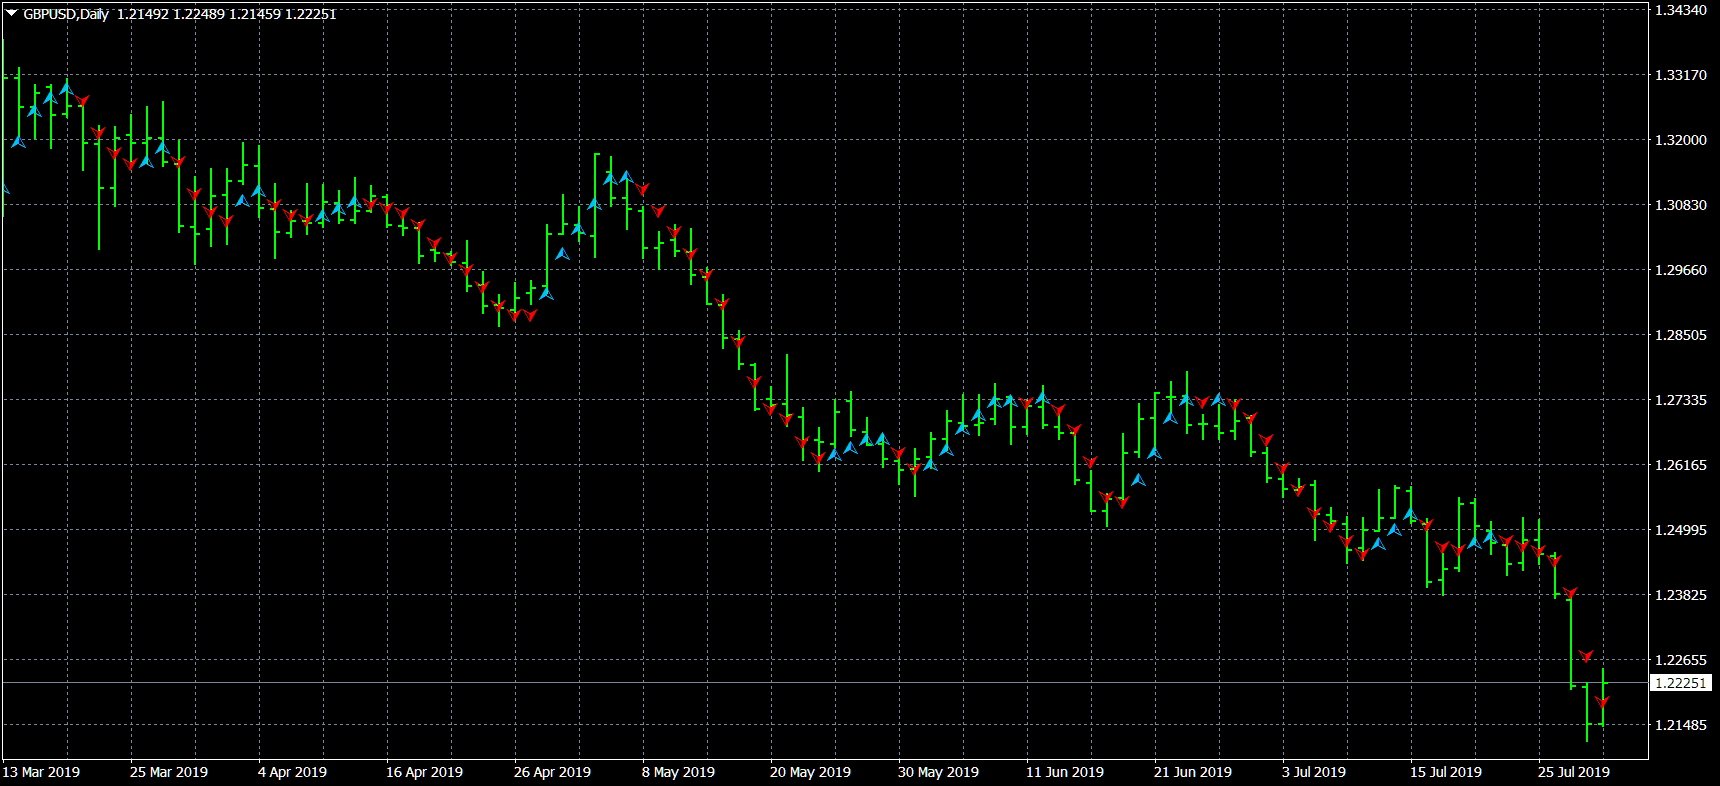
Sensitive Signal https://www.mql5.com/en/market/product/34171
The Sensitive Signal (SS) indicator, using the filtering methods developed by the author, allows, with a high degree of probability, to establish the beginning of the true (filtered from interference - random price walks) trend movement. It is clear that such an indicator is very effective for trading on the currency exchange, where signals are highly distorted by random noise.
The Sensitive Signal (SS) indicator, using the filtering methods developed by the author, allows, with a high degree of probability, to establish the beginning of the true (filtered from interference - random price walks) trend movement. It is clear that such an indicator is very effective for trading on the currency exchange, where signals are highly distorted by random noise.

소셜 네트워크에 공유 · 1
Aleksey Ivanov

Profit MACD (new version V 2.2) https://www.mql5.com/en/market/product/35659
I present an indicator for professionals. ProfitMACD is very similar to classic MACD in appearance and its functions. However, ProfitMACD is based on completely new algorithms (for example, it has only one averaging period) and is more robust, especially on small timeframes, since it filters random price walks.
I present an indicator for professionals. ProfitMACD is very similar to classic MACD in appearance and its functions. However, ProfitMACD is based on completely new algorithms (for example, it has only one averaging period) and is more robust, especially on small timeframes, since it filters random price walks.

소셜 네트워크에 공유 · 1
Aleksey Ivanov

StatPredict indicator https://www.mql5.com/en/market/product/38721
The indicator predicts the price in accordance with the prevailing trend and its own small statistical price fluctuations around this trend.
The indicator predicts the price in accordance with the prevailing trend and its own small statistical price fluctuations around this trend.

소셜 네트워크에 공유 · 1
Aleksey Ivanov

Profit MACD (new version V 2.2) https://www.mql5.com/en/market/product/35659
I present an indicator for professionals. ProfitMACD is very similar to classic MACD in appearance and its functions. However, ProfitMACD is based on completely new algorithms (for example, it has only one averaging period) and is more robust, especially on small timeframes, since it filters random price walks.
I present an indicator for professionals. ProfitMACD is very similar to classic MACD in appearance and its functions. However, ProfitMACD is based on completely new algorithms (for example, it has only one averaging period) and is more robust, especially on small timeframes, since it filters random price walks.

소셜 네트워크에 공유 · 1
Aleksey Ivanov


The principle of the indicator. The Asummetry indicator allows you to predict the beginning of a change in the direction of trends, long before their visual appearance on the price chart...
소셜 네트워크에 공유 · 1
238
Aleksey Ivanov
출시돈 제품
The principle of the indicator. The Asummetry indicator allows you to predict the beginning of a change in the direction of trends, long before their visual appearance on the price chart. The author statistically revealed that before changing the direction
소셜 네트워크에 공유 · 1
Aleksey Ivanov
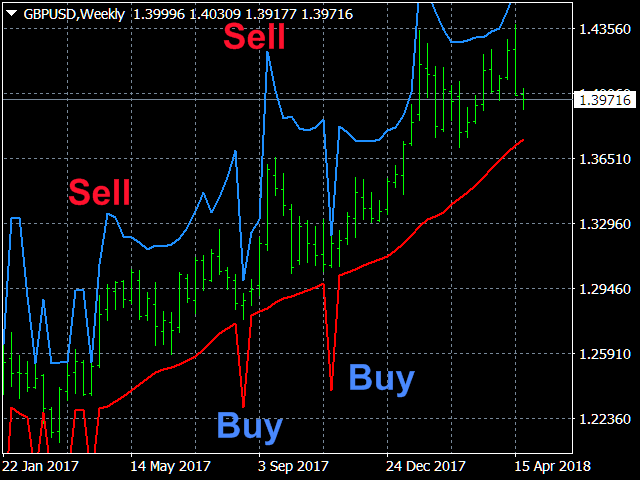
Signal Bands v. 2.0 https://www.mql5.com/en/market/product/29171
Signal Bands is a sensitive and convenient indicator, which performs deep statistical processing of information. It allows to see on one chart (1) the price trend, (2) the clear price channel and (3) latent signs of trend change. The indicator can be used on charts of any periods, but it is especially useful for scalping due to its high sensitivity to the current market state.
Signal Bands is a sensitive and convenient indicator, which performs deep statistical processing of information. It allows to see on one chart (1) the price trend, (2) the clear price channel and (3) latent signs of trend change. The indicator can be used on charts of any periods, but it is especially useful for scalping due to its high sensitivity to the current market state.

소셜 네트워크에 공유 · 3
Aleksey Ivanov

StatPredict indicator https://www.mql5.com/en/market/product/38721
The indicator predicts the price in accordance with the prevailing trend and its own small statistical price fluctuations around this trend.
The indicator predicts the price in accordance with the prevailing trend and its own small statistical price fluctuations around this trend.

소셜 네트워크에 공유 · 1
Aleksey Ivanov
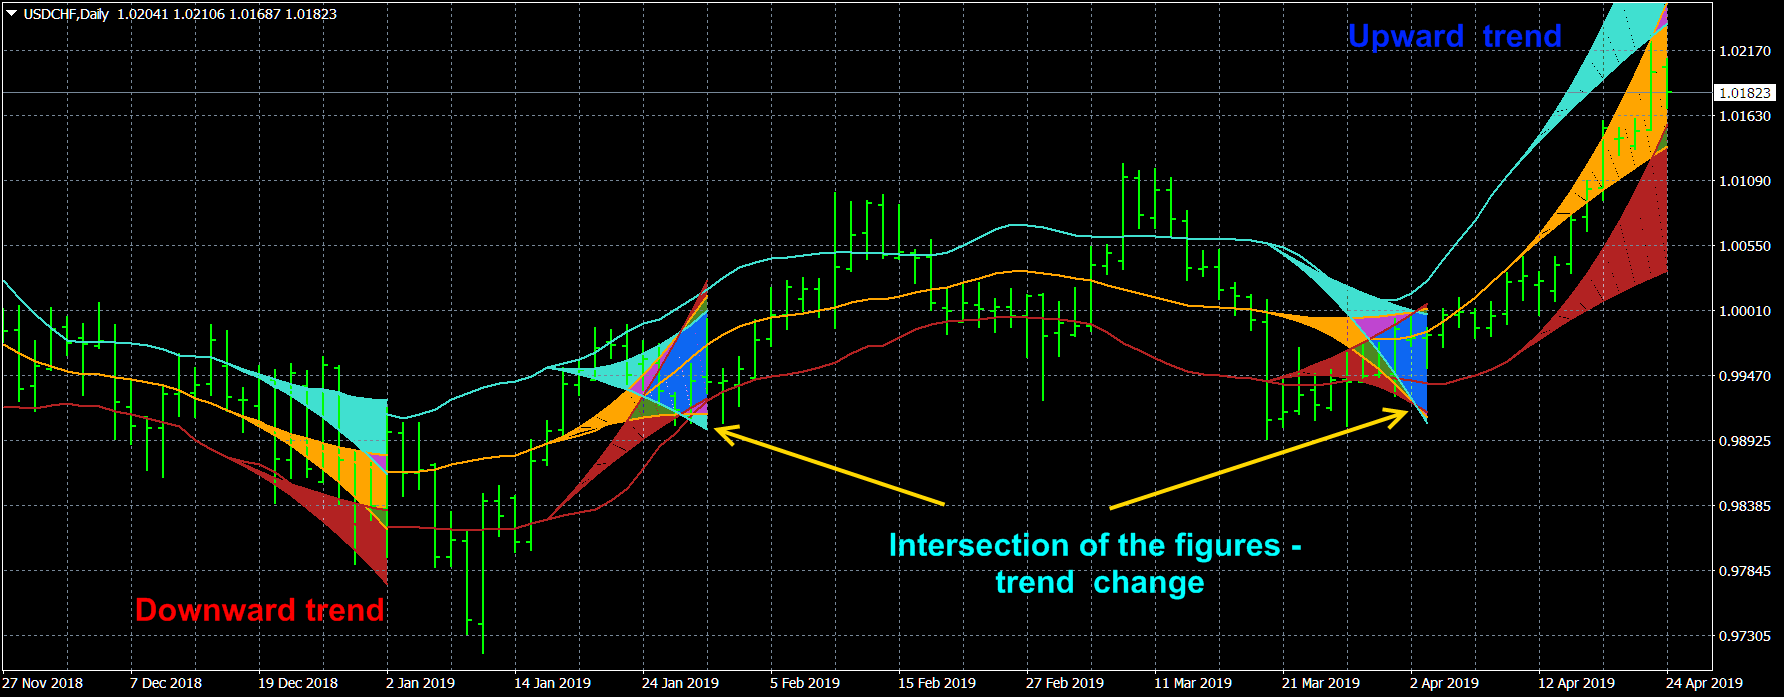
StatChannel https://www.mql5.com/en/market/product/37619
The StatChannel indicator is constructed in the same way as a classic Bollinger Bands indicator, but only on the basis of the non-lagging moving average. Such a curve is calculated at points (Inf, n + 1], as a moving average at the segment (Inf, 0], where 0 is the number of the last bar, shifted back by n bars, and at the points of the segment [n, 0] it is estimated. The estimate is a curvilinear sector (sweeping confidence interval) in which the line of the non-lagging moving average is laid with a given confidence level. The non-lagging average is also surrounded by non-lagging std, which is determined at points at points (Inf, n + 1) in the same way as the non-lagging moving average, and at points of the segment [n, 0] - by a special algorithm that calculates the set of values std, that will be within the specified value of the confidence interval.
The StatChannel indicator is constructed in the same way as a classic Bollinger Bands indicator, but only on the basis of the non-lagging moving average. Such a curve is calculated at points (Inf, n + 1], as a moving average at the segment (Inf, 0], where 0 is the number of the last bar, shifted back by n bars, and at the points of the segment [n, 0] it is estimated. The estimate is a curvilinear sector (sweeping confidence interval) in which the line of the non-lagging moving average is laid with a given confidence level. The non-lagging average is also surrounded by non-lagging std, which is determined at points at points (Inf, n + 1) in the same way as the non-lagging moving average, and at points of the segment [n, 0] - by a special algorithm that calculates the set of values std, that will be within the specified value of the confidence interval.

소셜 네트워크에 공유 · 1
Aleksey Ivanov
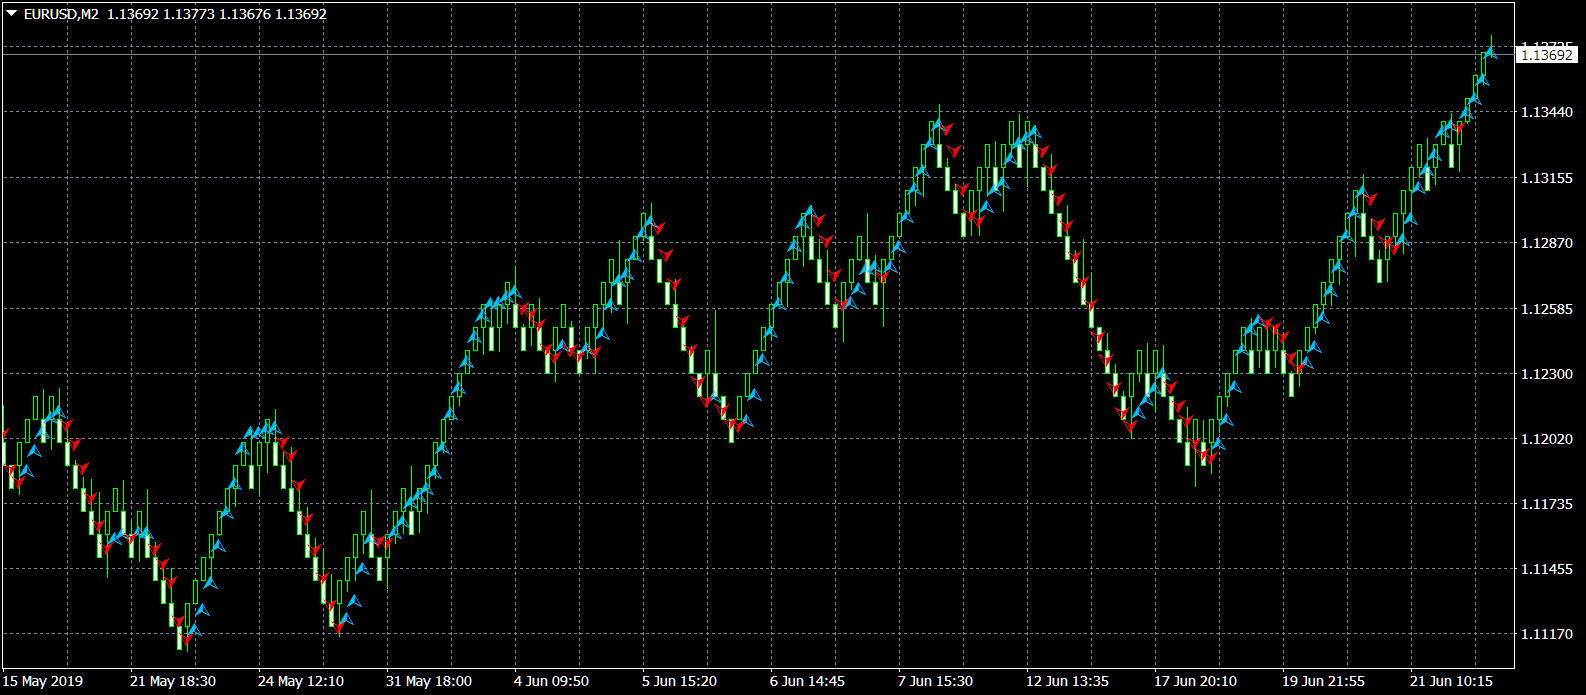
Sensitive Signal on the Renko chart. https://www.mql5.com/en/market/product/34171

소셜 네트워크에 공유 · 1
Aleksey Ivanov

StatPredict indicator https://www.mql5.com/en/market/product/38721
Description of the slides.
1. With quiet natural price movement, its tendency is determined and a position is opened.
2. There is an artificial process of price consolidation.
3. The artificial consolidation process is completed and the price continues its natural movement, closing the position.
Description of the slides.
1. With quiet natural price movement, its tendency is determined and a position is opened.
2. There is an artificial process of price consolidation.
3. The artificial consolidation process is completed and the price continues its natural movement, closing the position.

소셜 네트워크에 공유 · 1
Aleksey Ivanov
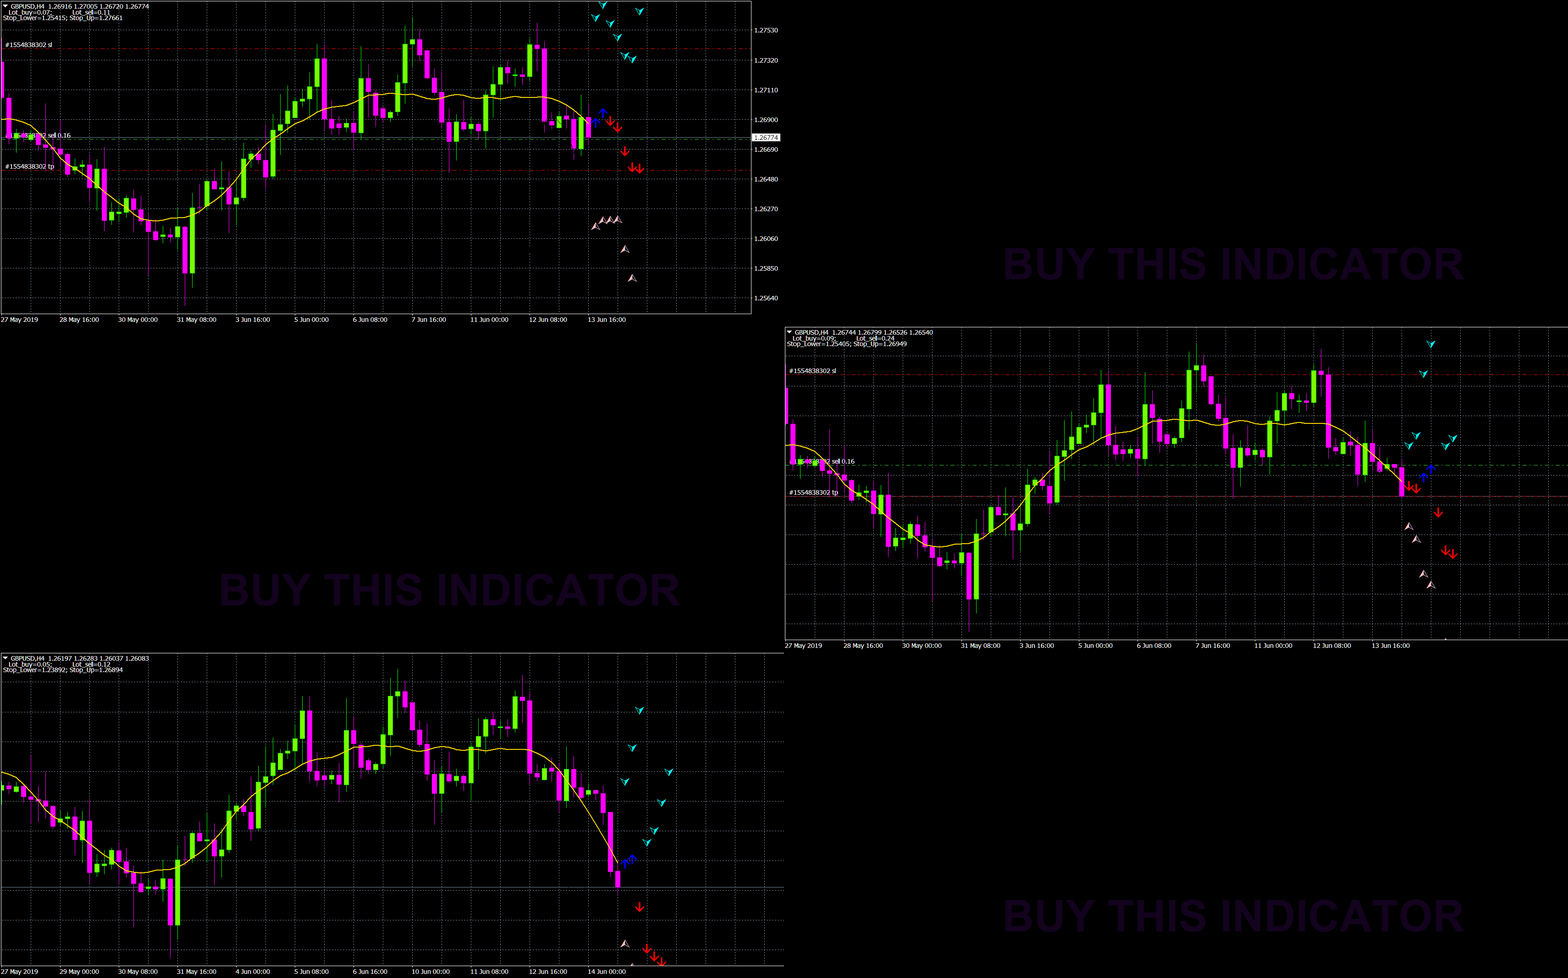
StatPredict indicator https://www.mql5.com/en/market/product/38721
The indicator predicts the price in accordance with the prevailing trend and its own small statistical price fluctuations around this trend.
The indicator predicts the price in accordance with the prevailing trend and its own small statistical price fluctuations around this trend.

소셜 네트워크에 공유 · 1
Aleksey Ivanov


简介。 该指标根据当前趋势及其自身的小统计价格波动预测价格。在StatPredict中,您需要设置预测事件的时间范围,该事件由指标“条形预测长度” 的设置参数设置。预测的时间范围由当前趋势的特征时间尺度确定,最好通过指标 ProfitMACD 或前一个价格合并时段进行评估,从中可以将四分之一(1/4)作为预测范围。 当安装在“专家”选项卡中的图表上时,将打印有关指示器操作模式的信息。 1...
소셜 네트워크에 공유 · 1
575
1
[삭제]
2019.06.10
interesting idea
Aleksey Ivanov


Einleitung. Der Indikator prognostiziert den Preis in Übereinstimmung mit dem vorherrschenden Trend und seinen eigenen kleinen statistischen Preisschwankungen...
소셜 네트워크에 공유 · 1
169
1
Aleksey Ivanov

Alec Markarian
제품 리뷰 Sensitive Signal
Great indicator to use for confirmation of bias and/or exits, under correct settings and time frame, can be adjusted very well to precisely fit your strategy, in what ever market it is that you trade
소셜 네트워크에 공유 · 1
:

