MetaTrader 5용 유료 기술 지표 - 6

Description
Bitcoin Manager is the best indicator for trading Bitcoin cryptocurrency. It is calculated based on the price deviation from the moving average line channel. Ascending and descending arrows indicate potential points and levels for opening buy and sell positions.
How to use?
We strongly recommend using this indicator on the H1 timeframe. An up arrow indicates a buy level. Down Arrow - Sell Level.
Parameters
Maximum History Bars - maximum count of history bars to calculate

For those who need a Volume Profile / Market Profile indicator, here is the solution!
It contains the essential information:
Control Point (POC); Higher Value Area (VAH); Lower Value Area (VAL); You can choose to SHOW or NOT SHOW the volume Histogram, according to your wish. If you choose to show the histogram, note that according to the type of asset, it is necessary to adjust the scale of the indicator (last parameter of the indicator).
You can also choose from the data source of your h
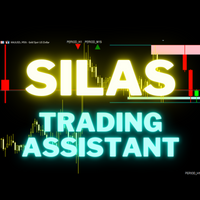
Silas is a trading assistant for multi-timeframes traders. It show on the screen, in a very clear way, all the informations needed to suits to your trading. It show : - Supply and demand zone from 2 timeframes of your choice - Setups based of market structure from 2 timeframes of your choice - Daily current high and low points - The last 2 closed candles and the current candle from an higher time frame on the right of the graph. - Actual daily candle on the left Everything is customisable !

HighQualityMap是一个很好的中长线交易指示器,这个指标可以单独使用,尤其是用在M30或者大于M30的时间框架下,它能很好的体现出趋势的走向,以及转折点,你可以很快的从这个指示器上寻找到最佳的buy和sell位置,同时也能很好根据指示器去坚守自己的持仓定订单。指标不含有未来函数,不会重新绘制,不仅能够应用到自己的手动交易过程中,还能完全可以写入到自己的EA中。(如果你感觉到这个指标能够帮助你进行更准确的交易,请帮忙给个好评,希望我的作品能够帮助更多有需要的人) ===================参数列表===================== 所有参数均采用默认参数即可,无需更改,若为激进型交易者,可以根据自己的需要来调整参数。 =================参考使用方法=================== 此指标可以适用于任何交易品种,使用周期框架大于M30相对更准确。

StartPoint是一个很好的短线交易指示器,这个指标可以单独使用,但是最好是配合 HighQualityMap 一起使用,适用于任何时间框架,喜欢超短线的朋友可以使用M5时间框架。它能很好的体现出短期趋势的启动点,你可以很快的从这个指示器上寻找到最佳的buy和sell位置,同时也能很好根据指示器去坚守自己的持仓定订单。指标不含有未来函数,不会重新绘制,不仅能够应用到自己的手动交易过程中,还能完全可以写入到自己的EA中。(如果你感觉到这个指标能够帮助你进行更准确的交易,请帮忙给个好评,希望我的作品能够帮助更多有需要的人) ===================参数列表===================== 所有参数均采用默认参数即可,无需更改,若为激进型交易者,可以根据自己的需要来调整参数。 =================参考使用方法=================== 此指标可以适用于任何交易品种。

The Market Structure Analyzer is a powerful tool designed for traders who follow market structure and smart money concepts. This comprehensive indicator provides a suite of features to assist in identifying key market levels, potential entry points, and areas of liquidity. Here's what it offers:
1. Swing High/Low Detection : Accurately identifies and marks swing highs and lows, providing a clear view of market structure.
2. Dynamic Supply and Demand Zones: Draws precise supply and demand zo
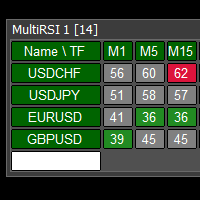
This tool monitors RSI indicators on all time frames in the selected markets. Displays a table with signals to open a BUY trade (green) or SELL trade (red). You can set the conditions for the signal. You can easily add or delete market names / symbols. If the conditions for opening a trade on multiple time frames are met, you can be notified by e-mail or phone message (according to the settings in MT5 menu Tools - Options…) You can also set the conditions for sending notifications. The list of s

This tool monitors MACD indicators on all time frames in the selected markets. Displays a table with signals to open a BUY trade (green) or SELL trade (red). You can set the conditions for the signal. You can easily add or delete market names / symbols. If the conditions for opening a trade on multiple time frames are met, you can be notified by e-mail or phone message (according to the settings in MT5 menu Tools - Options…) You can also set the conditions for sending notifications. The list of

금융 지표 SolarTrade Suite: 수은 시장 지표 - 금융 시장 세계에서 신뢰할 수 있는 가이드!
특별하고 혁신적이고 진보된 알고리즘을 사용하여 가치를 계산하고 눈을 즐겁게 하는 디자인을 갖춘 이동 평균입니다.
파란색 - 매수, 빨간색 - 매도 등 이 지표의 수치를 이해하는 것은 매우 간단합니다. 색상이 밝을수록 신호가 강해집니다.
설명 하단에서 다른 SolarTrade Suite 제품을 확인하세요.
투자 및 금융 시장의 세계를 자신있게 탐색하고 싶습니까? SolarTrade Suite Financial Indicator: Mercury Market Indicator는 정보에 입각한 투자 결정을 내리고 수익을 높이는 데 도움을 주기 위해 설계된 혁신적인 소프트웨어입니다.
SolarTrade Suite 재무 지표의 장점: Mercury Market Indicator:
- 정확한 예측: 우리 지표는 고급 알고리즘과 분석 방법을 사용하여 시장 움직임을 정확

지수 변동성 추세 지표.
주요 특징:
Binary 또는 Deriv 중개인의 합성 지수(동일한)에만 사용됩니다. 트렌드 필터가 있습니다. 가격 하락 가능성에 대해 경고하는 사운드 경고가 있습니다. VPS에 올려놓으면 모바일 알림을 보낼 수 있습니다. 더 나은 효율성을 위해 설계된 L566b12 알고리즘으로 구성됩니다.
표시기 사용법
그것은 M1의 시간성에서 작동합니다. 추세가 강해야 합니다. 신호 촛불이 추세와 다른 색상으로 끝날 때까지 기다리십시오. Deriv 시계의 57초에 입력하여 다음 촛대가 시작될 때 바로 거래를 입력합니다. 마팅게일은 2개까지만 신청할 수 있습니다.
자세한 내용은 다음 연락처로 문의하십시오.
WhatsApp: +5930962863284
구매 후 이 도구를 최대한 활용하는 방법에 대한 추가 가이드를 보내려면 저에게 연락하십시오 .
최고의 티켓을 받는 방법에 대한 PDF의 실용 가

Multicurrency and multitimeframe modification of the Commodity Channel Index (CCI) indicator. You can specify any desired currencies and timeframes in the parameters. Also, the panel can send notifications when crossing overbought and oversold levels. By clicking on a cell with a period, this symbol and period will be opened. This is MTF Scanner. The key to hide the dashboard from the chart is "D" by default.
Parameters CCI Period — averaging period.
CCI Applied price — price type.
Clea

This is an indicator of trading sessions that can display all levels (Open-High-Low-Close) for four sessions . The indicator can also predict session levels. Sessions can be drawn with lines or rectangles (empty or filled), lines can be extended to the next session. You can easily hide/show each session by pressing hotkeys (by default '1', '2', '3', '4'). You can see ASR (Average Session Range) lines (default hotkey 'A'). This is similar to the ADR calculation, only it is calculated based on

Do you already know the Start Midas indicator?
What about the Vwap Standard Deviation indicator?
And I need to speak again in the book MIDAS Technical Analysis ...
The Start Midas SD Channel indicator combines the two in one, bringing the practicality and efficiency of Midas with the statistical calculation of the standard deviation.
All of this with the practicality of the White Trader Start indicators, where you can plot the indicator and move them on the screen using keyboard s

This indicator can identify more than 60 candlestick patterns on the chart, including their bullish and bearish variants. Just choose the pattern you want in the settings.
Available Patterns 2 Crows Gravestone Doji On Neck 3 Black Crows Hammer Piercing 3 Inside Hanging Man Rick Shawman 3 Line Strike Harami Rising and Falling Three Method 3 Outside Harami Cross Separating Lines 3 Stars in South High Wave Shooting Star 3 White Soldiers Hikkake Short Line Abandoned Baby Hikkake Modified Spinning

이 지표는 동일한 차트에서 추적하려는 다른 기간 캔들스틱을 효율적으로 추적합니다.
1. 동일한 차트에 막대를 로드하려면 더 높은 기간을 선택하세요.
2. 촛대의 색상과 스타일을 사용자 정의하세요
3. 캔들스틱을 그릴 막대 수를 선택하세요.
4. 심지 및 몸체와 함께 더 높은 기간의 전체 양초를 추적합니다.
5. 차트 전환을 원하지 않는 사람들을 위해 쉽고 편리합니다.
이 지표는 동일한 차트에서 추적하려는 다른 기간 캔들스틱을 효율적으로 추적합니다.
1. 동일한 차트에 막대를 로드하려면 더 높은 기간을 선택하세요.
2. 촛대의 색상과 스타일을 사용자 정의하세요
3. 캔들스틱을 그릴 막대 수를 선택하세요.
4. 심지 및 몸체와 함께 더 높은 기간의 전체 양초를 추적합니다.
5. 차트 전환을 원하지 않는 사람들을 위해 쉽고 편리합니다.

금융 지표 SolarTrade Suite: 명왕성 시장 지표 - 금융 시장 세계에서 신뢰할 수 있는 가이드!
특별한 혁신적이고 고급 알고리즘을 사용하여 가치를 계산하고 멋진 디자인을 갖춘 변동성 오실레이터입니다.
이 지표의 수치를 이해하는 것은 매우 간단합니다. 녹색 - 낮은 변동성과 무역 거래를 개시하기에 가장 좋은 시간, 주황색 - 높은 변동성과 거래 포지션 마감을 고려할 시간입니다. 색상이 밝을수록 신호가 강해집니다. 귀하의 편의를 위해 이 표시기의 창을 클릭하여 신호를 반전시킬 수 있습니다.
설명 하단에서 다른 SolarTrade Suite 제품을 확인하세요.
투자 및 금융 시장의 세계를 자신있게 탐색하고 싶습니까? SolarTrade Suite Financial Indicator: Pluto Market Indicator는 정보에 입각한 투자 결정을 내리고 수익을 높이는 데 도움이 되도록 설계된 혁신적인 소프트웨어입니다.
SolarTrade Suite 재

무한대에서 통화의 강도를 측정하는이 혁신적인 지표는 오랫동안 거래하는 암표 및 거래자에게 없어서는 안될 조수입니다. 통화의 강도/약점을 분석하는 시스템은 오랫동안 알려져 있으며 세계 최고의 거래자들에 의해 시장에서 사용되었습니다. 이 분석 없이는 차익 거래가 완료되지 않습니다. 우리의 지표는 서로 관련하여 기본 통화의 강도를 쉽게 결정합니다. 표시 라인에 차트에 대한 모든 또는 현재 통화 쌍의 수 있도록 즉각적인 분석 및 검색에 대한 강한 진입 점. 표시등,직관적 인 사용하면 신속하게 찾아와 스위치는 모든 쌍,모바일 패널 배치할 수 있는 모두에서 지하실에는 기본 차트. 통화의 강도의 변화의 통지의 타이머 모드는 상인에게 전화로 알림을받을 수있는 기회를 제공합니다.
통화 전력계 무한대 표시기를 사용하기위한 몇 가지 전략:
1. 신흥 추세에 대한 신호로 교차점을 검색 할 통화의 강도의 선형 표시의 차트를 사용하여 2. 추세 반전 신호가 나타난 후 강한 통화 방향으로 두피
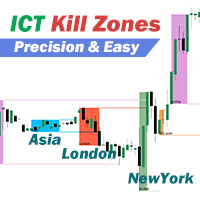
ICT 킬존의 5가지 시간대를 다른 색상으로 표시하고 추적을 따라 시간대 내 가격 영역을 표시하면 피벗 포인트 가격이 깨지거나 거래 기간이 끝날 때까지 고점과 저점 기준선이 자동으로 연장됩니다. 이 지표는 추세와 함께 거래할 거래 돌파 지점을 찾는 데 도움이 됩니다. ICT 킬존은 시장에서 거래량과 변동성이 증가하는 경향이 있는 특정 기간으로, 트레이더에게 잠재적 수익 기회를 열어줍니다. 5개의 킬존은 모두 고유한 색상과 주기로 사용자 지정할 수 있으며 원하는 대로 미세 조정하거나 완전히 다른 시간대로 조정할 수 있습니다. 표시기는 조정 사항을 자동으로 추적합니다. 인디케이터를 처음 사용할 때는 시간 오프셋을 설정해야 하는데, '현재 브로커 UTC 시프트'에서 메타트레이더 브로커 시간의 UTC 시차를 입력합니다(예: 메타트레이더의 기본 시간대가 UTC+3인 경우 3을 입력하고 베이징 시간으로 변경된 경우 8을 입력). 일광 절약 시간제(DST) 적용 지역의 경우, DST가 적용되면

The Rubdfx swing indicator is a useful tool for traders looking to identify trend changes in a particular instrument they are trading. It is designed to draw a line on the main chart, and the signals are indicated by color changes with signal alerts. The color green is used to indicate a bullish trend, while the color pink is used to indicate a bearish trend. These colors can be customized to fit the trader's preferences or theme. The Rubdfx swing indicator has the ability to spot both long-te

이 인디케이터는 플랫을 감지하고 발견된 영역을 컬러 직사각형으로 칠합니다.
이 인디케이터의 주요 아이디어는 가격이 차트의 특정 영역을 채울 때 플랫을 감지하는 것입니다.
입력 매개변수:
Color rectangle - 음영 처리할 사각형의 색상입니다.
Bars in rectangle - 직사각형에 허용되는 최소 막대 수입니다.
Density in % - 플랫의 밀도로, 사각형 영역의 백분율로 설정합니다.
__________________________________________________________________ __________________________________________________________________
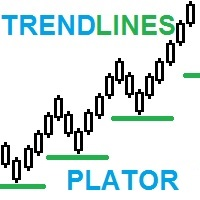
트렌드플레이터: 최적화된 거래 전략을 위한 강력한 추세 예측 지표 우리의 새로운 지표의 힘을 발견하세요! 더 큰 시간 프레임의 추세선을 계산하고 현재 시간 프레임에 직접 예측하여 모든 트레이더의 주목을 끄는 전략적인 지원을 제공합니다. 이러한 포인트는 거래에 강력한 지지나 저항 수준이 되어 거래 전략을 촉진합니다. Price action 지표 컬렉션에 완벽하게 부가되는 지표에 대한 액세스를 상상해보세요. 우리의 새로운 지표가 바로 그것입니다! 테스트해 보고 그 정확성에 놀라워하십시오. 이는 당신의 전략에 부족한 조각이 될 수 있으며 결과를 향상시킬 수 있습니다. 시간을 낭비하지 마세요! 이 멋진 도구를 거래 아카이브에 추가하는 기회를 활용하십시오. 그 가치와 잠재력을 인정한다면 지금 구매하는 것을 망설이지 마십시오. 강력한 지표와 함께 성공의 새로운 수준에 도달하여 정확도를 높이세요! 새로운 소식을 놓치지 마세요 독점적인 출시 소식을 받으려면 지금 가입하세요. 프란시스코 고메스 다

The DR IDR Range Indicator PRO plots ADR, ODR and RDR ranges for a given amount of days in the past. A key feature that appears is that it calculates the success rate of the ranges for the shown days. This indicator is perfect for backtest since it shows ranges for all of the calculated days, not just the most recent sessions. In the PRO version you can now: use fully customizable advanced statistics to base your trades on get an edge via calculating statistics on up to 3 different day period


이 다중 시간 프레임 및 다중 기호 표시기는 스토캐스틱 신호 라인이 스토캐스틱 메인 라인을 교차하는 시기를 식별합니다. 대안으로 스토캐스틱이 과매수/과매도 영역을 벗어나는 경우(본선을 가로지르는 신호선 없이) 경고할 수도 있습니다. 보너스로 볼린저 밴드와 RSI 과매수/과매도 교차를 스캔할 수도 있습니다. 자신의 규칙 및 기술과 결합하여 이 지표를 사용하면 자신만의 강력한 시스템을 만들거나 향상시킬 수 있습니다. 특징 Market Watch 창에 표시되는 모든 기호를 동시에 모니터링할 수 있습니다. 지표를 하나의 차트에만 적용하고 전체 시장을 즉시 모니터링하십시오. M1에서 MN까지 모든 시간 프레임을 모니터링할 수 있으며 교차가 식별되면 실시간 경고를 보냅니다. 모든 Metatrader 기본 경고 유형이 지원됩니다. 표시기에는 대화형 패널이 포함되어 있습니다. 설명은 별도의 스크린샷을 참조하십시오. 표시기는 신호를 텍스트 파일에 쓸 수 있습니다. 또는 전역 변수

브로커리지의 기술적 및 논리적 조작으로 인해 저는 다음과 같은 기능을 가진 수많은 전략을 결합한 이 후방 지표를 제공하기 위해 먼 길을 왔습니다.
시장 추세 식별: 시장의 전반적인 추세를 이해합니다.
반전 지점: 시장이 방향을 바꿀 수 있는 잠재적 지점을 식별합니다.
진입 및 종료 지점: 거래에 진입하고 종료할 최적의 시기를 결정합니다.
이 지표를 사용하는 방법에 대한 포괄적인 이해를 위해 첨부된 비디오를 시청하세요. 또한 제공된 지표를 다운로드하여 완전한 분석을 확인하세요. ...................................... https://www.mql5.com/en/market/product/92909
AND https://www.mql5.com/en/market/product/109519

통화 강도 측정기는 현재 어떤 통화가 강하고 어떤 통화가 약한지에 대한 빠른 시각적 가이드를 제공합니다. 미터는 모든 외환 교차 쌍의 강도를 측정하고 계산을 적용하여 각 개별 통화의 전체 강도를 결정합니다. 우리는 28 쌍의 추세를 기반으로 통화의 강도를 기반으로 계산합니다.
MQL5 블로그에 액세스하여 표시기의 무료 버전을 다운로드할 수 있습니다. Metatrader 테스터 제한 없이 구매하기 전에 시도하십시오. 여기를 클릭하십시오.
1. 문서 모든 추세 통화 강도 문서( 지침 ) 및 전략 세부 정보는 MQL5 블로그의 이 게시물에서 볼 수 있습니다. 여기를 클릭하십시오.
2. 연락처 질문이 있거나 도움이 필요하면 비공개 메시지를 통해 저에게 연락하십시오.
3. 저자 SAYADI ACHREF, 핀테크 소프트웨어 엔지니어이자 Finansya 설립자.
This indicator shows No Demand and No Supply signals for high probability trade entries and exits. Very powerful when combined with specific support and resistance zones to identify turning points in the market.
No Demand – the situation of a deficit of buyers in the up-move. Possible short position. Definition: (look at the below screenshots for illustration) Signal candle volume is lower than the previous two. Signal candle is bullish. Signal candle has an upper wick/pin. Confirmation candle

RSI 교차 경고는 거래 전략에서 상대 강도 지수(RSI)를 활용하는 거래자를 위해 특별히 설계된 강력한 알림 시스템입니다. 이 표시기는 빠른 RSI 라인이 느린 RSI 라인 위나 아래에서 교차할 때 발생하는 RSI 크로스오버를 식별하는 데 중점을 둡니다. 이러한 교차를 결합함으로써 지표는 잘못된 신호를 효과적으로 필터링하여 거래자가 보다 정확한 거래 결정을 내릴 수 있도록 합니다. RSI Crossover Alert는 기능과 유용성을 향상시키는 몇 가지 주요 기능을 제공합니다. 모든 시간대 및 거래 기호에 적용하기에 적합하여 거래자에게 거래 방식에 유연성을 제공합니다. 또한 이 지표는 사용자 친화적인 매개변수를 자랑하므로 거래자가 선호도 및 거래 전략에 따라 설정을 쉽게 사용자 정의할 수 있습니다. 또한 지표는 차트에서 이전 신호를 그릴 수 있으므로 거래자가 과거 교차 패턴을 분석할 수 있습니다. 거래자가 중요한 거래 기회를 절대 놓치지 않도록 하기 위해 RSI 교차

30$에서 5/10 복사 ---> 다음 50$ // MT4 버전
외환 활력은 8가지 주요 통화(EUR, GBP, AUD, NZD, USD, CAD, CHF, JPY)의 모멘텀 강도를 평가하는 기술 지표입니다. 이 지표는 28개 통화쌍 간의 상관관계 부족을 측정하는 수학적 계산에 의존합니다. 값을 계산하기 위해 선형 가중 평균법(LWMA)과 모델에서 유의성이 없는 값을 제거하는 통계 시스템을 사용하여 종가 간의 백분율 차이를 분석합니다. 이 방법은 최근 가격 변동에 더 큰 의미를 부여하는 가중 평균을 제공합니다. 이 백분율 차이를 고려하면 이 지표는 통화 모멘텀의 강도와 방향을 측정할 수 있습니다.
주요 통화의 모멘텀 강도를 평가하고 시장 역학에 대한 귀중한 통찰력을 제공하는 이 지표는 트레이더가 잠재적 거래 기회를 파악하고 정보에 입각한 거래 결정을 내리고 리스크를 효과적으로 관리하는 데 도움이 될 수 있습니다. 특징 다시 칠하지 않음 이 표시기는 새 데이터가 도착해도

The Engulf Seeker indicator is a powerful tool designed to detect engulfing candlestick patterns with precision and reliability. Built on advanced logic and customizable parameters, it offers traders valuable insights into market trends and potential reversal points.
Key Features and Benefits: Utilizes revised logic to analyze previous candles and identify strong bullish and bearish engulfing patterns. Convenient arrow-based alert system notifies traders of pattern occurrences on specific symb

Master the market: harness the power of statistical arbitrage
This indicator showcases the price action of multiple instruments on a single chart, enabling you to compare the fluctuations of different assets and seamlessly implement statistical arbitrage strategies. Its main usage is to find correlated symbols which are temporarily out of whack.
[ Installation Guide | Update Guide | Troubleshooting | FAQ | All Products ] Find overbought or oversold currency pairs easily Plot up to six curre

표시기는 두 부분으로 구성됩니다. 1부: 색상 양초가 주요 추세를 보여줍니다. 컬러 캔들(Color Candles)은 컬러 캔들스틱으로 시장 상태를 파악하는 것입니다. 스크린샷에서 보듯이, 색상이 아쿠아(Aqua)라면 시장은 매수 주문을 해야 하거나 매도 주문을 종료해야 하는 상태입니다. 색상이 토마토라면 짧은 주문을 하거나 긴 주문을 종료할 때입니다. 색상이 변경되는 경우 완료될 때까지 기다리는 것이 좋습니다(현재 막대가 닫힐 때까지). 파트 II: 밴드 그리기 안쪽 밴드는 안전 구역으로 정의되고, 바깥쪽 밴드는 마감 주문용으로 정의됩니다. 아래와 같은 거래 전략: 색상이 아쿠아이고 가격이 내부 밴드에 있는 경우 장기 주문을 하고, 가격이 외부 밴드를 넘으면 주문을 마감할 시간입니다. 색상이 토마토이고 가격이 안쪽 밴드에 있으면 짧은 주문을 하고, 가격이 바깥쪽 밴드를 넘으면 주문을 마감할 시간입니다. 참고 : 가격이 내부 밴드에 있을 때 진입 시장에만 해당됩니다. 이는 매우

Ultimate Trend Finder (Multi Pair And Multi Time Frame) : ---LIMITED TIME OFFER: NEXT 25 CLIENTS ONLY ---46% OFF REGULAR PRICE AND 2 FREE BONUSES ---SEE BELOW FOR FULL DETAILS Institutional traders use moving averages more than any other indicator. As moving averages offer a quick
and clear indication of the institutional order flow. And serve as a critical component in the decision making
within numerous institutional trading rooms.
Viewing the market through the same lens as the i

Ultimate Reversal Scanner (Multi Pair And Multi Time Frame) : ---LIMITED TIME OFFER: NEXT 25 CLIENTS ONLY ---46% OFF REGULAR PRICE AND 2 FREE BONUSES ---SEE BELOW FOR FULL DETAILS Reversal patterns are some of the most widely used setups in the institutional trading world.
And the most (statistically) accurate pattern of them all is called the ' Three Line Strike '. According to Thomas Bulkowski ( best selling author and a leading expert on candlestick patterns ),
the ' Three Line Strike '

Ultimate Engulfing Bar Scanner (Multi Pair And Multi Time Frame) : ---LIMITED TIME OFFER: NEXT 25 CLIENTS ONLY ---46% OFF REGULAR PRICE AND 2 FREE BONUSES ---SEE BELOW FOR FULL DETAILS Nothing is more important than institutional price action and order flow.
And a strong engulfing candle is a clear indication that the institutions have flipped their sentiment.
Engulfing bar patterns are widely used by institutional traders around the world. As they allow you to manage
your trades withi

Ultimate Pinbar Scanner (Multi Pair And Multi Time Frame) : ---LIMITED TIME OFFER: NEXT 25 CLIENTS ONLY ---46% OFF REGULAR PRICE AND 2 FREE BONUSES ---SEE BELOW FOR FULL DETAILS A strong pinbar is clear evidence that the institutions are rejecting a particular price level.
And the more well defined the pinbar, the higher the probability that the institutions will
soon be taking prices in the opposite direction.
Pinbar patterns are widely used by institutional traders around the world.

[DESCRIPTION] The Entry Point indicator shows up/down arrows as an entry point for buy/sell. The signal based on EMA, MACD and Price Action. A Red arrow means it is a good opportunity to Sell. A Green arrow means it is a good opportunity to Buy. [MAIN FEATURES] A Red arrow means it is a good opportunity to Sell. A Green arrow means it is a good opportunity to Buy. Easy to use and manage. The indicator is very simple and intuitive even for beginners. Works with any trading symbols: Forex pairs,
Schaff trend RSI indicator (It is related with EMA and RSI) It is suited for sub-Indicator to undertand trend(or direction change)
As you can see the screenshot, it's good with Nagaraya-Watson Envelope Indicator (or others) I am using this indicator as Screenshot setting. (Schaff value is default value. 23, 50, 9, close) If you want to get Nagaraya-Watson Envelope, Link: https://www.mql5.com/ko/market/product/97965

Xtreme TrendLine is an advanced powerful trend indicator. This indicator is based on candles analysis and trend channels. It can be used on any trading pair or instrument on any time-frame. This indicator is accessible in EA via iCustom functions and is fully customizable by user.
Features Any trading instrument Any timeframe Fully customizable by user More Trendlines on one chart Can be used in EA via iCustom function Can be use on more timeframe at once to catch best moment for the trade ent

The indicator combines the features of both the Tick charts and Volume Bar charts. The mode can be selected in the indicator's settings.
Tick charts measure the number of transactions per bar. To give you an example if you have a 233 tick chart, each bar measures 233 transactions per bar and a new bar is plotted after 233 transactions. You can choose any number of ticks per bar but most traders choose Fibonacci numbers (1, 2, 3, 5, 8, 13, 21, 34, 55, 89, 144, 233...). Volume bar charts are desi

이것은 두 번째 형식의 눈금 차트입니다. OpenCL에 대한 지원이 있습니다. 설정은 매우 간단합니다. 표시기가 계산될 요일을 선택할 수 있습니다. 예를 들어 주말에 시세가 업데이트되지 않는 금융 상품의 경우 6일과 7일에 다른 요일을 선택해야 하지만, 예를 들어 비트코인의 경우 브로커가 시세를 업데이트하면 다음을 수행할 수 있습니다. 6일째는 토요일, 7일째는 일요일로 지정합니다. 원하는 경우 색상을 사용자 정의할 수도 있습니다. 이것은 적응적이고 부드러운 컬러 라인입니다. 이 표시기는 전략 테스터에서 작동하지 않습니다. 구매하기 전에 비디오를 시청하십시오. ////////////////////////////////////////////////////// / ////////////////////////////////////// 이 지표가 성공적인 거래에 매우 유용하기를 바랍니다.
행운을 빕니다.
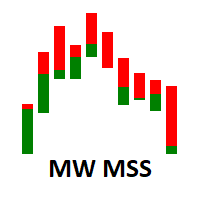
The Martinware Market Sides' Strength indicator shows the candlestick chart in a different manner allowing for a clearer view of which side, bullish or bearish is dominating the asset in the current period. As a bonus, it can also show an internal area that can be used to visualize two levels of Fibonacci retracements inside the bars.
The default configuration shows the MSS bars with 4 main colors, two representing the bullish force, and two representing the bearish one. The primary colors a

The Breakout Box for MT5 is a (opening) range breakout Indicator with freely adjustable: - time ranges - end of drawing time - take profit levels by percent of the range size - colors - font sizes It can not only display the range of the current day, but also for any number of days past. It can be used for any instrument. It displays the range size and by request the range levels and the levels of the take profit niveaus too. By request it shows a countdown with time to finish range. The indic
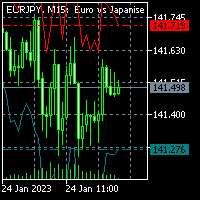
For MT4 version please click here . This is the exact conversion from TradingView: "Average True Range Stop Loss Finder" By "veryfid". - This indicator implements a deviation channel. - The channel determines trend direction as well as stop loss placement. - This is a non-repaint and light processing load indicator. - You can message in private chat for further changes you need.

- This is the exact conversion from TradingView: "Support/Resistance" By "BarsStallone". - This indicator lets you read the buffers for R/S values. - This is a non-repaint and light processing load indicator. - This is not a multi time frame indicator If you want the multi time frame version you should create a personal order and I deliver two files that you need them both to have the multi time frame indicator running on your system. - The MT4 version of the indicator is not light load from pr

The indicator illustrates the divergence between the price movements of two financial instruments, such as EURUSD and GBPUSD or US500 and US30 or Gold and Silver. These divergences are plotted in the form of segments on the price chart of the dominant instrument. The dominant instrument refers to the one that exhibits a stronger bullish trend in the case of a bullish divergence, or a stronger bearish trend in the case of a bearish divergence. Investors are encouraged to independently seek correl
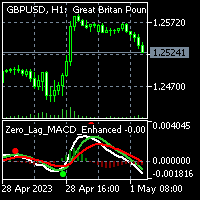
To get access to MT4 version please click here . This is the exact conversion from TradingView: "Zero Lag MACD Enhanced - Version 1.2" by " Albert.Callisto ". This is a light-load processing and non-repaint indicator. All input options are available. Buffers are available for processing in EAs. You can message in private chat for further changes you need. Thanks
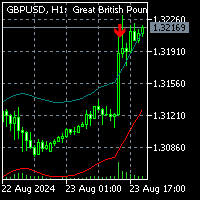
To get access to MT4 version click here . This is the exact conversion from "Nadaraya-Watson Envelope" by " LuxAlgo ". (with non-repaint input option) This is not a light-load processing indicator if repaint input is set to true . All input options are available. Buffers are available for processing in EAs. I changed default input setup to non-repaint mode for better performance required for mql market validation procedure . Here is the source code of a simple Expert Advisor operating based on

To get access to MT4 version please click here . This is the exact conversion from TradingView: "[SHK] Schaff Trend Cycle (STC)" by "shayankm". This is a light-load processing indicator. This is a non-repaint indicator. Buffers are available for processing in EAs. All input fields are available. You can message in private chat for further changes you need. Thanks for downloading

Point and Plot: The Anchored VWAP with Channel Bands tool is designed for traders of all levels, from beginners to seasoned professionals. Point to the price level you want to anchor to, plot the horizontal line, and watch as this versatile tool transforms your trading approach. User-Friendly Interface : Navigate the tool effortlessly with a user-friendly interface that ensures you never miss a crucial detail. Real-Time Analysis : Make informed decisions in real time with dynamic data that upda

Introducing our groundbreaking indicator designed to elevate your trading strategy! Unlock the power of precise volume analysis with Buy, Sell, and Neutral indicators. Tailor your approach with customizable levels based on timeframes and moving average methods.
Key Features: Dynamic Volume Insights Instantly identify Buy, Sell, and Neutral volumes for informed trading decisions. Gain clarity on market sentiment like never before. Adaptable Level Configuration Customize and adapt levels to matc

Percentage Price Oscillator (PPO) for MT5 Unlock deeper market insights with the Percentage Price Oscillator (PPO) for MT5 – a dynamic tool designed to measure price momentum and trend direction with precision. Core Features: Flexible Configuration : Customize the PPO to match your trading approach by adjusting the Fast Length, Slow Length, and Signal Length. The indicator is also versatile enough to adapt to any market condition with various source inputs. Intuitive Histogram Display : Choose t

Symbol Changer this Indicator for make more easy when change Chart pair, this more usefull if trader make deal with many pair.
Property Input Indicator Custom Unique ID : Indicator have Id for make different. Show Profit Loss : Adjustable for Show or no Profit and Loss Option Horizontal/Vertical button : Button can change Horizontal or Vertical. Option Window : Adjustable in main Chart as window or buttom chart as Window 1, 2 Main Pairs Preset / Own Pair : available group pair for make easy ha

The order block locator is powered by three main search algorithms thar can be used to find order blocks. Simple Fractal Search Algorithm Naive Fractal Movers Algorithm
Candle Transition Algorithm You can even combine the power of your 2 favourite algorithms and get the best of both worlds: Mixed Algorithm (Naive Fractal + Candle transition) Mixed Algorithm (Simple Fractal + Candle Transition
Simple Fractal Search Algorithm
The algorithm finds the fractals based on your setting paramers fo

The "No Reversal Accumatrix AI" is a cutting-edge MetaTrader 5 indicator designed to assist traders in confirming trends without the inconvenience of repainting. Built upon advanced artificial intelligence algorithms, this indicator offers a reliable tool for identifying and validating trends in financial markets. Key Features: Non-Repainting Technology : Unlike traditional indicators prone to repainting, the "No Reversal Accumatrix AI" utilizes innovative algorithms to provide accurate trend co

Cointegration Pair Trading Indicator
Indicator for statistical and quantitative pair trading strategies. You can perform Long&Short or Long&Long/Short&Short between two different assets.
The indicator performs a series of statistical tests between the assets and shows whether the pair is cointegrated or not.
Suggested Usage Strategies
(a) Verify if that the pair is cointegrated by the ADF test (Augmented Dickey-Fuller Test). 0% means the pair is not cointegrated; 90% 95% 97.5% and 99% means

볼륨 가중 평균 가격 지표는 MT5의 메인 차트 창에 표시되는 라인 스터디 지표입니다. 이 표시기는 일반적인 가격을 모니터링한 다음 표시기 라인을 거래량이 많은 가격으로 자동 푸시하는 데 사용되는 거래량을 모니터링합니다. 이 가격은 가장 많은 계약(또는 랏)이 거래된 곳입니다. 그런 다음 이러한 가중 가격은 되돌아보는 기간 동안 평균화되고 지표는 푸시된 가격에서 라인 연구를 보여줍니다.
이 게시물의 지표를 통해 트레이더는 해당 룩백 기간의 일일 시작 시간을 설정할 수 있습니다. 이 표시기는 자동으로 5개의 일일 룩백 기간(현재 형성 기간 및 동일한 시작 시간을 기준으로 이전 4일)을 표시합니다. 이러한 이유로 이 지표는 일중 거래에만 사용됩니다. 표시기는 해당 날짜의 수직 일일 시작 시간 구분선도 자동으로 표시합니다. 일반적인 가격과 거래량은 하루 종일 누적되며 하루 종일 처리됩니다.
중요 업데이트: 이 지표의 v102를 사용하면 VWAP 및 밴드의 시작을 가장 최근의 주요

이동 평균(MA) 지표의 다중 통화 및 다중 시간대 수정. 대시보드에서는 지표의 현재 상태를 확인할 수 있습니다. 즉, Fast MA와 Slow MA의 돌파 및 터치(가격별)는 물론 서로 MA 선의 교차점(이동 평균 교차)도 볼 수 있습니다. 매개변수에서 원하는 통화와 기간을 지정할 수 있습니다. 또한 표시기는 선에 닿는 가격과 선의 교차에 대한 알림을 보낼 수 있습니다. 마침표가 있는 셀을 클릭하면 해당 기호와 마침표가 열립니다. MTF 스캐너입니다. 차트에서 여러 대시보드를 실행할 수 있습니다.
표시기는 현재 차트에 빠른 MA 및 느린 MA 선을 표시합니다. 차트의 MA 기간을 선택하고 다른 기간(MTF MA)의 MA를 볼 수 있습니다. MA의 두 세트에 대한 단축키는 기본적으로 "1"과 "2"입니다.
차트에서 대시보드를 숨기는 키는 기본적으로 "D"입니다.
매개변수 Fast MA Averaging period — 평균화 기간. Shift — 옮기다. Averag

Here’s the problem: the default zigzag indicator given in MT5 trading platform does not really capture the most of the highs and lows on chart do draw zigzags. On chart below, notice that some of ther high, low of price have been missed to draw zigzags by this default zigzag indicator (picture 1). It is not so apparent until you compare default zigzag indicator to this SwingZZ indicator. Have a look on picture 2 and 3. The swing zigzag indicator is best because it captures most of the swing high
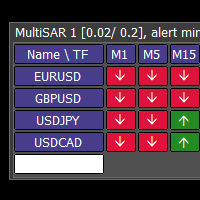
This tool monitors Parabolic SAR indicators on all time frames in the selected markets. Displays a table with signals to open a BUY trade (green) or SELL trade (red). You can easily add or delete market names / symbols. If the conditions for opening a trade on multiple time frames are met, you can be notified by e-mail or phone message (according to the settings in MT5 menu Tools - Options…) You can also set the conditions for sending notifications. The list of symbols/ markets you have entered
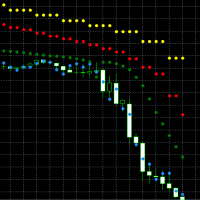
This indicator is based on the classical indicator Parabolic SAR. You can observe up to 4 different timeframes. All MT5 TimeFrames are supported. It's possible to use lower or higher timeframes than the current chart timeframe. Input Parameters: For each of the 4 Timeframes you can configure: The specific Period ( ENUM_TIMEFRAMES ) The usage of the PSAR Value ("visible and relevant for the signal", "visible and not relevant for the signal" or "invisible and not relevant for the signal (ign

** All Symbols x All Timeframes scan just by pressing scanner button ** *** Contact me to send you instruction and add you in "Head & Shoulders Scanner group" for sharing or seeing experiences with other users. Introduction: Head and Shoulders Pattern is a very repetitive common type of price reversal patterns. The pattern appears on all time frames and can be used by all types of traders and investors. The Head and Shoulders Scanner indicator Scans All charts just by pressing

Weis Wave Box로 분석을 한 단계 끌어올리세요! 정확성과 명확성을 추구하는 트레이더라면, Weis Wave Box 가 필요한 도구입니다. 이 고급 지표는 볼륨 파동과 스윙 포인트에 대한 상세한 시각적 분석을 제공하여 시장에서 노력과 결과 간의 관계를 더 잘 이해하는 데 도움을 줍니다. Weis Wave Box의 주요 기능: 사용자 맞춤형 볼륨 파동: 거래 전략에 맞게 티크 단위로 볼륨 파동을 조정할 수 있습니다. 조정 가능한 이력: 특정 시간 기간에 초점을 맞춰 더 정확하고 관련성 있는 분석을 수행할 수 있습니다. 티크 vs. 실제 볼륨: 티크와 실제 볼륨을 명확히 구분하여 시장에 대한 더 포괄적인 시각을 제공합니다. 상단 박스 시각화: 볼륨(에너지)이 가장 높은 곳과 가격 이동이 적었던 곳을 명확히 시각화합니다. 이 시각화는 노력과 결과 간의 관계를 파악하는 데 도움이 되며, 어떤 힘이 지배적인지 강조하고 잠재적인 가격 변동을 예측할 수 있습

Phi Cubic Fractals Pack1A with FuTuRe PACK 1A é uma melhoria sobre o Pack 1 que inclui a possibilidade de selecionar as linhas LINE 4/8/17/34/72/144/305/610 individualmente. Este produto contém os indicadores do PACK 1A (Lines + LineSAR + Channels + BTL + Ladder) + MODO FUTURO Phi Lines - medias moveis especiais, semelhantes às MIMAs do Phicube, capazes de indicar com muita clareza tanto a tendencia como a consolidação; Phi LineSAR - apaga ou destaca as Phi Lines para mostrar apenas as linha

볼륨 및 마켓프로필 프로 설명: MarketProfile 인디케이터는 다양한 가격 수준에서의 거래량에 대한 정확하고 상세한 분석을 제공합니다. 각 거래일의 거래량 프로파일을 계산하여 표시함으로써, 시장 구조와 거래량 분포를 이해하여 정보에 입각한 거래 결정을 내릴 수 있도록 도와줍니다. 주요 특징: 일일 거래량 분석: 인디케이터는 각 거래일의 거래량 프로파일을 계산하여 표시하므로, 다양한 가격 수준에서의 거래량 분포를 쉽게 파악할 수 있습니다. 포인트 오브 컨트롤 (POC): POC는 당일 가장 많은 거래량이 발생한 가격 수준을 나타내는 수평선으로 표시되어, 중요한 지지 및 저항 수준을 파악하는 데 도움을 줍니다. 밸류 에어리어 하이 (VAH) 및 밸류 에어리어 로우 (VAL): 이 선들은 70%의 거래량이 발생하는 밸류 에어리어의 상한선과 하한선을 표시합니다. 이러한 정보는 시장 활동과 잠재적인 가격 반전 지점을 이해하는 데 중요합니다. 세션별 색상: 인디케이터는 아시아, 유럽,
Enhance Your Trading Strategies with the "Order Block" Indicator for MT4 Discover the "Order Block" Indicator: The "Order Block" Indicator for MT4 is designed to help you precisely identify order blocks in the market by marking the highs and lows of the order block candles. This powerful tool enables you to understand where large institutions place their orders, improving your ability to predict market movements. Key Features: Precise Order Block Detection: Automatically highlights the highs and
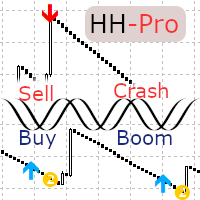
Finally, Harmonic Hybrid Pro is now available with numerous new features. It is highly recommended for utilization with Boom and Crash Synthetics. This tool generates a maximum of two orders per session and is designed to provide buy and sell signals in line with the current trend, effectively filtering out any superfluous signals. Users can optimize settings in the input section of the indicator properties. While the default configuration is suitable for Boon 500, adjustments may be necessary f

BestPointOfInitiation是一个很好的短线交易指示器,能与 ShortBS ( https://www.mql5.com/zh/market/product/96796 )完美的配合,可以很好的指出最佳的buy和sell位置,指标不含有未来函数,不会重新绘制,不仅能够应用到自己的手动交易过程中,还能完全可以写入到自己的EA中。(如果你感觉到这个指标能够帮助你进行更准确的交易,请帮忙给个好评,希望我的作品能够帮助更多多有需要的人) ===================参数列表===================== fastPeriod: 9 slowPeriod:30 PassivationCoefficient:5 =================参考使用方法=================== 此指标可以适用于任何交易品种,能够用在任何周期。
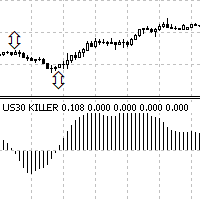
Us30 killer non repaint non repaint (means that the arrows that appear on the chart will not disappear or redraw). Us30 killer consists of 2 black arrows and a histogram. if black arrow appears above the current price look for selling opportunities ( See figure 3) if black arrow appears below current price look for buying opportunities. (See figure 3) The indicator works on all timeframes recommended is M5 TO Monthly Timeframe.

HEIKEN PLUS is the only indicator you really need to be a successful trader , without in depth knowledge of the forex trading or any tools.
Also there is automatically trading EA available now: https://www.mql5.com/en/market/product/89517? with superb SL/TP management! and sky high profit targets !!!
Very suitable tool for new traders or advanced traders too. This is MT5 version. For MT4 version visit : https://www.mql5.com/en/market/product/85235?source=Site
HEIKEN+ is a combination o
MetaTrader 마켓은 과거 데이터를 이용한 테스트 및 최적화를 위해 무료 데모 거래 로봇을 다운로드할 수 있는 유일한 스토어입니다.
어플리케이션의 개요와 다른 고객의 리뷰를 읽어보시고 터미널에 바로 다운로드하신 다음 구매 전 트레이딩 로봇을 테스트해보시기 바랍니다. 오직 MetaTrader 마켓에서만 무료로 애플리케이션을 테스트할 수 있습니다.
트레이딩 기회를 놓치고 있어요:
- 무료 트레이딩 앱
- 복사용 8,000 이상의 시그널
- 금융 시장 개척을 위한 경제 뉴스
등록
로그인
계정이 없으시면, 가입하십시오
MQL5.com 웹사이트에 로그인을 하기 위해 쿠키를 허용하십시오.
브라우저에서 필요한 설정을 활성화하시지 않으면, 로그인할 수 없습니다.