Indicadores técnicos de pago para MetaTrader 5 - 6
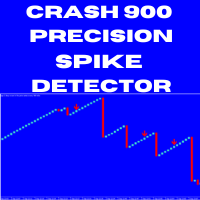
Crash 900 Precision Spike Detector The Crash 900 Precision Spike Detector is your ultimate tool for trading the Crash 900 market with precision and confidence. Equipped with advanced features, this indicator helps you identify potential sell opportunities and reversals, making it an essential tool for traders aiming to capture spikes with minimal effort. Key Features: Non-Repainting Signals: Accurate, non-repainting signals that you can trust for reliable trading decisions. Audible Alerts: Stay
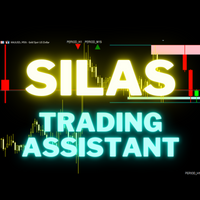
Silas is a trading assistant for multi-timeframes traders. It show on the screen, in a very clear way, all the informations needed to suits to your trading. It show : - Supply and demand zone from 2 timeframes of your choice - Setups based of market structure from 2 timeframes of your choice - Daily current high and low points - The last 2 closed candles and the current candle from an higher time frame on the right of the graph. - Actual daily candle on the left Everything is customisable !

HighQualityMap是一个很好的中长线交易指示器,这个指标可以单独使用,尤其是用在M30或者大于M30的时间框架下,它能很好的体现出趋势的走向,以及转折点,你可以很快的从这个指示器上寻找到最佳的buy和sell位置,同时也能很好根据指示器去坚守自己的持仓定订单。指标不含有未来函数,不会重新绘制,不仅能够应用到自己的手动交易过程中,还能完全可以写入到自己的EA中。(如果你感觉到这个指标能够帮助你进行更准确的交易,请帮忙给个好评,希望我的作品能够帮助更多有需要的人) ===================参数列表===================== 所有参数均采用默认参数即可,无需更改,若为激进型交易者,可以根据自己的需要来调整参数。 =================参考使用方法=================== 此指标可以适用于任何交易品种,使用周期框架大于M30相对更准确。

StartPoint是一个很好的短线交易指示器,这个指标可以单独使用,但是最好是配合 HighQualityMap 一起使用,适用于任何时间框架,喜欢超短线的朋友可以使用M5时间框架。它能很好的体现出短期趋势的启动点,你可以很快的从这个指示器上寻找到最佳的buy和sell位置,同时也能很好根据指示器去坚守自己的持仓定订单。指标不含有未来函数,不会重新绘制,不仅能够应用到自己的手动交易过程中,还能完全可以写入到自己的EA中。(如果你感觉到这个指标能够帮助你进行更准确的交易,请帮忙给个好评,希望我的作品能够帮助更多有需要的人) ===================参数列表===================== 所有参数均采用默认参数即可,无需更改,若为激进型交易者,可以根据自己的需要来调整参数。 =================参考使用方法=================== 此指标可以适用于任何交易品种。

The Market Structure Analyzer is a powerful tool designed for traders who follow market structure and smart money concepts. This comprehensive indicator provides a suite of features to assist in identifying key market levels, potential entry points, and areas of liquidity. Here's what it offers:
1. Swing High/Low Detection : Accurately identifies and marks swing highs and lows, providing a clear view of market structure.
2. Dynamic Supply and Demand Zones: Draws precise supply and demand zo

The indicator displays a matrix of indicators across multiple timeframes with a sum total and optional alert. Custom indicators can also be added to the matrix, in a highly configurable way. The alert threshold can be set to say what percentage of indicators need to be in agreement for an alert to happen. The alerts can turned on/off via on chart tick boxes and can be set to notify to mobile or sent to email, in addition to pop-up. The product offers a great way to create an alert when multiple
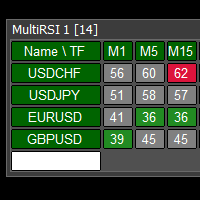
This tool monitors RSI indicators on all time frames in the selected markets. Displays a table with signals to open a BUY trade (green) or SELL trade (red). You can set the conditions for the signal. You can easily add or delete market names / symbols. If the conditions for opening a trade on multiple time frames are met, you can be notified by e-mail or phone message (according to the settings in MT5 menu Tools - Options…) You can also set the conditions for sending notifications. The list of s

This tool monitors MACD indicators on all time frames in the selected markets. Displays a table with signals to open a BUY trade (green) or SELL trade (red). You can set the conditions for the signal. You can easily add or delete market names / symbols. If the conditions for opening a trade on multiple time frames are met, you can be notified by e-mail or phone message (according to the settings in MT5 menu Tools - Options…) You can also set the conditions for sending notifications. The list of

Nadaraya-Watson Envelope Indicator convert to MT5 Nadaraya Watson Envelope Indicator is one of the monst popular indicator in TradingView. TradingView(Chrome, Edge) eats a huge of CPU, so I convert this to MT5 version.
As you can see the screenshot, it's good with Schaff trend RSI Indicator (or others) If you want to get Schaff trend RSI Indicator , Link: https://www.mql5.com/en/market/product/98011
Window Size - determines the window size for calculating smoothed values. A larger window

Indicador financiero SolarTrade Suite: Indicador del mercado de mercurio: ¡su guía confiable en el mundo de los mercados financieros! Nuestro programa de trading de Forex está equipado con una potente inteligencia artificial que analiza los datos del mercado en tiempo real. Predice con precisión los movimientos de precios, ayudando a los traders a tomar decisiones informadas. Con algoritmos avanzados, nuestro indicador optimiza las estrategias y minimiza los riesgos. Es una media móvil que util

Indicador Tendencia en Volatilidad de Índices.
Características principales:
Sirve solo para Índices Sintéticos en el broker Binary o Deriv que son lo mismo. Tiene Filtro de tendencia. Posee Alerta Sonora para avisar sobre un posible retroceso del precio. Puede enviarte alertas al móvil si lo colocas en un VPS. Esta configurado con el algoritmo L566b12 el cual esta diseñado para una mejor eficiencia.
Como Usar el indicador.
Se trabaja en temporalidad de M1. La tendencia debe ser fuert

Certainly. Here's the explanation in English: This program is a custom indicator that calculates the MACD (Moving Average Convergence Divergence) and shows the crossovers between the MACD and Signal lines. Here are the main functions of the program: MACD Calculation: Calculates the difference between the Fast EMA (Exponential Moving Average) and Slow EMA. This difference forms the MACD line. Signal Line Calculation: Creates the Signal line by taking a simple moving average (SMA) of the MACD valu

Descripción del Indicador de Zonas de Desequilibrio FVG El Indicador de Zonas de Desequilibrio FVG es una poderosa herramienta diseñada para identificar posibles desequilibrios de precios en los gráficos financieros. Desarrollado por Pierre-Alexis Blond, este innovador indicador marca las áreas donde la oferta y la demanda pueden divergir significativamente, proporcionando a los traders información valiosa sobre posibles puntos de reversión en el mercado. Características principales: Detección d

This indicator can identify more than 60 candlestick patterns on the chart, including their bullish and bearish variants. Just choose the pattern you want in the settings.
Available Patterns 2 Crows Gravestone Doji On Neck 3 Black Crows Hammer Piercing 3 Inside Hanging Man Rick Shawman 3 Line Strike Harami Rising and Falling Three Method 3 Outside Harami Cross Separating Lines 3 Stars in South High Wave Shooting Star 3 White Soldiers Hikkake Short Line Abandoned Baby Hikkake Modified Spinning

Agregue este indicador al gráfico y establezca la configuración ExtDepth de ZigZag
Da una alerta instantánea cuando el precio toca la línea de tendencia del canal superior, inferior o medio
Características :
-Habilitar/Deshabilitar alertas en línea superior, inferior o media - Agregar pausa después de una alerta en segundos - Pausar o reanudar el canal de tendencia con un botón en el gráfico - Agregue alertas tempranas agregando puntos en el campo de entrada, por ejemplo, el precio ETH es

MULTI TIME FRAME MOVING AVERAGE OSW (METATRADER 5) Este indicador te permitirá agregar medias móviles de todos los tipos de configuración, con la diferencia que si estas en una temporalidad, puedes agregar la de un nivel superior, para dar un ejemplo, si estas en temporalidad de 5 minutos y quieres ver la media móvil exponencial de 20 de temporalidad de 15 minutos, 1 hora y 4 horas, solo con configurar los parámetros correctos en el menú del indicador podrás verlas como se muestra en las imágene
El indicador se utiliza para el auge comercial y Crash, es un superdetective de tendencias. Cuando el mercado tenga una tendencia alcista, utilice la señal fuerte para capturar el pico, cuando esté en una tendencia bajista, use la señal normal para capturar más picos.
El indicador es una base de acción del precio por naturaleza con algunas lógicas matemáticas. Se usa solo para atrapar picos.
El indicador posee la siguiente salida
1. Señal fuerte
2. Señal regular
3. Alerta por correo e

Este indicador rastrea eficientemente cualquier otra vela temporal que desee rastrear en el mismo gráfico.
1. Seleccione cualquier período de tiempo superior para cargar barras en el mismo gráfico.
2. Personaliza los colores y el estilo de los candelabros.
3. Elige el número de barras para dibujar velas.
4. Realice un seguimiento de las velas completas con períodos de tiempo más altos junto con la mecha y el cuerpo.
5. Fácil y conveniente para aquellos que no quieren cambiar de gr

Indicador financiero SolarTrade Suite: Indicador de mercado de Plutón: ¡su guía confiable en el mundo de los mercados financieros!
Es un oscilador de volatilidad que utiliza algoritmos especiales innovadores y avanzados para calcular su valor y también tiene un diseño atractivo.
Es muy sencillo entender las lecturas de este indicador: color verde: baja volatilidad y el mejor momento para abrir un acuerdo comercial, color naranja: alta volatilidad y tiempo para pensar en cerrar una posición

Il s'agit d'un indicateur personnalisé basé sur l'évolution des prix en chandeliers. Il génère des alertes pour les signaux d'achat ou de vente sur n'importe quel instrument de trading. Il existe du matériel explicatif disponible pour les techniques de validation des signaux, d’entrée et de sortie. Pour en savoir plus, recherchez Benjc Trade Advisor sur YouTube pour des vidéos explicatives.
La dernière version comprend des filtres de tendance et d'oscillateur pour améliorer la précision du si

Estilo visual de bandas VWAP 1.0 Los indicadores del mercado financiero son herramientas esenciales utilizadas por los comerciantes e inversores para analizar y tomar decisiones en los mercados financieros. VWAP y las Bandas de Bollinger son dos herramientas populares de análisis técnico utilizadas por los comerciantes para medir las tendencias del mercado y la volatilidad de los precios. En este producto, proponemos combinar los dos indicadores para crear un producto único que proporcione un a

The Rubdfx swing indicator is a useful tool for traders looking to identify trend changes in a particular instrument they are trading. It is designed to draw a line on the main chart, and the signals are indicated by color changes with signal alerts. The color green is used to indicate a bullish trend, while the color pink is used to indicate a bearish trend. These colors can be customized to fit the trader's preferences or theme. The Rubdfx swing indicator has the ability to spot both long-te
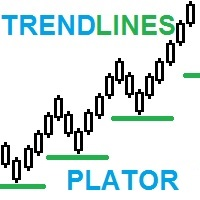
TrendPlator: Un Potente Indicador de Proyección de Tendencias para Estrategias de Trading Optimizadas ¡Descubre el poder de nuestro nuevo indicador! Con la capacidad de calcular líneas de tendencia de marcos temporales más amplios y proyectarlas directamente en tu marco temporal actual, proporciona un soporte estratégico que llama la atención de todos los traders. Estos puntos se convierten en poderosos niveles de soporte o resistencia para tus operaciones, impulsando tu estrategia de trading. I

The DR IDR Range Indicator PRO plots ADR, ODR and RDR ranges for a given amount of days in the past. A key feature that appears is that it calculates the success rate of the ranges for the shown days. This indicator is perfect for backtest since it shows ranges for all of the calculated days, not just the most recent sessions. In the PRO version you can now: use fully customizable advanced statistics to base your trades on get an edge via calculating statistics on up to 3 different day period

Este indicador de múltiples marcos de tiempo y múltiples símbolos alerta sobre los cambios de color de Heiken Ashi Smoothed. Como beneficio adicional, también puede buscar cambios de color (tendencia) en la media móvil del casco. Combinado con sus propias reglas y técnicas, este indicador le permitirá crear (o mejorar) su propio sistema poderoso. Características
Puede monitorear todos los símbolos visibles en su ventana Market Watch al mismo tiempo. Aplique el indicador a un solo gráfico y mon

Este indicador de marco de tiempo múltiple y símbolo múltiple identifica cuándo la línea de señal estocástica cruza la línea principal estocástica. Como alternativa, también puede alertar cuando el estocástico está saliendo (sin que la línea de señal cruce la línea principal) de un área de sobrecompra/sobreventa. Como beneficio adicional, también puede buscar bandas de Bollinger y cruces de sobrecompra/sobreventa RSI. Combinado con sus propias reglas y técnicas, este indicador le permitirá crear

Due to Technical and Logical manipulations by Brokerage, I have come a long way to bring this rear indicator that combines numerous strategies that have the following abilities: Market Trend Identification : Understand the overall trend of the market. Reversal Points : Identify potential points where the market may change direction. Entry and Exit Points : Determine optimal times to enter and exit trades. For a comprehensive understanding of how to use this indicator, please watch the accompanyi

¡Únase a operar con el indicador WolfeWaveBuilder! Esta es una herramienta única creada específicamente para obtener las decisiones de inversión más exitosas y rentables. Es ideal para cuentas reales y se beneficia de una estrategia comercial completamente probada y virtualmente garantizada. ¡No pierdas tu oportunidad! ¡Comience a ganar dinero operando con el indicador WolfeWaveBuilder!
Versión MT5 https://www.mql5.com/ru/market/product/8920
Características del indicador
Da señales

The Engulf Seeker indicator is a powerful tool designed to detect engulfing candlestick patterns with precision and reliability. Built on advanced logic and customizable parameters, it offers traders valuable insights into market trends and potential reversal points.
Key Features and Benefits: Utilizes revised logic to analyze previous candles and identify strong bullish and bearish engulfing patterns. Convenient arrow-based alert system notifies traders of pattern occurrences on specific symb

Además de encontrar formaciones de huelga de tres líneas alcistas y bajistas, este indicador de múltiples símbolos y marcos de tiempo mutli también puede buscar los siguientes patrones de velas (consulte las capturas de pantalla para obtener una explicación de los patrones): Tres soldados blancos (inversión> patrón de continuación) Tres cuervos negros (inversión> patrón de continuación) Las formaciones no aparecen con mucha frecuencia en períodos de tiempo más altos cuando la opción estricta en
Presentamos el Indicador iTrend: una herramienta de vanguardia diseñada para proporcionar información clara y confiable del mercado para traders de todos los niveles. Este indicador analiza eficientemente cada vela de forma individual, detectando el impulso alcista o bajista con una precisión sin igual, asegurando que te mantengas por delante de los movimientos del mercado sin ningún tipo de redibujado. Características clave: Señales precisas SIN REDIBUJADO: Una vez que se genera una señal, perm

El indicador de superposición de gráficos muestra la acción del precio de varios instrumentos en el mismo gráfico, lo que le permite evaluar qué tan diferentes fluctúan los pares de divisas entre sí. [ Guía de instalación | Guía de actualización | Solución de problemas | FAQ | Todos los productos ]
Encuentre pares de divisas sobrecomprados o sobrevendidos fácilmente Trace hasta seis pares de divisas superpuestos en el mismo gráfico Mostrar símbolos invertidos si es necesario Adaptarse al ta

Kill zones ICT es un potente indicador que le permitirá ver los mercados desde una mejor perspectiva. La herramienta de este indicador es mostrar en el gráfico uno de los factores más importantes del trading que es el tiempo. Con su sencilla interfaz podrá ver fácilmente cuáles son las horas con mayor volatilidad y movimiento así como las sesiones con menor actividad. ¿Cómo puedo utilizar este indicador para operar con conceptos TIC/Liquidez?
¿Qué se puede hacer con Kill Zones ICT?
Comp

Moving Average Scanner es un escáner de múltiples períodos de tiempo perfecto para ver la tendencia en varios períodos de tiempo de un vistazo sin cambiar el gráfico. Puede utilizar hasta 4 medias móviles de su elección en 9 unidades de tiempo. Es totalmente configurable y se puede mover a cualquier parte del gráfico simplemente "arrastrar y soltar". Las medias móviles se pueden configurar en 4 métodos de cálculo diferentes. También puede configurar alertas basadas en la cantidad de promedios mó

El indicador incluye dos partes. Parte I: Las velas de colores muestran la tendencia principal Las velas de colores sirven para identificar el estado del mercado mediante las velas de colores. Como se muestra en las capturas de pantalla, si el color es Aqua, el mercado se encuentra en un estado en el que se deben realizar órdenes largas o salir de órdenes cortas. Si el color es Tomate, es el momento de realizar pedidos cortos o salir de pedidos largos. Si el color cambia, es mejor esperar a que

Ultimate Trend Finder (Multi Pair And Multi Time Frame) : ---LIMITED TIME OFFER: NEXT 25 CLIENTS ONLY ---46% OFF REGULAR PRICE AND 2 FREE BONUSES ---SEE BELOW FOR FULL DETAILS Institutional traders use moving averages more than any other indicator. As moving averages offer a quick
and clear indication of the institutional order flow. And serve as a critical component in the decision making
within numerous institutional trading rooms.
Viewing the market through the same lens as the i

Ultimate Engulfing Bar Scanner (Multi Pair And Multi Time Frame) : ---LIMITED TIME OFFER: NEXT 25 CLIENTS ONLY ---46% OFF REGULAR PRICE AND 2 FREE BONUSES ---SEE BELOW FOR FULL DETAILS Nothing is more important than institutional price action and order flow.
And a strong engulfing candle is a clear indication that the institutions have flipped their sentiment.
Engulfing bar patterns are widely used by institutional traders around the world. As they allow you to manage
your trades withi
Schaff trend RSI indicator (It is related with EMA and RSI) It is suited for sub-Indicator to undertand trend(or direction change)
As you can see the screenshot, it's good with Nagaraya-Watson Envelope Indicator (or others) I am using this indicator as Screenshot setting. (Schaff value is default value. 23, 50, 9, close) If you want to get Nagaraya-Watson Envelope, Link: https://www.mql5.com/ko/market/product/97965

Este indicador / oscilador múltiple (en adelante indicador), marco de tiempo múltiple e indicador de símbolo múltiple identifica cuando ocurre una divergencia entre el precio y uno, dos o tres indicadores. Identifica divergencias tanto regulares / clásicas (inversión de tendencia) como ocultas (continuación de tendencia). Tiene opciones de filtro de tendencias RSI y MA que permiten filtrar solo las configuraciones más fuertes. Combinado con sus propias reglas y técnicas, este indicador le permit

Expert Market Edge is scalping, trending, reversal indicator, with alerts . You can use it all and fit with your strategy whatever it fits you. My recommendation is to combine with my Colored RSI , and when 2 signals are matched, and pointing same direction (for example buy on this indicator, and green on RSI, you can take a long position, stop loss should be last local low, if you want to be more conservative, add ATR. ) you can take position. If you using moving averages, that's even better i

LLega a ustedes el indicador que va a revolucionar el comercio con índices sintéticos CRASH en la plataforma de trading Deriv mt5.
God Spike Crash.
Características principales: Sirve solo en índices CRASH. Posee filtro de tendencia. Envía alertas solo cuando el mercado se encuentra la baja. Alertas sonoras. Puede enviar alertas al móvil.
Modo de uso: Aplicar en temporalidades de m1 y m5. Esperar la alerta sonora. Analizar que haya una fuerte tendencia o que ya haya empezado. No tomar al

The indicator combines the features of both the Tick charts and Volume Bar charts. The mode can be selected in the indicator's settings.
Tick charts measure the number of transactions per bar. To give you an example if you have a 233 tick chart, each bar measures 233 transactions per bar and a new bar is plotted after 233 transactions. You can choose any number of ticks per bar but most traders choose Fibonacci numbers (1, 2, 3, 5, 8, 13, 21, 34, 55, 89, 144, 233...). Volume bar charts are desi

Uses the built-in news calendar of the MT5 terminal or the Investing.com website (in the latter case, the Get news5 utility is required) Has the Scale parameter={100%, 110%, 125%, ...} to adjust the comfortable size of the text and control elements
Tells you in which direction it is safer to open positions 3 in 1: news + trends + news impact index
news for the selected period: current and in tabular form
actual trends for 5 customizable timeframes and trend reversal levels
forecast of exc
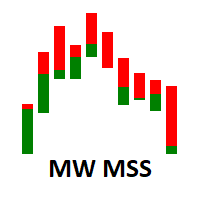
El indicador de fuerza de Martinware Market Sides muestra el gráfico de velas de una manera diferente, lo que permite una visión más clara de qué lado, alcista o bajista está dominando el activo en el período actual. Como beneficio adicional, también puede mostrar un área interna que se puede utilizar para visualizar dos niveles de retrocesos de Fibonacci dentro de las barras.
La configuración predeterminada muestra las barras MSS con 4 colores principales, dos que representan la fuerza alc

To download MT4 version please click here . This is the exact conversion from TradingView: "B-Xtrender" By "QuantTherapy". - It is an oscillator based on RSI and multiple layers of moving averages. - It is a two in one indicator to calculate overbought and oversold zones for different RSI settings. - This indicator lets you read the buffers for all data on the window. - This is a non-repaint and light processing load indicator. - You can message in private chat for further changes you need.
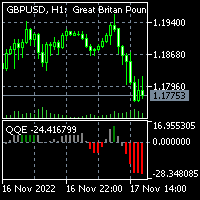
To download MT4 version please click here . - This is the exact conversion from TradingView: "QQE mod" By "Mihkel00". - It can be used to detect trend direction and trend strength. - Gray bars represent weak trends. You can set thresholds to achieve better accuracy in detecting trend strength. - There is buffer index 15 to use in EA for optimization purposes. - The indicator is loaded light and non-repaint. - You can message in private chat for further changes you need.
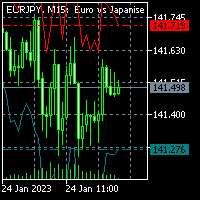
For MT4 version please click here . This is the exact conversion from TradingView: "Average True Range Stop Loss Finder" By "veryfid". - This indicator implements a deviation channel. - The channel determines trend direction as well as stop loss placement. - This is a non-repaint and light processing load indicator. - You can message in private chat for further changes you need.

To get access to MT4 version please click here . - This is the exact conversion from TradingView: "CM Super Guppy" by "FritzMurphy" - This is a light-load processing indicator. - This is a non-repaint indicator. - This is not a multi time frame indicator. - Buffers are available for the lines on chart. - You can message in private chat for further changes you need. Thanks for downloading

The QQE indicator is a momentum-based indicator used to identify trends and sideways. The Qualitative Quantitative Estimate (QQE) indicator works like a smoothed version of the popular Relative Strength Index (RSI) indicator. QQE extends the RSI by adding two volatility-based trailing stops. This indicator is converted Qfrom Trading View QQE MOD by Mihkel00 to be used in MT5 Version.

The indicator illustrates the divergence between the price movements of two financial instruments, such as EURUSD and GBPUSD or US500 and US30 or Gold and Silver. These divergences are plotted in the form of segments on the price chart of the dominant instrument. The dominant instrument refers to the one that exhibits a stronger bullish trend in the case of a bullish divergence, or a stronger bearish trend in the case of a bearish divergence. Investors are encouraged to independently seek correl

Moving Average Crossover Scanner and Dashboard For MT5 Advanced Moving Average Scanner Moving Averages Crossover Dashboard MT4 Version of the product can be downloaded: https://www.mql5.com/en/market/product/69260 The indicator scans the market and sends signals and alerts for Moving Average crossovers, death cross and golden cross.
Crossovers are one of the main moving average ( MA ) strategies.
MA Crossover ( cut ) strategy is to apply two moving averages to a chart: one longer and one s
MACD ADX Oscillator for MT5 Elevate your trading strategy with the MACD ADX Oscillator – a powerful indicator that combines the best of the Moving Average Convergence Divergence (MACD) and the Average Directional Index (ADX) to provide unparalleled insights into market momentum and trend strength. Key Features: Dual Momentum Analysis : This indicator merges MACD's ability to detect changes in market momentum with ADX's strength measurement, giving you a comprehensive view of the market's directi
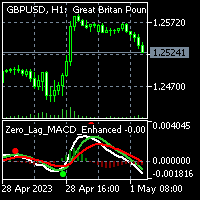
To get access to MT4 version please click here . This is the exact conversion from TradingView: "Zero Lag MACD Enhanced - Version 1.2" by " Albert.Callisto ". This is a light-load processing and non-repaint indicator. All input options are available. Buffers are available for processing in EAs. You can message in private chat for further changes you need. Thanks
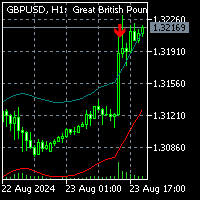
To get access to MT4 version click here . This is the exact conversion from "Nadaraya-Watson Envelope" by " LuxAlgo ". (with non-repaint input option) This is not a light-load processing indicator if repaint input is set to true . All input options are available. Buffers are available for processing in EAs. I changed default input setup to non-repaint mode for better performance required for mql market validation procedure . Here is the source code of a simple Expert Advisor operating based on

To get access to MT4 version please click here . This is the exact conversion from TradingView: "ZLSMA - Zero Lag LSMA" by "veryfid". This is a light-load processing indicator. This is a non-repaint indicator. Buffers are available for processing in EAs. All input fields are available. You can message in private chat for further changes you need. Thanks for downloading

To get access to MT4 version please click here . This is the exact conversion from TradingView: "[SHK] Schaff Trend Cycle (STC)" by "shayankm". This is a light-load processing indicator. This is a non-repaint indicator. Buffers are available for processing in EAs. All input fields are available. You can message in private chat for further changes you need. Thanks for downloading

Point and Plot: The Anchored VWAP with Channel Bands tool is designed for traders of all levels, from beginners to seasoned professionals. Point to the price level you want to anchor to, plot the horizontal line, and watch as this versatile tool transforms your trading approach. User-Friendly Interface : Navigate the tool effortlessly with a user-friendly interface that ensures you never miss a crucial detail. Real-Time Analysis : Make informed decisions in real time with dynamic data that upda

Introducing our revolutionary intra-day trading indicator, meticulously crafted to optimize your trading insights within the 24-hour market cycle. Immerse yourself in historical data with precision using two distinctive modes - "All History" and "Last X Hours."
Key Features: All History Mode Uncover a comprehensive view of the day's dynamics. Instantly analyze the preceding day's high and low, 50% mid-point, and the open versus close price for the current day. Decode critical patterns to infor

If You Are Discretionary Trader This Tool Is A Must Chart Switcher ------> Linking Multi-Time Frame Charts / Syncing Indicators And Drawings. Main USP Of This Indicator: Is Opening Multi-Time Frame Multiple Charts {Up To 10 Charts} Of A Symbol With Just 1 Click. You Do not Have To Save Any Template As It has Been Save Auto When You Click Same Symbol Or Move To Another Symbol. It Is Divided Into 2 Parts: 1} COMMON MODE and 2} SYMBOL MODE 1} COMMON MODE: Under This Mode, You Can Sync Commo

Percentage Price Oscillator (PPO) for MT5 Unlock deeper market insights with the Percentage Price Oscillator (PPO) for MT5 – a dynamic tool designed to measure price momentum and trend direction with precision. Core Features: Flexible Configuration : Customize the PPO to match your trading approach by adjusting the Fast Length, Slow Length, and Signal Length. The indicator is also versatile enough to adapt to any market condition with various source inputs. Intuitive Histogram Display : Choose t

Symbol Changer this Indicator for make more easy when change Chart pair, this more usefull if trader make deal with many pair.
Property Input Indicator Custom Unique ID : Indicator have Id for make different. Show Profit Loss : Adjustable for Show or no Profit and Loss Option Horizontal/Vertical button : Button can change Horizontal or Vertical. Option Window : Adjustable in main Chart as window or buttom chart as Window 1, 2 Main Pairs Preset / Own Pair : available group pair for make easy ha

The "No Reversal Accumatrix AI" is a cutting-edge MetaTrader 5 indicator designed to assist traders in confirming trends without the inconvenience of repainting. Built upon advanced artificial intelligence algorithms, this indicator offers a reliable tool for identifying and validating trends in financial markets. Key Features: Non-Repainting Technology : Unlike traditional indicators prone to repainting, the "No Reversal Accumatrix AI" utilizes innovative algorithms to provide accurate trend co

MACD 2 Scalper Indicator for Precision Trading The MACD 2 Scalper works seamlessly on a variety of assets, including Boom Crash 1000, Crash 500, VIX75, GBP/USD, and many more. What is the MACD 2 Scalper? The MACD 2 Scalper is based on the traditional Moving Average Convergence Divergence (MACD) indicator, with a key difference: it features two lines that form a cloud, offering more nuanced insights. The divergence between the MACD and the signal line is displayed as a color-coded histogram. Vers

25% off. Original price: $40 Stochastic Scanner is a multi symbol multi timeframe Stochastic dashboard that monitors the indicator for price entering and exiting overbought and oversold in up to 28 symbols and 9 timeframes.
Download Demo here (Scans only M1, M5 and M10) Settings description here MT4 version here
Stochastic Scanner features: Signals price entering and exiting the overbought and oversold zones. Monitors up to 28 customizable instruments and 9 timeframes at the same time.

El indicador de precio promedio ponderado por volumen es un indicador de estudio de línea que se muestra en la ventana principal del gráfico de MT5. El indicador monitorea el precio típico y luego el volumen de negociación utilizado para empujar automáticamente la línea del indicador hacia los precios fuertemente negociados. Estos precios son donde se han negociado la mayoría de los contratos (o lotes). Luego, esos precios ponderados se promedian durante un período retrospectivo, y el indicador

The Bheurekso Pattern Indicator for MT5 helps traders automatically identify candlestick pattern that formed on the chart base on some japanese candle pattern and other indicator to improve accurate. This indicator scans all candles, recognizes and then displays any candle patterns formed on the chart. The candle displayed can be Bullish or Bearish Engulfing, Bullish or Bearish Harami, and so on. There are some free version now but almost that is repaint and lack off alert function. With this ve

This all-in-one indicator displays real-time market structure (internal & swing BOS / CHoCH), order blocks, premium & discount zones, equal highs & lows, and much more...allowing traders to automatically mark up their charts with widely used price action methodologies. Following the release of our Fair Value Gap script, we received numerous requests from our community to release more features in the same category. "Smart Money Concepts" (SMC) is a fairly new yet widely used term amongst price a
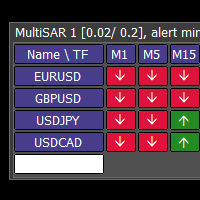
This tool monitors Parabolic SAR indicators on all time frames in the selected markets. Displays a table with signals to open a BUY trade (green) or SELL trade (red). You can easily add or delete market names / symbols. If the conditions for opening a trade on multiple time frames are met, you can be notified by e-mail or phone message (according to the settings in MT5 menu Tools - Options…) You can also set the conditions for sending notifications. The list of symbols/ markets you have entered

Create and trade timeframes in seconds. The bar time duration is freely adjustable from 1 second and up. The chart is accurately constructed using real ticks from the broker's server. Main characteristics The indicator is an overlay on the main chart, making it possible to utilize one-click trading and on-chart order manipulation. History calculated using real tick data. Built-in technical studies: 4 moving averages (Simple, Exponential, Smooth, Linear-weighted, Volume-weighted using tick or rea
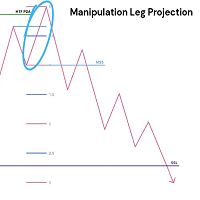
This indicator delves into using standard deviations as a tool in trading, specifically within the Inner Circle Trader (ICT) framework. Standard deviations are a statistical measure that helps traders understand the variability of price movements. These projections is use to forecast potential price targets, identify support and resistance levels, and enhance overall trading strategies. Key Concepts: Understanding Standard Deviations : Standard deviations measure how much a set of values (in thi
¿Sabe usted por qué MetaTrader Market es el mejor lugar para vender estrategias comerciales e indicadores técnicos? Con nosotros, el desarrollador no tiene que perder tiempo y fuerzas en publicidad, protección del programa y ajustes de cuentas con los compradores. Todo eso ya está hecho.
Está perdiendo oportunidades comerciales:
- Aplicaciones de trading gratuitas
- 8 000+ señales para copiar
- Noticias económicas para analizar los mercados financieros
Registro
Entrada
Si no tiene cuenta de usuario, regístrese
Para iniciar sesión y usar el sitio web MQL5.com es necesario permitir el uso de Сookies.
Por favor, active este ajuste en su navegador, de lo contrario, no podrá iniciar sesión.