MetaTrader 5용 유료 기술 지표 - 6

*Non-Repainting Indicator Bruce Webb Explains How To Use Bruce's Price Predictor In Detail And Free Forex Strategy https://youtu.be/hfoB1tZZpTo Bruce's Price Predictor is an indicator that shows precise price reversals. A great arsenal to add to any chart. Bruce's Price Predictor points price reversals with high degree of accuracy and it is great for scalping on the 1min time frame, Or swing trading on the 1hr time frame. Buy and sell arrows are shown on the chart as for entry signals. They do

Precision trading: leverage wolfe waves for accurate signals Special Offer: Purchase now to receive free bonuses worth $129! (Read more for details) Wolfe Waves are naturally occurring trading patterns present in all financial markets and represent a fight towards an equilibrium price. These patterns can develop over short and long-term time frames and are one of the most reliable predictive reversal patterns in existence, normally preceding strong and long price movements. [ Installation Guide

Boom and Crash Indicator - MT5 Spike Detector with Trade Alerts
Unlock the secrets of trading Boom and Crash spikes with our powerful MT5 indicator! This spike detection tool provides accurate buy and sell signals, trade alerts, and High success rate entries. Perfect for scalping, day trading, and swing trading. Get the best Boom and Crash strategy with our Deriv Boom and Crash spike indicator. Indicator does not redraw or repaint.
Key Features & Benefits: Accurate Boom and Crash spike detec

The trading system is designed to work with gold on time periods: 30M, 1H. The indicator allows you to adjust to the market situation.
Parameters for 1H : PERIOD=9F , FILTER=300 .
Parameters for 30M : PERIOD=22B , FILTER=450 .
A small adjustment to a specific broker is allowed .
If you change the amount of history displayed, you may also need to adjust the parameters.
The indicator is not redrawn.
"Gold n XAU" uses different rules for entering a trade and different

ICT Kill zone and Macros Indicator mark and display the following zone times on the chart: Kill zones Kill zone Forex Asian
London Open New York Open London Close Central Bank Dealing range
Kill zone Indices Asian London Open New York AM New York Lunch New York PM Power Hour
Macros London 1 London 2 New York Am 1 New York AM 2 New York Lunch New York PM 1 New York PM 2
Silver bullet London Open New York AM New York PM
Sessions Asian London New York
Chart The display of Kill zone ,

MA Alert Indicator
You do not need anymore to constantly and tediously look at the chart . If your strategy uses any type of moving average with any settings, just add this indicator to the chart according to your required settings
You will be notified whenever the price hits your MA , whether touch or candle close by crossing it. Also, an arrow symbol will be displayed on the chart based on movement.
If you d o not have access to your computer, just set your MetaTrader notification by t

VR Sync Charts는 창 간의 레이아웃을 동기화하는 유틸리티입니다. VR Sync Charts를 사용하여 추세 수준, 수평 수준, 피보나치 표시가 모든 차트와 동기화됩니다. 본 유틸리티를 사용하여 MetaTrader 터미널에서 모든 표준 그래픽 개체를 동기화할 수 있으며 모든 추세, Gann 라인 및 기타 개체가 인접 차트에 정확하게 복사됩니다. 더 이상 괘선과 표시를 수동으로 복사할 필요가 없습니다. 아래 그림과 비디오에서 VR Sync Charts 유틸리티의 작업을 보고 평가할 수 있습니다. 권장 사항: 모든 차트에 지표를 설정하기. 터미널 설정에서 «더블 클릭으로 개체 선택» 기능을 설정하기. 본 프로그램을 전략 시험에서 테스트할 수 없습니다. 아래 비디오를 보십시오. 혜택 모든 그래픽 개체를 동기화함. 모든 시간대와 차트 동기화 모든 업데이트는 무료입니다 초보자뿐만 아니라 전문 트레이더 모두에게 적합함 설정이 많지 않아 선택적으로 동기화를 할 수 있음. 모든 금융 상품

The Average Price indicator calculates the average prices of BUY (LONG) and SELL (SHORT) open positions, taking into account the size of open positions, commissions and swaps.
The indicator builds the average line of LONG open positions, after crossing which, from the bottom up, the total profit for all LONG positions for the current instrument becomes greater than 0.
The indicator builds the average line of SHORT open positions, after crossing which, from top to bottom, the total profit f

This indicator will draw a label above or below each candle based on Rob Smith's The Strat as they develop over time on your chart.
As price evolves, a candle can switch between three states. When the candle first opens, if it sits completely within the previous candles high and low, then it will start as a Type 1. As time moves on, if it breaks either the high or low of the previous candle, it will be come a type 2, and should the price action be volatile and directionless, it may then

This indicator/dashboard , is place on a single symbol. It shows the percentage of movement withing all time frames from M1 to W1.The text will change green if all % are in the positive for a buy signal.The text will change red if all % are below zero and in negative for a sell signal. There are audible notifications, as well as on screen notifications along with push notifications that can be turned on and ON/OFF in the settings.
This is a sure way to Find trends quickly and efficiently, with

Технический индикатор широко известен читателям и поклонникам стратегии «черепах». Отображается линией по нижней/верхней точке цены за определенный интервал времени. Значение ценового канала также используют для определения зон поддержки и сопротивления. Если котировки актива прорывают и закрываются ниже/выше канала, то это является сигналом работы в сторону пробоя. Способы применения: Индикатор является самодостаточным и не требует дополнительных фильтров для начала работы. Однако для надёжност

BeST Swing Strategy MT5 is a Metatrader indicator based on the corresponding Jim Berg's work about volatility as described in his article "The Truth About Volatitlity" (TASC 2/2005).The indicator consists of 2 channel lines deriving as (MA+/- times the ATR) and can be used as a standalone trading system.The outlier prices of the Market as of the indicator's values can be used for producing Entry and Exit Signals.
Advantages of the indicator
== Uses 2 Swing Strategies
== Never repaints it

Any financial instrument that is traded on the market is a position of some active towards some currency. Forex differs from other markets only in the fact, that another currency is used as an active. As a result in the Forex market we always deal with the correlation of two currencies, called currency pairs.
The project that started more than a year ago, helped to develop a group of indicators under a joint name cluster indicators. Their task was to divide currency pairs into separate currenci

Multi-timeframe indicator Relative Strength Index displays information simultaneously from different periods in one subwindow of the chart.
Parameters Period of averaging — averaging period for the RSI calculation. Type of price — price used. Timeframes for RSI — list of periods, separated by a space or comma or semicolon. Number of bars for each period — the number of bars displayed for each period. Sort periods — sort periods if they are listed in no particular order. Current period first —

*This is trading view indicator converted in mql5*
The HA Market Bias Indicator is a popular tool used in trading and technical analysis, designed to help traders identify market bias and potential trend reversals. It is commonly used in conjunction with candlestick charts and provides valuable insights into market sentiment. The indicator is based on the Heiken Ashi (HA) candlestick charting technique, which aims to filter out market noise and provide a smoother representation of price actio

Expert Market Edge is scalping, trending, reversal indicator, with alerts . You can use it all and fit with your strategy whatever it fits you. My recommendation is to combine with my Colored RSI , and when 2 signals are matched, and pointing same direction (for example buy on this indicator, and green on RSI, you can take a long position, stop loss should be last local low, if you want to be more conservative, add ATR. ) you can take position. If you using moving averages, that's even better i

I am placing the indicator obtained as a result of market analysis, it may be useful to someone. The indicator shows how quickly the price changes (where there is a trend), and where there is no obvious trend. With the right settings, you can know the beginning of the trend in advance.
The indicator measures the slope / rate of change / ratio of the moving average on the current bar relative to the previous bar.
The settings specify the ratio limit for a downtrend and a ratio limit for an u

Indicator introduction: A channel and trend line indicator, which is a good tool for manual trading, and also can be used for creating new EAs, without drifting or repainting. It applies to any timeframes and any symbols. The work of the indicator is shown in the screenshots. For any novice and programming trading friend, you can write the signal into the EA to play freely, buffer 0 corresponds to the bold trend line, buffer 4 and 5 respectively corresponds to the channel's upper and lower f
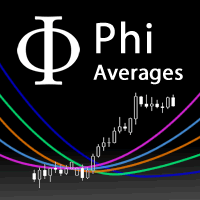
A fan of special weighted moving averages, able to predict tendency reversal and give references about price movements during consolidation and drawbacks. This special moving average is based on Phi fractals and is not available on others indicators. Reproduce this method with another kind of average will not have the same results. The fan has the following averages: 17: Purple 34: Blue 72: Orange 144: Green Blue 305: Dark Blue 610: Grey How to use the fan to analyze price behaviour: If the pric
KT Know Sure thing is a momentum oscillator based on the smoothed rate of change over four different timescales and was developed by Martin Pring. In 1992, Pring published the initial description of the indicator in Stocks & Commodities magazine's "Summed Rate of Change (KST)" article. KST creates a momentum oscillator by combining the price momentum measurements from four different price cycles. Traders can utilize KST to search for bullish or bearish divergences, signal line crossovers, and ce

An indicator to draw a graph of account current and historical state such as Balance, Equity, Margin, Free Margin, Margin Level, Drawdown, Account Profit, Deposit and Withdrawals.
Indicator Inputs : Draw Balance Graph Draw Equity Graph Draw Margin Graph Draw Free Margin Graph Draw Margin Level Graph Draw Drawdown Graph Draw Account Profit Graph Hide Data on Chart and Buffers Connect Gaps by Lines Sign of DDs on Profit Sign of DDs on Loss
Tips : The Indicator will draw historical balance gra
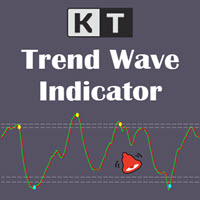
KT Trend Wave is an oscillator based on the combination of Price, Exponential, and Simple moving averages. It usually works great to catch the short term price reversals during the ongoing trending market. The bullish and bearish crossovers of the main and signal lines can be used as buy/sell signals (blue and yellow dot). It can also be used to find the overbought and oversold market. The buy and sell signals that appear within the overbought and oversold region are usually stronger.
Feature

50% off. Original price: $60 Triangle Finder is a multi symbol multi timeframe dashboard that finds symmetrical triangle pattern in 28 symbols and 9 timeframes with a deep scan feature to scan all market watch symbols (up to 1000 instruments!).
Download Demo here (Scans only M1, M5 and M10) Settings description here MT4 version here
Triangle Finder features: Realtime monitoring of 28 customizable instruments and 9 timeframes at the same time. Deep scan mode to scan all market watch sym

Описание Данный индикатор строит (альтернативные, математически рассчитанные) уровни поддержки и сопротивления, а так же уровни, к которым с большой вероятностью придет цена в ближайшее время. Следует обратить внимание на то, что расчет уровней производится на исторических данных, и качество котировок играет важную роль при построении индикатором линий. Замечу, что отрисованные Magneto и Magneto Weekly линии не изменяют свои значения на всем расчетном периоде. Важное изменение! Добавлена функция

This indicator accurately identifies and informs market reversals and continuation patterns by analyzing and signaling the Three White Soldiers / Three Black Crows pattern. It also offers a "real-time backtesting" panel in the indicator itself in a way that every change made on the indicator parameters will immediately show the user how many signals are occurred, how many take profits and stop losses were hit and, by having these informations, the Win Rate and the Profit Factor of the setup bas
The Volume Heatmap indicator visually shows the INTENSITY of the volume taking into account the concept of standard deviation. Purpose of the Indicator: High volumes are common where there is a strong consensus that prices will increase. An increase in volume often occurs at the beginning of a new upward trend in the price of an asset. Some technical analysts do not rely on trend confirmations without a significant increase in volume. Low volumes usually occur when an asset is heading for a down

"Wouldn't we all love to reliably know when a stock is starting to trend, and when it is in flat territory? An indicator that would somehow tell you to ignore the head fakes and shakeouts, and focus only on the move that counts?" The Choppiness Index is a non-directional indicator designed to determine if the market is choppy (trading sideways) or not choppy (trading within a trend in either direction). It is an oscillating indicator between -50 (very trendy) and +50 (very choppy). There are man

Multi timeframe ZigZag indicator. It displays the support/resistance horizontal lines and their breakouts, as well as draws the current targets of the market. It can also display lines of the Fractals indicator and candles from other periods (up to Quarterly).
The indicator redraws the last (current) point, and in some cases can change the last 2-3 points.
All lines are drawn as objects (not indicator buffers, but there is a possibility to receive the data for the EA ). When used in an Exp

King of Dragon 채널, King of Dragon 표시기, King of Dragon 시스템, King of Dragon MT5, King of Dragon 클래식 표시기, King of Dragon 스와이프 시스템, 킹 오브 드래곤 올인원
클래식 채널 거래 시스템인 King of Dragon 채널 거래 시스템은 많은 사용자가 MT5 버전을 강력하게 요청합니다. 이 프로그램은 여러 버전에서 성능을 위해 최적화되었으며 이미 비교적 원활한 시스템입니다. 49$ → 59$ 빨간색 영역, 긴 추세, 짧지 않고 길기만 함 녹색 영역, 짧은 추세, 짧고 길지 않음 회색 영역, 통합 추세, 충격 지표의 길고 짧은 작동 참조 https://www.mql5.com/ko/market/product/96760
매개변수 "===== 메인 =====" int CalcalueBars = 1000;//계산된 막대 수 color BeltColor = clrGray;//트렌드 벨트의 색상 bo

PTS - Precision Trading Systems의 Divergence Buy Finder
Precision Divergence Finder는 시장 바닥을 핀포인트 정확도로 찾아내도록 설계되었으며 이를 자주 수행합니다.
기술적 분석에서 바닥을 고르는 기술은 일반적으로 정상을 선택하는 것보다 훨씬 쉽습니다. 이 항목은 정확히 이 작업을 위해 설계되었습니다. 상승 Divergence가 식별되면 구매하기 전에 트렌드가 반등할 때 기다리는 것이 현명합니다. 10 또는 20 바 높음을 사용하거나 이전 바의 이동 평균 15-30이 상승하는 것을 식별하기 위해 사용할 수 있습니다.
복잡한 알고리즘은 실시간 바 단위로 활성 Demand Index(DI) Divergence 수를 찾아내고 계산합니다.
모델은 시장 가격이 새로운 최저점을 기록하고 Demand Index가 새로운 최저점을 기록하지 않을 때 Divergence를 발생시키는 것을 관찰합니다.
이 지표는 두 가지

Gartley Hunter - An indicator for searching for harmonic patterns (Gartley patterns) and their projections. The indicator is equipped with a system of alerts and push notifications. Manual (Be sure to read before purchasing) | Version for MT4 Advantages
1. 12 harmonic patterns: 7 classical and 5 exotic. New patterns will be added as the indicator develops. 2. Constant automatic search for harmonic patterns. The indicator is capable of finding from the smallest to the largest patterns. 3. Autom

FXC iRSI-DivergencE MT5 Indicator
This is an advanced RSI indicator that finds trend-turn divergences on the current symbol. The indicator detects divergence between the RSI and the price movements as a strong trend-turn pattern.
Main features: Advanced divergence settings
Price based on Close, Open or High/Low prices Give Buy/Sell open signals PUSH notifications
E-mail sending Pop-up alert Customizeable Information panel Input parameters: RSI Period: The Period size of the RSI indicator.
R
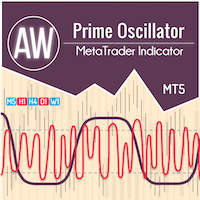
두 개의 오실레이터의 조합. 첫 번째 항목은 진입점을 표시하고 두 번째 항목은 현재 추세를 표시합니다. 표시기는 두 가지 모드의 화살표로 오실레이터 신호를 표시할 수 있습니다. 모든 빠른 오실레이터 신호 또는 현재 추세 방향의 신호만 표시할 수 있습니다. 다중 시간대 패널과 세 가지 유형의 신호 알림이 있습니다. 이익: 일일 및 스캘핑 거래에 적합 추세 필터링 간단하고 민감한 설정 다중 시간대 패널 Advisor에 통합하는 데 적합합니다. 모든 기호 및 기간에서 작동합니다. 세 가지 유형의 알림 MT4 버전 -> 여기 / 문제해결 -> 여기 지표 전략 표시기는 두 개의 서로 다른 오실레이터로 구성됩니다. 느린 추세선(두꺼움) - 지표의 고수준이 위에서 아래로 교차하면 하락세 지표이고, 낮은 수평 수준(지표의 낮은 수준)이 아래에서 위로 교차하면 하락 추세 지표입니다. 상승 경향. 또한, 하단 영역에서 느린 선을 발견하면 현재 추세가 하락세임을 나타내고, 반대로 상단 영역

A "Volume Profile" is an advanced charting indicator that displays total volume traded at every price level over a user specified time period. The main components of the volume profile are POC ( Point Of Control - the price level, at which the maximum number of contracts were executed during a selected period), VAH ( Value Area High - the highest price in the Value Area) and VAL ( Value Area Low - the lowest price in the Value Area).
When we settled on the original indicator, we spent a lot o

** All Symbols x All Time frames scan just by pressing scanner button ** *** Contact me after purchase to send you instructions and add you in "Divergence group" for sharing or seeing experiences with other users. Introduction MACD divergence is a main technique used to determine trend reversing when it’s time to sell or buy because prices are likely to drop or pick in the charts. The MACD Divergence indicator can help you locate the top and bottom of the market. This indicator finds Regular div

Harmonic patterns are characteristic series of price movements with respect to Fibonacci levels, which statistically precede price reversals. This indicator searches for harmonic patterns. It is capable of recognising 26 classical and non-classical harmonic patterns : Classical Gartley Butterfly Alternate Butterfly Bat Alternate Bat Crab Deep Crab Three Drives Non-classical Shark Alternate Shark Cypher 5-0 Anti Gartley Anti Butterfly Anti Alternate Butterfly Anti Bat Anti Alternate Bat Anti Crab

Multicurrency and multitimeframe modification of the ZigZag indicator. Displays the current direction of the market, the height of the last movement, the number of bars in this movement and the breaking of the previous point of the ZigZag (horizontal line). This is MTF Scanner.
You can specify any desired currencies and timeframes in the parameters. Also, the panel can send notifications when the ZigZag changes direction or when there was a breakthrough of the previous point. By clicking on a
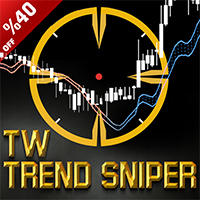
가격 행동, 통화 거래 세션 탐지, 피보나치 및 탐지 기능과 함께 "Trade Wizards" 전용 지표 공식을 사용하여 주요 추세를 식별하는 데 사용되는 강력한 지표인 "TW Trend Sniper" 지표를 소개합니다. 정확도가 높은 인공지능 노이즈 제거 방법. 숙련된 트레이더와 전문 프로그래머로 구성된 "Trade Wizards 그룹" 이 설계한 이 전략을 이제 트레이더가 사용하여 트레이딩 여정을 발전시킬 수 있습니다.
자세한 내용은 "TW Trend Sniper" 기사를 읽어보세요 . 이 제품은 다음 전략을 사용하여 완전한 신호를 제공합니다. 가격 조치(스마트 머니 조항) 특정 시간 세션(AI가 감지) 피보나치 수준과 동적 지지 및 저항 이동 평균 Trade Wizards 독점 지표 공식 AI 노이즈 제거 방법
기술 사양: 신호와 SL & TP 및 표시기 자체에서는 어떤 식으로도 변경되지 않습니다. 다시 칠하지 않습니다! 변화하는 추세를 높은

VJ Sniper - MT5 Buy / Sell Indicator: This Indicator is as simple as Buy in Up Trend & Sell in Down Trend. There are Support / Resistance Graphic levels for choosing the best Entries. Background: Any in-built indicator of MT5 does not work as stand alone such as Stochastic, CCI or DeMarker etc. But combination of them with trend projection work & give the best results for Trading entries. So this Indicator is blended to give the best

[ MT4 Version ] Only the next 10 units at current price! Final price: $299 Are you tired of spending months on demo or live accounts to test your trading strategies? The Backtesting Simulator is the ultimate tool designed to elevate your backtesting experience to new heights. Utilizing Metatrader historical symbol information, it offers an unparalleled simulation of real market conditions. Take control of your testing speed, test ideas quickly or at a slower pace, and witness remarkable improve

Good day!
I present to you a trading technical indicator for Deriv broker synthetic indices. This indicator ONLY works with the following indices: Boom 300 Index Boom 500 Index Boom 1000 Index Crash 300 Index Crash 500 Index Crash 1000 Index The indicator was created to give signals to open medium-term trades in the direction of Spikes. But you can open trades in the opposite direction to Spikes, at your own risk. Trade only on M1. Other TFs do not guarantee the correct operation of the indic

!! FLASH SALE !! Over 80% off !! For ONE week only. Now only $47 - normally $297! >>> Ends on 30 June 2023 - Don't miss it!
The Consolidation Breakout Alerts Indicator will revolutionize your trading strategy. Our innovative indicator offers unique buy and sell arrows when price breaks out from consolidation, allowing you to get in at the most optimal entry with minimal risk and maximum reward potential. Never again will you miss out on the lucrative trading opportunities available

Limited-Time Offer: Only $49!
Get Insight Pro now for just $49 (was $99)! Hurry, this special price is valid until 30th August . After that, the price returns to $99 . Don't miss out—boost your market analysis today! Insight Pro is a comprehensive tool for market analysis. It offers various features such as trend analysis, resistance and support levels, and distribution analysis, suitable for both novice and experienced traders. Features Trend Analysis Detects and visualizes marke

Best Scalper Oscillator is an indicator for MetaTrader 5 based on mathematical calculations on the price chart. This is one of the most common and useful indicators for finding the trend reversal points. Best Scalper Oscillator is equipped with multiple types of notification (push notifications, emails, alerts), which allows opening trades in time.
Distinctive features Generates minimum false signals. Excellent for identifying trend reversals. Perfect for scalping. Suitable for working on t

DTFX Algo Zones are auto-generated Fibonacci Retracements based on market structure shifts.
These retracement levels are intended to be used as support and resistance levels to look for price to bounce off of to confirm direction.
USAGE Figure 1 Due to the retracement levels only being generated from identified market structure shifts, the retracements are confined to only draw from areas considered more important due to the technical Break of Structure (BOS) or Change of Character

Overview
The Volume SuperTrend AI is an advanced technical indicator used to predict trends in price movements by utilizing a combination of traditional SuperTrend calculation and AI techniques, particularly the k-nearest neighbors (KNN) algorithm.
The Volume SuperTrend AI is designed to provide traders with insights into potential market trends, using both volume-weighted moving averages (VWMA) and the k-nearest neighbors (KNN) algorithm. By combining these approaches, the indicat

The ICT Unicorn Model indicator highlights the presence of "unicorn" patterns on the user's chart which is derived from the lectures of "The Inner Circle Trader" (ICT) .
Detected patterns are followed by targets with a distance controlled by the user.
USAGE (image 2) At its core, the ICT Unicorn Model relies on two popular concepts, Fair Value Gaps and Breaker Blocks. This combination highlights a future area of support/resistance.
A Bullish Unicorn Pattern consists ou

The balance of supply and demand is a simple and effective market analysis method. The supply and demand diagram can show you in advance, even before the trend reversal, where the supply ends and the demand is already emerging, where the demand ends and the supply is emerging, while substantially increasing the probability of making a deal in the right direction and with a high profit factor.
Indicator signals The indicator uses the price/volume values to generate signals: ED – excess demand.

QM (Quasimodo) Pattern is based on Read The Market(RTM) concepts. The purpose of this model is to face the big players of the market (financial institutions and banks), As you know in financial markets, big traders try to fool small traders, but RTM prevent traders from getting trapped. This style is formed in terms of price candles and presented according to market supply and demand areas and no price oscillator is used in it. RTM concepts are very suitable for all kinds of investments, includi

The Key level wedge MT5 indicator automatically draws rising wedge pattern and falling wedge pattern for you on the chart. This pattern is really good when used as a confirmation entry at key support & resistance, supply & demand and reversal zones.
Advantages
The Key level wedge MT5 block DOES NOT RE-PAINT, giving you confidence when a signal appears and also helps when looking back. The Key level wedge MT5 includes an on/off button on the chart to easily keep the charts cle

The indicator shows divergence between the slope of lines connecting price and MACD histogram peaks or troughs. A bullish divergence (actually a convergence) occurs when the lines connecting MACD troughs and the lines connecting the corresponding troughs on the price chart have opposite slopes and are converging. A bearish divergence occurs when the lines connecting MACD peaks and the lines connecting corresponding price peaks have opposite slopes and are diverging. In such a case, the indicato

To get access to MT4 version please click here . This is the exact conversion from TradingView: "ZLSMA - Zero Lag LSMA" by "veryfid". This is a light-load processing indicator. This is a non-repaint indicator. Buffers are available for processing in EAs. All input fields are available. You can message in private chat for further changes you need. Thanks for downloading

The indicator refers to the means of probabilistic analysis. Prediction is performed by the Monte Carlo method together with a mathematical model of a neuron. But, the modeling of samples for this method is made not artificially, but comes from the original "nature", that is, from history. The number of samples and the detail of their modeling is achieved using the lower (relative current) timeframe.
Indicator algorithm :
In general terms, the algorithm boils down to the fact that the ind

추세와 함께 가십시오. 네, 15분 프레임에 매수든 매도든 진입 신호를 기다리고, 30분 프레임에 신호가 나타나는지 확인하세요(때때로 신호가 나타나는 데 1시간 이상이 소요됩니다. 돌아올 수 있습니다) 15분 프레임으로 갔다가 30분 프레임으로 돌아가서 메인 시그널이 나타날 때까지 이를 반복합니다. 30분 프레임에 시그널이 나타나면 가격을 가지고 진입하여 선이 바뀔 때 수익을 얻습니다. , 이익이 기록되거나 반대 신호가 나타나는 경우 매우 간단하며 모든 주요 통화에서 작동합니다. 금속, 표시기, 모든 프레임이지만 가장 좋은 결과는 30분 프레임입니다.
항상 캔들 바닥 아래에 스톱로스를 설정하고 자본 관리를 초과해서는 안 됩니다. 자본금의 10% 추세와 함께 가십시오. 네, 15분 프레임에 매수든 매도든 진입 신호를 기다리고, 30분 프레임에 신호가 나타나는지 확인하세요(때때로 신호가 나타나는 데 1시간 이상이 소요됩니다. 돌아올 수 있습니다) 15분 프레임으로 갔다가 30분

Multicurrency and multitimeframe modification of the indicator Bollinger Bands. On the dashboard you can see breakouts and touches of the Bollinger Bands. In the parameters you can specify any desired currencies and timeframes. The indicator can also send notifications when the price touches the Bollinger Bands, when the current volatility changes (expands or falls), and when the price touches all the bands. By clicking on a cell with a period, this symbol and period will be opened. This is MTF

I would like to present to you really UNIQUE multitimeframe and multicurrency indicator which will be showing both reaction zones ( Where the price will have an immediate reaction from a certain zone) and also a reversal zones , which could reverse price for a long time. The main advantage is that ALL THE ZONES ARE SHOWN before the happen and not after like many do ( THis is shown very well in the screenshots)
Another reason why it is unique is that you put it on 1 graph , for example EURUS

The indicator draws supply and demand zones. The zone timeframe can be set independently of the chart timeframe. For instance, it is possible to set M5 zones on an H4 chart. The importance of zones can be adjusted using the zone strength parameter. Demand zones are displayed if at least one candle in the range of the zone is entirely above the zone. Similarly, supply zones are displayed if at least one candle within the zone is entirely below the zone.

"The Squeeze indicator attempts to identify periods of consolidation in a market. In general the market is either in a period of quiet consolidation or vertical price discovery. By identifying these calm periods, we have a better opportunity of getting into trades with the potential for larger moves. Once a market enters into a "squeeze," we watch the overall market momentum to help forecast the market direction and await a release of market energy." The Modified TTM Squeeze Indicator is a modi

Gold Venamax - 이것은 최고의 주식 기술 지표입니다. 지표 알고리즘은 자산의 가격 변동을 분석하고 변동성과 잠재적 진입 영역을 반영합니다.
표시기 기능:
이것은 편안하고 수익성 있는 거래를 위한 매직과 두 개의 추세 화살표 블록을 갖춘 슈퍼 지표입니다. 블록 전환을 위한 빨간색 버튼이 차트에 표시됩니다. 매직은 표시기 설정에서 설정되므로 서로 다른 블록을 표시하는 두 개의 차트에 표시기를 설치할 수 있습니다. Gold Venamax는 서로 다른 화살표 버퍼(GV 및 SF)를 사용하여 두 개의 차트에 배치할 수 있습니다. 이렇게 하려면 설정에서 다른 Magic을 선택해야 합니다. 예를 들어 하나는 Magic = 999이고 다른 하나는 Magic = 666입니다. 다음으로 차트의 빨간색 버튼으로 화살표 버퍼를 선택할 수 있습니다. 입력하기에 가장 좋은 신호 = 두 버퍼(GV 및 SF)의 신호 화살표 + 세 MA 라인(빨간색 또는 파란색)의 방향을 따릅니다.
지

## WAPV Full을 사용하여 전문적으로 작동하고 추적할 수 있습니다. 큰 선수 돈은 어디에 있습니까 당신의 손에 혼자 읽기를 수행하는 도구가 있다고 상상해보십시오. 최고의 거래 지역을 보여주는 주요 마켓 플레이어의 가격 및 볼륨 분석을 기반으로 합니다. WAPV Full은 R. Wyckoff의 운영에 100% 초점을 맞춘 완전한 도구입니다. 거래 파동에서 시장 움직임을 매핑하는 것 외에도 매핑합니다. 가격과 거래량을 읽어 시장. 프로페셔널 마켓은 R. Wyckoff의 3가지 법칙에 따라 운영됩니다. # 원인과 결과 # 수요와 공급 # 노력 x 결과 이 모든 것이 WAPV Full로 제공되며 16가지 기본 도구를 제공합니다. 시장을 전문적으로 분석하고 결과적으로 결과를 개선하십시오. 내가 말하는 내용을 이해하려면 이미지와 비디오를 참조하십시오. ## WAPV Fulleul sayonghayeo jeonmunjeog-eulo jagdonghago chujeoghal su isss

The indicator displays market profiles of any duration in any place on the chart. Simply create a rectangle on the chart and this rectangle will be automatically filled by the profile. Change the size of the rectangle or move it - the profile will automatically follow the changes.
Operation features
The indicator is controlled directly from the chart window using the panel of buttons and fields for entering parameters. In the lower right corner of the chart window there is a pop-up "AP" but

One of the most powerful and important ICT concepts is the Power of 3. It explains the IPDA (Interbank Price Delivery Algorithm) phases. PO3 simply means there are 3 things that the market maker's algorithm do with price:
Accumulation, Manipulation and Distribution
ICT tells us how its important to identify the weekly candle expansion and then try to enter above or below the daily open, in the direction of the weekly expansion.
This handy indicator here helps you keep track of the weekly

Contact me for instruction, any questions! Introduction The Elliott Wave in technical analysis describes price movements in the financial market that are related to changes in trader sentiment and psychology. The 5 W Pattern (Known as 3 Drives) is an Elliott Wave pattern that is formed by 5 consecutive symmetrical moves up or down. In its bullish form, the market is making 5 drives to a bottom before an uptrend forms. In a bearish 5-drive, it is peaking before the bears take over. 5W Pattern S

Very powerful indicator! converted from TradingView with upgraded alerts and added notifications. Ideal use in EAs.
Use as a supplementary Indicator to confirm your entries, but it is as good on it's own.
The indicator consists of 3 different Trend Meters and a 2 Trend Bars which are used to confirm trend
How to Use:
The more Trend meters are lit up the better =>>
-more GREEN COLOR at one bar means more confirmation to open buy trade,
- more RED COLOR signals for one bar = more

The ICT Propulsion Block indicator is meant to detect and highlight propulsion blocks, which are specific price structures introduced by the Inner Circle Trader (ICT).
Propulsion Blocks are essentially blocks located where prices interact with preceding order blocks. Traders often utilize them when analyzing price movements to identify potential turning points and market behavior or areas of interest in the market.
USAGE (fingure 1) An order block is a significant area on a pric

This is an indicator of trading sessions that can display all levels (Open-High-Low-Close) for four sessions . The indicator can also predict session levels. Sessions can be drawn with lines or rectangles (empty or filled), lines can be extended to the next session. You can easily hide/show each session by pressing hotkeys (by default '1', '2', '3', '4'). You can see ASR (Average Session Range) lines (default hotkey 'A'). This is similar to the ADR calculation, only it is calculated based on

VWAP 밴드 비주얼 스타일 1.0 금융 시장 지표는 트레이더와 투자자가 금융 시장을 분석하고 의사 결정을 내리는 데 사용하는 필수 도구입니다. VWAP 및 Bollinger Bands는 트레이더가 시장 추세 및 가격 변동성을 측정하는 데 사용하는 두 가지 인기 있는 기술 분석 도구입니다. 이 제품에서는 두 지표를 결합하여 시장 동향과 변동성에 대한 종합적인 분석을 제공하는 고유한 제품을 만들 것을 제안합니다. 이 제품은 데이터 기반 분석을 기반으로 정보에 입각한 결정을 내리려는 거래자와 투자자에게 이상적입니다.
다이버전스 전략은 트레이더가 시장에서 잠재적인 추세 반전을 식별하는 데 사용하는 인기 있는 기술 분석 기법입니다. 이 전략은 가격 변동과 기술 지표 간의 차이를 식별하는 데 의존합니다. 이 섹션에서는 비주얼 스타일과 볼린저 밴드를 사용한 다이버전스 전략에 대해 설명합니다.
예를 들어 비주얼 스타일과 볼린저 밴드를 사용하는 다이버전스 전략은 트레이더가 시장에서 잠재적

** All Symbols x All Time frames scan just by pressing scanner button ** *** Contact me after the purchase to send you instructions and add you in "Harmonic Scanner group" for sharing or seeing experiences with other users. Introduction Harmonic Patterns are best used to predict turning point. Harmonic Patterns give you high win rate and high opportunities for trade in during one day. This indicator detects the best and successful patterns based on Harmonic Trading concepts . The Harmonic Patt

This is a multi timeframe version of the Supply and Demand indicator . It allows you to analyze a chart using the law of supply and demand on three different timeframes at a time. You will see zones of sales and purchases and determine the most profitable points to open positions. The indicator is based on the principle of market fractality. Supply and demand zones show places where a strong buyer or seller has made the price reverse and change its direction. The indicator has several types of
MetaTrader 마켓은 개발자들이 거래 애플리케이션을 판매할 수 있는 간단하고 편리한 사이트이다.
제품을 게시하고 마켓용 제품 설명을 어떻게 준비하는가를 설명하는 데 도움이 됩니다. 마켓의 모든 애플리케이션은 암호화로 보호되며 구매자의 컴퓨터에서만 실행할 수 있습니다. 불법 복제는 불가능합니다.
트레이딩 기회를 놓치고 있어요:
- 무료 트레이딩 앱
- 복사용 8,000 이상의 시그널
- 금융 시장 개척을 위한 경제 뉴스
등록
로그인
계정이 없으시면, 가입하십시오
MQL5.com 웹사이트에 로그인을 하기 위해 쿠키를 허용하십시오.
브라우저에서 필요한 설정을 활성화하시지 않으면, 로그인할 수 없습니다.