MetaTrader 5용 유료 기술 지표 - 2

다음 반전 움직임 신호 받기 | 수익률 통계 최적화 | 가격이 테스트 할 영역 가져 오기 | 비추적, 비지연 지표 - 수동 및 자동 거래에 이상적 - 모든 자산 및 모든 시간 단위에 적합 $ 69 - 이후 >> $149 로 복귀 구매 후 이 채널로 문의 하여 권장 설정을 확인하세요. МТ4 - МТ5 버전 | TrendDECODER 및 PowerZONES 로 전체 방법을 확인하세요.
이것이 무엇인가요?
가장 예측 가능한 패턴은 "더블 탑"과 "더블 바텀"으로, 문자가 이러한 움직임을 명시적으로 나타내기 때문에 일반적으로 "M"과 "W"로 알려져 있습니다.
블레이드스칼퍼에는 쉽고 간편한 스캘핑을 위한 혁신 기술이 가득합니다.
ScalpUP / ScalpDOWN 신호를 사용하면 다음 움직임에 대한 명확한 신호를 얻을 수 있습니다. PowerZones를 사용하면 가격이 매력적일 가능성이 높은 구역을 즉시 얻을 수 있습니다.

트렌드 라인 맵 표시기는 트렌드 스크리너 표시기의 애드온입니다. Trend screener(Trend Line Signals)에 의해 생성된 모든 신호에 대한 스캐너로 작동합니다.
Trend Screener Indicator 기반의 Trend Line Scanner입니다. Trend Screener Pro 표시기가 없으면 Trend Line Map Pro가 작동하지 않습니다.
It's a Trend Line Scanner based on Trend Screener Indicator. If you don't have Trend Screener Pro Indicator, the Trend Line Map Pro will not work .
MQL5 블로그에 액세스하여 추세선 지도 표시기의 무료 버전을 다운로드할 수 있습니다. Metatrader Tester 제한 없이 구매하기 전에 사용해 보십시오. : 여기를 클릭하세요
1. 쉽게 얻을 수 있는 이점 통화 및

WHY IS OUR FXACCCURATE LS MT5 THE PROFITABLE ? PROTECT YOUR CAPITAL WITH RISK MANAGEMENT
Gives entry, stop and target levels from time to time. It finds Trading opportunities by analyzing what the price is doing during established trends. POWERFUL INDICATOR FOR A RELIABLE STRATEGIES
We have made these indicators with a lot of years of hard work. It is made at a very advanced level.
Established trends provide dozens of trading opportunities, but most trend indicators completely ignore them!

대칭 삼각형 차트 패턴은 가격이 강제로 상승 또는 붕괴되기 전에 수축 및 통합 기간을 나타냅니다. 하단 추세선에서의 분석은 새로운 약세 추세의 시작을 나타내고 상단 추세선의 이탈은 새로운 강세 추세의 시작을 나타냅니다.
MT4 버전 사용 가능: https://www.mql5.com/en/market/product/68709/
이 표시기는 이러한 패턴을 식별하고 4가지 핵심 포인트가 형성되고 가격이 다시 삼각형으로 되돌아갔을 때 경고하므로 잠재적인 돌파에 대비할 수 있습니다. 대칭 삼각형이 항상 완벽하게 대칭인 것은 아니며 가격이 오르거나 내릴 수 있지만 일반적으로 가장 성공적인 돌파는 삼각형의 첫 번째 점을 형성한 높거나 낮은 방향입니다. 따라서 지표는 돌파에 대한 강세 또는 약세 편향을 제공하고 색상으로 구분되어 특정 방향에 대해 경고합니다. 한 방향으로만 거래를 할 필요는 없지만 어느 방향으로도 돌파가 가능하지만 첫 번째 포인트 추세에 따라 중단이 발생하면 더 크고 빠른

VTrende Pro - MTF indicator for trend trading with a display panel for MT5 *** Videos can be translated into any language using subtitles (video language - Russian)
Although the signals of the VTrende Pro indicator can be used as signals of a full-fledged trading system,
it is recommended to use them in conjunction with the Bill Williams TS.
VTrende Pro is an extended version of the VTrende indicator. Difference between Pro version and VTrende:
- Time zones
- Signal V - signal 1-2 waves

이 강력한 도구는 자동으로 추세 라인을 식별하여 거래 전략을 간소화하고보다 정보에 근거한 결정을 내릴 수 있도록 도와줍니다. MT4 버전
주요 기능 자동 추세 라인 감지 : "기본 추세선"표시기는 잠재적 인 추세 라인에 대한 시장을 스캔하고 차트에 즉시 표시합니다.이것은 귀중한 시간을 절약하고 중요한 트렌드를 놓치지 않도록합니다. 사용자 친화적 인 패널 : 우리의 지표에는 다양한 트렌드 라인을 쉽게 그릴 수있는 아름답고 직관적 인 패널이 제공됩니다.이 패널은 모든 경험 수준의 거래자를 위해 설계되어 몇 번의 클릭만으로 추세선을 추가, 편집 또는 제거 할 수 있습니다. 좋아하는 트렌드 라인을 저장하고 관리하십시오. : 가장 중요한 트렌드 라인을 추적하십시오.우리의 지표는 선호하는 추세선을 저장하여 차트를 다시 방문 할 때마다 항상 사용할 수 있도록합니다. 다목적 응용 프로그램 : 당신이 외환, 주식 또는 암호 화폐 거래에 관계없이 "기본 추세선"지표는 다양한 시장에

메타트레이더용 거래량 프로필 인디케이터로 거래량 분석의 힘을 발견하세요! / MT4 버전
기본 거래량 프로필은 거래를 최적화하려는 수동 트레이더를 위해 특별히 설계된 지표입니다. 거래량 프로필 인디케이터는 시장 움직임을 더 잘 이해하고자 하는 진지한 트레이더에게 필수적인 도구입니다. 혁신적인 솔루션을 사용하면 거래량이 가격별로 어떻게 분포되어 있는지 명확하고 간결하게 시각화할 수 있습니다. 이를 통해 지지 및 저항 수준, 누적 및 분포 영역, 주요 제어 지점과 같은 주요 관심 영역을 식별할 수 있습니다. 특정 날짜의 거래량을 나타내는 일반 거래량 표시기와 달리 기본 거래량 프로필은 특정 가격의 거래량을 보여줍니다.
이 인디케이터는 직관적이고 사용자 지정 가능한 인터페이스를 갖추고 있어 거래 선호도에 맞게 조정할 수 있습니다.
특징 가격 차트에 거래량 프로필을 명확하게 표시합니다. 거래량이 많은 영역과 적은 영역을 빠르게 식별합니다. 트레이딩 스타일에 맞게 색상과

TPA True Price Action indicator reveals the true price action of the market makers through 100% non-repainting signals strictly at the close of a candle!
TPA shows entries and re-entries, every time the bulls are definitely stronger than the bears and vice versa. Not to confuse with red/green candles. The shift of power gets confirmed at the earliest stage and is ONE exit strategy of several. There are available now two free parts of the TPA User Guide for our customers. The first "The Basics"

시장 동향에 대한 명확한 통찰력을 제공하도록 설계된 Heiken Ashi 양초는 노이즈를 필터링하고 잘못된 신호를 제거하는 기능으로 유명합니다. 혼란스러운 가격 변동에 작별을 고하고 더 매끄럽고 신뢰할 수 있는 차트 표현을 만나보세요. Quantum Heiken Ashi PRO를 정말 독특하게 만드는 것은 전통적인 촛대 데이터를 읽기 쉬운 색상 막대로 변환하는 혁신적인 공식입니다. 빨간색과 녹색 막대는 각각 약세와 강세 추세를 우아하게 강조하여 잠재적 진입점과 퇴장점을 매우 정확하게 파악할 수 있습니다.
Quantum EA 채널: 여기를 클릭하세요
MT4 버전: 여기를 클릭하세요
이 놀라운 지표는 다음과 같은 몇 가지 주요 이점을 제공합니다. 선명도 향상: Heiken Ashi 바는 가격 변동을 완화하여 시장 추세를 보다 명확하게 나타내므로 유리한 거래 기회를 쉽게 식별할 수 있습니다. 소음 감소: 종종 잘못된 신호로 이어지는 불규칙한 가격 변동

The indicator displays volume clusters or volume profiles to choose from. For trading symbols which contain the tape of deals, the indicator can perform calculations based on the tape of deals.
Input variables
StepPoint - cluster step in points, if the value is zero, the step is assigned automatically. HistoryTicks - size of tick history (for VolumeType in the mode TimeAndSales). AssociatedTimeframe - binding the indicator to the specified timeframe of the chart, if the value is equal to

Magic Candles 는 현재 시장 단계(상승 추세, 하락 추세 또는 보합)를 식별할 수 있는 신제품입니다.
이 표시기는 시장의 현재 상태에 따라 다양한 색상으로 막대를 표시하고 경고를 통해 사용자에게 추세 변화에 대한 신호를 보냅니다.
Magic Candles 는 통화(암호화폐 포함) 및 바이너리 옵션 거래에 적합합니다.
장점 스캘핑 및 일중 거래에 적합합니다. 표시기는 다시 그리지(재계산) 않으며 신호는 "막대 닫기"에서만 생성됩니다. 독립형 도구로 사용하거나 다른 지표와 함께 사용할 수 있습니다. 새로운 지표 신호에 대해 이메일 및 모바일 장치로 알림 시스템. 간단한 표시기 설정, 최소 매개변수. 모든 금융 상품 및 시장에서 작동합니다.
제품 사용 방법 마지막 양초의 색상이 회색에서 빨간색으로 바뀌면 매도 주문을 개시합니다.
캔들 색상이 회색에서 녹색으로 바뀌면 매수 주문을 개시합니다.
회색 막대가 나타나면 플랫이 예상되는 대로 미결 주문을 마감합

Breakthrough Solution For Trend Trading And Filtering With All Important Features Built Inside One Tool! Trend PRO's smart algorithm detects the trend, filters out market noise and gives entry signals with exit levels. The new features with enhanced rules for statistical calculation improved the overall performance of this indicator.
Important Information Revealed Maximize the potential of Trend Pro, please visit www.mql5.com/en/blogs/post/713938
The Powerful Expert Advisor Version
Automa

RSI / TDI 알림 대시보드를 사용하면 거래하는 모든 주요 쌍에서 RSI를 한 번에(귀하가 선택 가능) 모니터링할 수 있습니다.
두 가지 방법으로 사용할 수 있습니다.
1. 여러 시간 프레임을 선택하면 일반적인 거래 조건을 넘어 확장된 여러 시간 프레임이 있을 때 대시가 표시됩니다. 가격이 여러 기간에 걸쳐 과매수 또는 과매도 수준에 도달하여 최근에 가격이 크게 밀리고 있으므로 곧 철회 또는 반전이 예정되어 있음을 나타내는 훌륭한 지표입니다.
2. 하나의 기간(당신이 가장 선호하는 거래)과 여러 RSI 수준을 사용하여 해당 기간에 RSI 확장의 강도를 보여줍니다. 이것은 가격이 너무 오랫동안 한 방향으로 매우 세게 밀렸고 시장이 차익실현을 해야 할 때 평균 회귀 거래를 취하기 위한 훌륭한 전략입니다. 예시 스크린샷에서 H4 RSI가 25레벨을 넘어 2쌍으로 확장된 것을 볼 수 있습니다. 이는 일반적인 가격 조치보다 훨씬 더 멀리 있기 때문에 매수할 좋은 기회입니다

Protect against whipsaws: revolutionize your swing trading approach Special Offer: Purchase now to receive free bonuses worth $159! (Read more for details) Swing Trading is the first indicator designed to detect swings in the direction of the trend and possible reversal swings. It uses the baseline swing trading approach, widely described in trading literature. The indicator studies several price and time vectors to track the aggregate trend direction and detects situations in which the market i

Dark Breakout is an Indicator for intraday trading. This Indicator is based on Trend Following strategy, providing an entry signal on the breakout. The signal is provided by the arrow, which confirms the breaking of the level. We can enter in good price with this Indicator, in order to follow the main trend on the current instrument. It is advised to use low spread ECN brokers. This Indicator does Not repaint and N ot lag . Recommended timeframes are M5, M15 and H1. Recommended working pairs
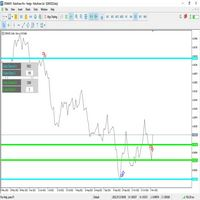
지표 - 가격 채널은 두 개의 독립적 인 가격 채널과 가격대 수준 - (A / B)로 구성됩니다. 이 지표는 가격의 동작과 움직임을 지속적으로 모니터링하고, 채널 수준 (A / B)의 고장을 지속적으로 모니터링하여 레벨을 재정렬하고 최대 및 최소의 극한의 새로운 영역을 고정합니다. 최대 및 최소값의 이전 및 현재 영역을 분석하기 위해 각 채널의 막대 수 (A / B)는 의존하지 않습니다. 그래프에서 표시기는 각 채널에 유용한 정보를 표시합니다 - (A / B) : 1. 각 채널 분석에서 지정된 막대 수. 2. 델타 - 각 채널의 레벨 사이의 거리.
1. 지표 사용의 예 : 구역의 검색 및 갱신 및 새로운 로컬 레벨의 최대 및 최소값 (상단 또는 하단)의 경우 - 채널에서 (a) 범위를 나타냅니다 - (100 - 500) 막대. 동시에, 채널 - (b) 우리는 사용하고 싶지 않은 채로 채널에 있습니다 - (b) - (0) 막대를 나타냅니다. 채널 레벨 - (b) 동시에 그래프에서
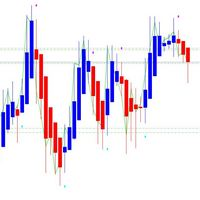
Heiken Ashi 신호 표시기는 MT5 거래 터미널을 위해 설계되었습니다. 표준 Heiken Ashi 표시기는 MT5 터미널을 기반으로합니다. 이 표시기는 매뉴얼 및 저작권 고문의 자동 거래에 사용할 수 있습니다. Heiken Ashi 신호 표시기를 사용하려면 거래 전문가에게는 시장에 진입하고 구매 및 판매 위치를 열기위한 신호 버퍼가 있습니다. 아래에 대해 자세히 읽어보십시오.
Heiken Ashi 신호 지표의 기회와 특성 : 표시기는 일정에 따라 작동합니다. (통화 쌍, 금속, 주식, 지수, 암호 화폐). 시장에 진입하기위한 기초로 신호를 받고 전략에 대한 고문에 신청하십시오. 시간이 지남에 따라 그는 추세가 시작될 때 가격의 전환에 반응하고 지연없이 신호를 제공합니다. 신호가 나타나면 이미 고정되어 있으며 일정에서 사라지지 않습니다. 표시기는 인근 막대에서 신호를 다시 그리지하지 않으며 막대에서 위아래로 이동하지 않습니다. 구매하기 전에 데모 버전을 다운로드하고 모든

The megaphone pattern is another chart pattern used for technical analysis. There is usually a lot of volatility happening when you spot it in the wild….and volatility equals opportunity in the world of trading. This pattern is famous for its “broadening formation” and the price action also warns of the increased risk ahead. The megaphone chart pattern provides unique entries and exits off different sides of its structure.
[ Installation Guide | Update Guide | Troubleshooting | FAQ | All Pro

Unlock hidden profits: accurate divergence trading for all markets Special Offer: Purchase now to receive free bonuses worth $159! (Read more for details) Tricky to find and scarce in frequency, divergences are one of the most reliable trading scenarios. This indicator finds and scans for regular and hidden divergences automatically using your favourite oscillator. [ Installation Guide | Update Guide | Troubleshooting | FAQ | All Products ]
Easy to trade
Finds regular and hidden divergences

Introduction to Fractal Pattern Scanner Fractal Indicator refers to the technical indicator that makes use of the fractal geometry found in the financial market. Fractal Pattern Scanner is the advanced Fractal Indicator that brings the latest trading technology after the extensive research and development work in the fractal geometry in the financial market. The most important feature in Fractal Pattern Scanner is the ability to measure the turning point probability as well as the trend probabil

안녕하세요, 이것은 빙입니다. ICT 개념을 거래하기 위한 신뢰할 수 있는 지표를 찾고 있다면, ICT Market Structure는 보다 고급 전략을 사용하는 트레이더들을 위한 사용자 매뉴얼을 제공합니다. 이 올인원 지표는 ICT 개념(스마트 머니 개념)에 초점을 맞추고 있습니다. ICT Market Structure는 기관들이 어떻게 거래하는지 이해하려고 하며, 그들의 움직임을 예측하는 데 도움이 됩니다. 이 전략을 이해하고 활용함으로써, 트레이더들은 시장 움직임에 대한 귀중한 통찰력을 얻고 가격 행동에 기반한 더 실용적인 진입 및 청산 포인트를 찾을 수 있습니다. 다음은 일부 기능에 대한 간단한 소개입니다: 비재페인팅, 비리드로잉, 비래깅 지표 오더 블록(상승 및 하락), 볼륨 메트릭스와 얼럿이 있는 오더 블록 실시간 시장 구조와 스윙 구조 고점과 저점(HH, HL, LL, LH)과 얼럿이 있는 구조 붕괴(BOS), 성격 변화(CHoCH)/ 모멘텀 변화(MS) 브레이커 블록

Currency RSI Scalper MT5는 널리 사용되는 RSI(Relative Strength Index) 지표를 기반으로 하는 전문 지표입니다. RSI 지표는 시장의 간격에 대해 잘 작동하지만 시장 상황이 변할 때 수익성있는 신호를 생성하지 못하므로 큰 손실을 초래하는 잘못된 신호를 생성합니다. 시장 상황에 따라 적응하는 적응형 RSI 지표에 대해 생각해 본 적이 있습니까? 제시된 지표는 최고의 과매수 및 과매도 수준을 찾는 최적화 알고리즘을 구현합니다. 이를 통해 Currency RSI Scalper는 끊임없이 변화하는 시장에 적응할 수 있습니다. 매수 또는 매도 신호가 나타나면 차트에 화살표가 그려지고 경고가 발생하여 적시에 포지션을 열고 항상 PC에 앉아 있는 것을 피할 수 있습니다. Currency RSI Scalper는 통화(암호화폐 포함) 및 바이너리 옵션 거래에 적합합니다.
Currency RSI Scalper를 선택하는 이유 지표는 스캘핑 및 일중 거래에

ADR 반전 표시기는 가격이 정상적인 일일 평균 범위와 관련하여 현재 거래되고 있는 위치를 한 눈에 보여줍니다. 가격이 평균 범위를 초과하고 선택한 수준보다 높을 때 팝업, 이메일 또는 푸시를 통해 즉각적인 알림을 받을 수 있으므로 신속하게 철회 및 반전에 뛰어들 수 있습니다. 지표는 평균 일일 범위 극단에서 차트에 수평선을 그리고 가격이 초과하는 수학적 확률이 첨부된 수준 위의 확장을 그립니다. 자세한 내용은 아래에서... 표시기를 보완하고 모든 쌍을 모니터링하기 위한 ADR 경고 대시보드: https://www.mql5.com/en/market/product/66316
MT4 버전도 여기에서 사용 가능: https://www.mql5.com/en/market/product/62757
시간의 약 60%는 가격이 정상적인 일일 평균 범위(ADR) 내에서 거래되고 이 수준 이상으로 상승하면 일반적으로 급격한 가격 변동의 지표이며 일반적으로 이에 따라 후퇴(이익 차감) 움직임이

"TPA Sessions" indicator is a very important tool to complement "TPA True Price Action" indicator . Did you ever wonder, why many times the price on your chart suddently turns on a position you can't explain? A position, where apparently no support or resistance level, or a pivot point, or a fibonacci level is to identify? Attention!!! The first run of the TPA Session indicator must be in the open market for the lines to be drawn correctly.
Please visit our blog to study actual trades wit

당신에게 소개하는 iVISTscalp5 지표는 독특하면서도 거래 작업에서 효과적입니다. 이 지표는 시간 데이터를 기반으로 하며 금융 시장의 많은 경험과 깊은 분석의 결과입니다. iVISTscalp5 지표는 수동 거래에 뛰어난 도구입니다. 편리성, 간단함 및 시각화 - 모든 복잡성은 숨겨져 있습니다. 우리는 iVISTscalp5 지표의 설정과 사용을 최대한 단순화했습니다. 이 지표는 MT5 터미널에서 가지고 있는 모든 금융 상품에 적합합니다. 시간 기준으로 작동하는 시간은 4am에서 8pm (UTC+3)입니다. iVISTscalp5 지표 메뉴 (스크린샷 1 참조): History - 표시할 주간 수 계산 dT_min - 시간 설정 간격 선택 (분) TFline - 수평 볼륨 생성 (타임프레임) BARSline - 수평 볼륨 생성 (바 수) TFtrend1 - 매일 채널 생성 (타임프레임) BARStrend1 - 매일 채널 생성 (바 수) TFtrend2 - 주간 채널 생성 (타임프레임

ADX 지표는 추세와 강도를 결정하는 데 사용됩니다. 가격의 방향은 +DI와 -DI 값으로 표시되며, ADX 값은 추세의 강도를 나타냅니다. +DI가 -DI보다 높으면 시장은 상승 추세에 있고, 반대로이면 하락 추세에 있습니다. ADX가 20 미만이면 명확한 방향이 없습니다. 지표가 이 수준을 돌파하자마자 중간 강도의 추세가 시작됩니다. 40보다 큰 값은 강한 추세(하락 추세 또는 상승 추세)를 나타냅니다.
평균 방향 이동 지수(ADX) 지표의 다중 통화 및 다중 시간대 수정. 매개변수에서 원하는 통화와 기간을 지정할 수 있습니다. 또한 지표는 추세 강도 수준이 교차할 때, 그리고 +DI 및 -DI 선이 교차할 때 알림을 보낼 수 있습니다. 마침표가 있는 셀을 클릭하면 해당 기호와 마침표가 열립니다. MTF 스캐너입니다.
통화 강도 측정기(CSM)와 마찬가지로 대시보드는 지정된 통화가 포함된 쌍 또는 해당 통화가 기본 통화로 포함된 쌍을 자동으로 선택할 수 있습니다. 표시기

Welcome to Propsense, the best solution for new and veteran traders with a simple FREE strategy! NEW to MT5! This indicator is a unique and affordable trading tool built on the teachings of a former bank trader. With this tool, you will be able to see inefficient points with ease. Additionally, traders will have a clean Heads Up Display which will show your running and closed P/L in pips AND currency units. As a highly requested option, a candle timer has been added which will allow you to j

자동화된 수요 및 공급 구역의 차세대. 모든 차트에서 작동하는 새롭고 혁신적인 알고리즘. 모든 구역은 시장의 가격 움직임에 따라 동적으로 생성됩니다.
두 가지 유형의 경고 --> 1)가격이 영역에 도달할 때 2)새로운 영역이 형성될 때
당신은 더 이상 쓸모없는 지표를 얻을 수 없습니다. 입증된 결과로 완벽한 거래 전략을 얻을 수 있습니다.
새로운 기능:
가격이 공급/수요 영역에 도달하면 경고
새로운 공급/수요 구역이 생성되면 알림
푸시 알림 알림
핍의 영역 너비 레이블
기동특무부대에 한 번 더 시간이 주어집니다. 따라서 현재보다 위의 2개의 시간 프레임 대신 현재보다 높은 3개의 시간 프레임을 볼 수 있습니다.
Alerts/Zones/MTF 기능을 활성화/비활성화하는 버튼
당신이 얻는 이점:
거래에서 감정을 제거하십시오.
거래 항목을 객

KT Custom High Low shows the most recent highs/lows by fetching the data points from multi-timeframes and then projecting them on a single chart. If two or more highs/lows are found at the same price, they are merged into a single level to declutter the charts.
Features
It is built with a sorting algorithm that declutters the charts by merging the duplicate values into a single value. Get Highs/Lows from multiple timeframes on a single chart without any fuss. Provide alerts when the current

3 Indicators in 1 indicator
Strategy based on price action
Made specifically for the best forex currency pairs
Can be used in the best time frame of the market
at a very reasonable price This indicator is basically 3 different indicatos . But we have combined these 3 indicators in 1 indicator so that you can use 3 indicators at the lowest price.
All three strategies are based on price action. But based on different trends. Long term, medium term and short term
Attributes : No repaintin
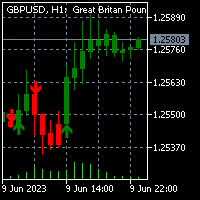
To get access to MT4 version please click here . This is the exact conversion from TradingView: "UT Bot Alerts" by "QuantNomad". This is a light-load processing and non-repaint indicator. Buffers are available for processing in EAs. You can message in private chat for further changes you need. Here is the source code of a simple Expert Advisor operating based on signals from UT Bot Alerts . #include <Trade\Trade.mqh> CTrade trade; int handle_utbot= 0 ; input group "EA Setting" input int magic_

Was: $69 Now: $34 Blahtech VWAP - Volume Weighted Average Price (VWAP) is the ratio of price to total volume. It provides an average price over a specified time interval. Links [ Install | Update | Documentation ] Feature Highlights
Configurable VWAP Line Sessions, intervals, anchored or continuous Previous day settlement line Standard Deviation bands Alerts at bar close or real time Automatic Broker or Tick volumes Significantly reduced CPU usage
Input Parameters
Expert Advisor

This is the forex visual orders tool & forex position size (lot) calculator with intuitive panel. Risk Reward Ratio Indicator works on all kind of symbols: currency pairs, indices, metals, commodities, cryptocurrencies, etc.
If you want to make sure that Risk Reward Ratio Indicator works on your favorite symbols contact us ( visit our profile ) and ask for 7-day free trial to test this tool without limits. If you want to place orders easier, faster and more intuitive? If you like to mark tr

Golden Sniper Indicator 를 소개합니다. 이는 트레이더들이 거래 경험을 향상시키고자 하는 강력한 MQL5 도구입니다. 6년 이상의 경험을 가진 팀에 의해 개발되었으며, 이 인디케이터는 뛰어난 정확성으로 거래 기회를 식별하는 신뢰할 수 있는 방법을 제공합니다. 주요 기능 : 알림 및 시그널 화살표 : Golden Sniper Indicator는 적시에 알림과 시각적인 시그널 화살표를 제공하여 트렌드 반전을 식별하는 데 도움이 됩니다. 리스크 관리 : Risk-Reward Ratio (RRR)를 기반으로 적절한 이익 실현 및 손실 제한 수준을 제안합니다. 적응성 : 초보자든 전문 트레이더든 이 인디케이터는 스윙 트레이딩과 스캘핑을 포함한 다양한 거래 스타일에 적응됩니다. 사용자 정의 가능한 설정 : 인디케이터를 사용자의 선호에 맞게 조정할 수 있습니다. 추천 사항 : 타임프레임 : Golden Sniper Indicator는 모든 타임프레임에서 잘 작동합니다. 스캘핑

이 다중 시간 프레임 및 다중 기호 표시기는 다음 5개의 십자가를 식별할 수 있습니다. 빠른 이동 평균이 느린 이동 평균 라인을 교차할 때. 가격이 단일 이동 평균에 도달했을 때(위/아래로 마감 또는 방금 반등). 삼중 이동 평균 형성이 나타날 때(연속 정렬의 모든 3 MA:s) MACD 메인 라인이 신호 라인을 교차할 때. 신호선이 MACD 영(0)선을 교차할 때. 고유한 규칙 및 기술과 결합하여 이 표시기를 사용하면 강력한 시스템을 생성(또는 강화)할 수 있습니다. 특징 Market Watch 창에 표시되는 선택된 기호를 동시에 모니터링할 수 있습니다. 하나의 차트에만 지표를 적용하고 전체 시장을 즉시 모니터링하십시오. M1에서 MN까지 모든 시간 프레임을 모니터링할 수 있으며 크로스오버가 식별되면 실시간 경고를 보냅니다. 모든 경고 유형이 지원됩니다. RSI를 추가 추세 필터로 사용할 수 있습니다. 표시기는 대화형 패널을 포함합니다. 항목을 클릭하면 해당 기호와 기간이 포함된

Ultra-fast recognition of parabolic channels (as well as linear, horizontal and wavy channels) throughout the depth of history, creating a hierarchy of channels. Required setting: Max bars in chart: Unlimited This indicator is designed primarily for algorithmic trading, but can also be used for manual trading. This indicator will have a very active evolution in the near future and detailed descriptions on how to apply to create robots

If you want to find good trading opportunities, then you must trade near the Trend Line. This allows you to have a tighter stop loss on your trades — which improves your risk to reward . But that’s not all… Because if you combine Trend Line with Support and Resistance, that’s where you find the best trading opportunities. Now you might wonder: “So when do I enter a trade?” Well, you can use reversal candlestick patterns (like the Hammer, Bullish Engulfing, etc.) as your e

This LEGIT Indicator Can Accurately Predict the Outcome of One Bar.
Imagine adding more filters to further increase your probability!
Unlike other products, Binary Options PRO can analyze past signals giving you the statistical edge.
How Increase Your Probability
Information revealed here www.mql5.com/en/blogs/post/727038 NOTE: The selection of a Good Broker is important for the overall success in trading Binary Options.
Benefits You Get
Unique algorithm that anticipates price weaknes
Zig Zag Multi Time Frame Indicator counts in how many consecutive candlesticks the current Zig Zag "lit" on the different Time Frames. It can be used for both trend signal strategies and range breakout strategies. Shows simultaneously on all Frames in how many candles we have had Zig Zag value in the current swing. The Zig Zag period can be adjusted in the Indicator settings.

The indicator shows when there are overprice and divergences on the RSI. In addition, it has configurable alerts, dynamic overprice levels and a special “RSI cleaner” function. The indicator that automatically calculates the premium rates! RSImaxmin is an indicator based on the Relative Strength Index (RSI) oscillator that effectively identifies changes in price trends as it reflects the relative strength of bullish movements compared to bearish movements. It is widely used by traders to measur

Matreshka self-testing and self-optimizing indicator: 1. Is an interpretation of the Elliott Wave Analysis Theory. 2. Based on the principle of the indicator type ZigZag, and the waves are based on the principle of interpretation of the theory of DeMark. 3. Filters waves in length and height. 4. Draws up to six levels of ZigZag at the same time, tracking waves of different orders. 5. Marks Pulsed and Recoil Waves. 6. Draws arrows to open positions 7. Draws three channels. 8. Notes support and re

The indicator shows when there are overpricing and divergences over a normalized MACD Plus, it displays signals with configurable alerts, self-regulating dynamic overprice levels, and a simple setup and interface. The indicator that automatically calculates overprices ranges! MACDmaxmin is an indicator based on the MACD oscillator that effectively identifies trend changes in price, as it is a momentum indicator that captures the trend and shows the relationship between two moving averages of th

Multi-currency and multitimeframe Heikin Ashi indicator. Shows the current state of the market. On the scanner panel you can see the direction, strength and number of bars of the current trend. The Consolidation/Reversal candles are also shown using color. You can specify any desired currencies and periods in the parameters. Also, the indicator can send notifications when the trend changes or when reversal and consolidation candles (dojis) appear. By clicking on a cell, this symbol and period wi

이 지표는 지그재그 지표, 거래 세션, 프랙탈 또는 양초(비표준 기간 포함: 연도, 6개월, 4개월, 3개월, 2개월)(자동 Fibo 되돌림)를 기반으로 피보나치 레벨을 자동으로 그립니다. 피보나치 계산을 위해 더 높은 기간을 선택할 수 있습니다. 현재 막대가 닫힐 때마다 레벨이 다시 그려집니다. 지정된 수준을 넘을 때 경고를 활성화하는 것이 가능합니다.
기록의 수준을 분석할 수도 있습니다. 이를 위해서는 "과거 Fibo 수" 매개변수에서 Fibo 수준 수를 지정해야 합니다.
매개변수 Calculate Fibo according to — Fibo 검색 모드에 따라 Fibo를 계산합니다. Candles (High-Low) — 고저를 기반으로 Fibo를 구축합니다. Candles (Close-Close) — 닫기-닫기를 기반으로 Fibo를 구축합니다. ZigZags — ZigZag 포인트로 fibo를 구축합니다. Sessions — 거래 세션을 통해 fibo를 구축합니다

인디케이터는 가장 적절한 진입 및 청산 지점을 보여줍니다. 또한 더 나은 거래 분석을 위해 모든 신호에 대한 통계 데이터를 표시합니다.
이 지표의 도움으로 시장을 더 잘 이해할 수 있습니다.
추세의 힘이 약해지기 시작하면 (패널에 표시됨) 추세선이 수평 위치로 끌리게되며 이것이 거래를 종료하라는 신호입니다. 또는 평균 / 중간 수익 수준에 도달하면 종료 할 수 있습니다.
이 인디케이터는 2010년 이후 제 트레이딩 경험의 결과입니다. MT4용 인디케이터 버전
특징 이 인디케이터는 다시 그려지지 않습니다. 과거 차트에 인쇄된 내용도 실시간으로 인쇄됩니다. 암호화폐, 주식, 금속, 지수, 원자재, 통화 등 모든 자산 거래에 사용할 수 있습니다. 모든 차트주기에 사용할 수 있습니다. 진입 신호는 새 캔들이 열릴 때 나타납니다. 거래 종료 신호는 더 큰 수익으로 거래를 종료할 수 있는 경우가 많기 때문에 잠정적으로 제공됩니다. 왼쪽 상단에는 최소화 할 수있는 자세한 거래 통

Robust median Renko style indicator for creating custom charts resembling Median Renko, Mean Renko, Turbo Renko and Better Renko candles as well as vanilla Renko with wicks plus Point-O charts. This all in one package provides all of the signals needed by day traders, scalpers, and even long-term traders.
Main characteristics The indicator is an overlay on the main chart so it is possible to utilize one-click trading and order manipulation directly on the custom charts. Visual order placement

Multicurrency and multitimeframe indicator of the Standard Deviation Channel. Displays the current direction of the market. On the panel, you can see breakouts and touches (by price) of the levels of the linear regression channel. In the parameters, you can specify any desired currencies and timeframes. Also, the indicator can send notifications when levels are touched. By clicking on a cell, this symbol and period will be opened. This is MTF Scanner. The key to hide the dashboard from the char

차트에 지지 및 저항 수준과 추진 캔들 갭을 자동으로 그려주므로 다음 가격 방향 및/또는 잠재적 반전 가능성을 확인할 수 있습니다.
이 보조지표는 제 웹사이트(시장 구조 트레이더)에서 가르치는 포지션 트레이딩 방법론의 일부로 사용하도록 설계되었으며 타겟팅 및 잠재적 진입을 위한 주요 정보를 표시합니다. MT4 Version: https://www.mql5.com/en/market/product/97246/ 이 보조지표에는 2가지 핵심 기능과 4가지 추가 기능이 있습니다: 핵심 기능 1 - 일일, 주간 및 월간 시간대의 자동 지지선 및 저항선 이 인디케이터는 지난 2일에서 최대 6주 및 몇 달 전의 가장 최근 지원 및 저항 수준을 자동으로 가져옵니다. 이러한 레벨의 모양을 원하는 대로 완전히 사용자 지정하고 표시되는 레벨 수를 표시할 수 있습니다. 이러한 주요 레벨은 종종 가격이 하락하거나 반전되는 주요 지지 및 저항 구간으로 작용합니다. 또한 가격이 향할 목표가 되기도 하므로

For MT4 version please click here . This is the exact conversion from TradingView: "Range Filter 5min" By "guikroth". - This indicator implements Alerts as well as the visualizations. - Input tab allows to choose Heiken Ashi or Normal candles to apply the filter to. It means it is a (2 in 1) indicator. - This indicator lets you read the buffers for all data on the window. For details on buffers please message me. - This is a non-repaint and light processing load indicator. - You can message in p

Introducing the BOOM CRASH MASTER Indicator: Unleash the Power of Precision Trading! Step into the world of unparalleled trading with the BOOM CRASH Master Indicator, exclusively designed for the Boom and Crash indices offered by Deriv broker. This cutting-edge tool is your gateway to mastering the art of spike detection and anti-spike entries, ensuring you stay ahead of the market’s every move. Key Features: Precision Spike Detection: Harness the power of advanced algorithms to catch spikes wi

Dark Absolute Trend is an Indicator for intraday trading. This Indicator is based on Trend Following strategy but use also candlestick patterns and Volatility. We can enter in good price with this Indicator, in order to follow the main trend on the current instrument. It is advised to use low spread ECN brokers. This Indicator does Not repaint and N ot lag . Recommended timeframes are M5, M15 and H1. Recommended working pairs: All. I nstallation and Update Guide - Troubleshooting

SMT (Smart Money Technique) Divergence refers to the price divergence between correlated assets or their relationship to inversely correlated assets. By analyzing SMT Divergence, traders can gain insights into the market's institutional structure and identify whether smart money is accumulating or distributing assets. Every price fluctuation should be confirmed by market symmetry, and any price asymmetry indicates an SMT Divergence, suggesting a potential trend reversal. MT4 Version - https:/
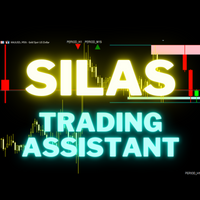
Silas is a trading assistant for multi-timeframes traders. It show on the screen, in a very clear way, all the informations needed to suits to your trading. It show : - Supply and demand zone from 2 timeframes of your choice - Setups based of market structure from 2 timeframes of your choice - Daily current high and low points - The last 2 closed candles and the current candle from an higher time frame on the right of the graph. - Actual daily candle on the left Everything is customisable !

The Market Structure Analyzer is a powerful tool designed for traders who follow market structure and smart money concepts. This comprehensive indicator provides a suite of features to assist in identifying key market levels, potential entry points, and areas of liquidity. Here's what it offers:
1. Swing High/Low Detection : Accurately identifies and marks swing highs and lows, providing a clear view of market structure.
2. Dynamic Supply and Demand Zones: Draws precise supply and demand zo
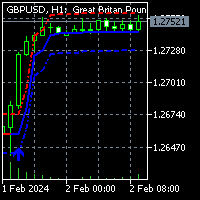
To get access to MT4 version please click here . This is the exact conversion from TradingView: "HalfTrend" by "Everget". This is a light-load processing indicator. This is a non-repaint indicator. Buffers are available for processing in EAs. All input fields are available. You can message in private chat for further changes you need. Thanks for downloading

MetaBands uses powerful and unique algorithms to draw channels and detect trends so that it can provide traders with potential points for entering and exiting trades. It’s a channel indicator plus a powerful trend indicator. It includes different types of channels which can be merged to create new channels simply by using the input parameters. MetaBands uses all types of alerts to notify users about market events. Features Supports most of the channel algorithms Powerful trend detection algorith

Twin Peak Indicator MT5에 오신 것을 환영합니다 --(Double Top/Bottom)-- Double Top and Bottom Indicator는 시장에서 잠재적인 반전 패턴을 식별하도록 설계된 기술 분석 도구입니다.
가격이 거의 같은 높이의 연속적인 고점 또는 저점을 만든 다음 반대 방향으로 가격이 움직이는 영역을 식별합니다.
이 패턴은 시장이 모멘텀을 잃고 있으며 추세 반전에 대비할 수 있음을 나타냅니다. *구매 후 저에게 연락하시면 지침 및 단계 안내를 보내드립니다. 특징:
자동 차트 주석: 표시기는 차트에서 이중 상단 및 하단 패턴을 자동으로 표시합니다. 사용하기 쉬움: 지표는 사용자 친화적이며 MT5 플랫폼의 모든 차트에 쉽게 적용할 수 있습니다. 사용자 지정 가능: 표시기에는 사용자 지정 가능한 설정이 있습니다. 사용자 지정이 포함된 알림 . 모든 악기에서 작동합니다. 이 지표는 다른 기술 분석 도구와 함께 사용하여 추세의 방

Live Trading Results MT4 Version Contact for Manual Guide Next Price $125 Free Scanner Dashboard (Contact me)
Strategy - Breakout / Retest / Aggressive Hello Everyone, We are excited to introduce one of the most reliable and high win rate patterns in trading: the Cup and Handle . This is the first time we are releasing this meticulously crafted indicator, boasting an impressive 95% success rate . It is versatile and effective across all types of pairs, stock

The Price Action Finder Multi indicator is an indicator of entry points that searches for and displays Price Action system patterns on dozens of trading instruments and on all standard time frames: (m1, m5, m15, m30, H1, H4, D1, Wk, Mn). The indicator places the found patterns in a table at the bottom of the screen. By clicking on the pattern names in the table, you can move to the chart where this pattern is located. Manual (Be sure to read before purchasing) | Version for MT4 Advantages
1. Pa

Elliott Wave Trend was designed for the scientific wave counting. This tool focuses to get rid of the vagueness of the classic Elliott Wave Counting using the guideline from the template and pattern approach. In doing so, firstly Elliott Wave Trend offers the template for your wave counting. Secondly, it offers Wave Structural Score to assist to identify accurate wave formation. It offers both impulse wave Structural Score and corrective wave Structure Score. Structural Score is the rating to sh
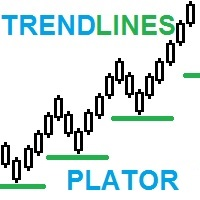
트렌드플레이터: 최적화된 거래 전략을 위한 강력한 추세 예측 지표 우리의 새로운 지표의 힘을 발견하세요! 더 큰 시간 프레임의 추세선을 계산하고 현재 시간 프레임에 직접 예측하여 모든 트레이더의 주목을 끄는 전략적인 지원을 제공합니다. 이러한 포인트는 거래에 강력한 지지나 저항 수준이 되어 거래 전략을 촉진합니다. Price action 지표 컬렉션에 완벽하게 부가되는 지표에 대한 액세스를 상상해보세요. 우리의 새로운 지표가 바로 그것입니다! 테스트해 보고 그 정확성에 놀라워하십시오. 이는 당신의 전략에 부족한 조각이 될 수 있으며 결과를 향상시킬 수 있습니다. 시간을 낭비하지 마세요! 이 멋진 도구를 거래 아카이브에 추가하는 기회를 활용하십시오. 그 가치와 잠재력을 인정한다면 지금 구매하는 것을 망설이지 마십시오. 강력한 지표와 함께 성공의 새로운 수준에 도달하여 정확도를 높이세요! 새로운 소식을 놓치지 마세요 독점적인 출시 소식을 받으려면 지금 가입하세요. 프란시스코 고메스 다


The Engulf Seeker indicator is a powerful tool designed to detect engulfing candlestick patterns with precision and reliability. Built on advanced logic and customizable parameters, it offers traders valuable insights into market trends and potential reversal points.
Key Features and Benefits: Utilizes revised logic to analyze previous candles and identify strong bullish and bearish engulfing patterns. Convenient arrow-based alert system notifies traders of pattern occurrences on specific symb

The Chart Overlay indicator displays the price action of several instruments on the same chart allowing you to evaluate how differently currency pairs fluctuate relative to each other. [ Installation Guide | Update Guide | Troubleshooting | FAQ | All Products ]
Find overbought or oversold currency pairs easily Plot up to six currency pairs overlayed on the same chart Display inverted symbols if necessary Adapt to chart size, zoom and timeframe Automatic price level calculation Customizable p
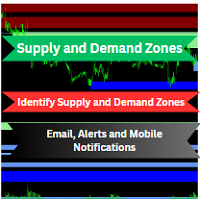
This powerful Indicator can automatically identify supply and demand zones and send you alerts, email and push notification on mobile whenever a new zone is created or when the price enters a specific zone.
This indicator integrates with any timeframe and chart or currency pair, ensuring its versatility across your trading endeavors. Supply & Demand Zones Finder(SDZF) indicator seamlessly identifies proven supply and demand zones, areas where price has consistently found support or resistanc

To get access to MT4 version please click here . This is the exact conversion from TradingView: "SwingArm ATR Trend Indicator" by " vsnfnd ". Also known as : "Blackflag FTS" by "Jose Azcarate" This is a light-load processing and non-repaint indicator. All input options are available except multi time frame. Buffers are available for processing in EAs. Extra option to show buy and sell signal alerts. You can message in private chat for further changes you need.

This is advanced Multi-Symbol and Multi-Timeframe version of the "Candle Pattern Finder" indicator (search for candlestick patterns based on the book by Gregory L. Morris "Candlesticks charting explained. Timeless techniques for trading stocks and futures" ). The indicator searches for candlestick patterns for ALL symbols of the "Market Watch" window and for ALL standard timeframes from M1 to MN1. When patterns appear on any symbol / timeframe, the indicator gives a signal (text, sound, sending

Quarterly Cycles
Quarterly Cycles is based on the Quarterly Theory developed by Daye ( traderdaye on X ). This is an aid to the user to find Cycles and it is NOT automatic detected, user can select AMDX or XAMD in each Cycle and it will be visually drawn on the chart. Quarterly Cycles: Yearly, Monthly, Weekly, Daily, 6 Hour (90 minutes)
– Yearly Cycle : The year is divided in four sections of three months each Q1 - January, February, March Q2 - April, May, June Q3 - July, August, Sept

Smart Liquidity Levels is a valuable tool for identifying optimal liquidity levels, enabling retail traders like us to strategically set our stop-loss orders. T he essential tool for traders seeking to maximize their trading success. The liquidity level is a critical component of inner circle trading (ICT). It assists us in determining when and how we should enter the market. Watch the video for detailed instructions. Here's why understanding liquidity levels is crucial in trading and how our

Are You Tired Of Getting Hunted By Spikes And Whipsaws?
Don't become a victim of the market's erratic moves.. Do Something About It!
Instantly make smarter decisions with Impulse Pro's precise balance of filters and accurate statistics.
Timing Is Everything In Trading
To learn more, please visit www.mql5.com/en/blogs/post/718212 Anticipate the next big move before it unfolds in 3 Simple Steps!
Advantages You Get
Early impulse detection algorithm.
Flexible combination to different tr
MetaTrader 마켓은 개발자들이 거래 애플리케이션을 판매할 수 있는 간단하고 편리한 사이트이다.
제품을 게시하고 마켓용 제품 설명을 어떻게 준비하는가를 설명하는 데 도움이 됩니다. 마켓의 모든 애플리케이션은 암호화로 보호되며 구매자의 컴퓨터에서만 실행할 수 있습니다. 불법 복제는 불가능합니다.
트레이딩 기회를 놓치고 있어요:
- 무료 트레이딩 앱
- 복사용 8,000 이상의 시그널
- 금융 시장 개척을 위한 경제 뉴스
등록
로그인
계정이 없으시면, 가입하십시오
MQL5.com 웹사이트에 로그인을 하기 위해 쿠키를 허용하십시오.
브라우저에서 필요한 설정을 활성화하시지 않으면, 로그인할 수 없습니다.