MetaTrader 5용 유료 기술 지표 - 12

Introduction
One of the patterns in "RTM" is the "QM" pattern, also known as "Quasimodo". Its name is derived from the appearance of "Hunchback of Notre-Dame" from Victor Hugo's novel. It is a type of "Head and Shoulders" pattern.
Formation Method
Upward Trend
In an upward trend, the left shoulder is formed, and the price creates a new peak higher than the left shoulder peak . After a decline, it manages to break the previous low and move upward again. We expect the price to

SMT (Smart Money Technique) Divergence refers to the price divergence between correlated assets or their relationship to inversely correlated assets. By analyzing SMT Divergence, traders can gain insights into the market's institutional structure and identify whether smart money is accumulating or distributing assets. Every price fluctuation should be confirmed by market symmetry, and any price asymmetry indicates an SMT Divergence, suggesting a potential trend reversal. MT4 Version - https:/

The Fractals indicator displays on the chart only fractals with the specified parameters in the indicator settings. This allows you to more accurately record a trend reversal, excluding false reversals. According to the classical definition of a fractal, it is a candlestick - an extremum on the chart, which was not crossed by the price of 2 candles before and 2 candles after the appearance of a fractal candle. This indicator provides the ability to adjust the number of candles before and after t

Best Scalper Oscillator is an indicator for MetaTrader 5 based on mathematical calculations on the price chart. This is one of the most common and useful indicators for finding the trend reversal points. Best Scalper Oscillator is equipped with multiple types of notification (push notifications, emails, alerts), which allows opening trades in time.
Distinctive features Generates minimum false signals. Excellent for identifying trend reversals. Perfect for scalping. Suitable for working on th

This is the Full Version, to get the free version please contact me.
The free version works on “AUDNZD” and “XAUUSD” charts.
All symbols and time frames scanner
Head and Shoulder
One of the most popular Price Action patterns is the Head and Shoulders pattern. The pattern has three local tops that resemble the left shoulder, head, and right shoulder. The head and shoulders chart pattern appears in all kinds of markets, including Forex, cryptocurrency, commodities, stocks, and bonds. The head

This multi symbol indicator has been designed to automatically identify when price reaches major psychological levels. Also known as round numbers, whole numbers or key levels. As a bonus it can also scan for pivot point level on one selected time frame. Combined with your own rules and techniques, this indicator will allow you to create (or enhance) your own powerful system. Features Can write the signals to a file which can be used by an Expert Advisor for auto trading. Can monitor all symbols

BeST_Hull Single MA Strategy is an Metatrader Indicator based on the famous indicator Hull Mov.Average . This indicator can display the Single HMA Strategy of just 1 Hull MAvg. It uses added internal filters locating the most likely Entries while it can be used as a standalone system or as an add-on to other ones.
Generally the Hull Moving Average (HMA - developed by Alan Hull) is a directional trend indicator . It captures the current state of the market and uses recent price action to determin

Volume pressure and oscillator overbougth - oversold condition togedther. Signals appears on chart. Turnig points, trading ranges, support- resistance levels also. Change parameters in the trendscalp settings. TTF bars can be set: 8, or, 15, or 45, 150. Greather periods are very useful at strong support - resistance areas. IF ONE OF OUR FREE INDICATOR IS NICE TO YOU, FEEL FREE TO BUY AT LEAST OUR CHIEPST PRODUCT TO DONATE US. "Lots of small peace can be a mountain" ( nathan rothschild, john len
What is a Point of Interest? Traders who follow Smart Money Concepts may call this a Liquidity Point, or areas pools of liquidity have been built up by retail traders for for Big Banks to target to create large price movements in the market. As we all know, retail traders that use outdated and unreliable methods of trading like using trendlines, support and resistance, RSI, MACD, and many others to place trades and put their stop losses at keys points in the market. The "Big Banks" know these me

Defining Range ( DR ) and Implied Defining Range ( IDR ) indicator Pro with added features from free version
Show DR and IDR ranges Sessions on the chart for RDR Regular defining range (New York Session)
ADR After defining range (Asian session) ODR Outside defining range (London Session)
Buttons on chart to enable / disable :
Show Imbalance ( IMB ) Show Volume Imbalance ( VIB ) Show Gap's between open and close
Show Standard Deviation ( SD )
Show last 3 Sessions or Back

The ICT Unicorn Model indicator highlights the presence of "unicorn" patterns on the user's chart which is derived from the lectures of "The Inner Circle Trader" (ICT) .
Detected patterns are followed by targets with a distance controlled by the user.
USAGE (image 2) At its core, the ICT Unicorn Model relies on two popular concepts, Fair Value Gaps and Breaker Blocks. This combination highlights a future area of support/resistance.
A Bullish Unicorn Pattern consists out of:

MA Alert Indicator
You do not need anymore to constantly and tediously look at the chart . If your strategy uses any type of moving average with any settings, just add this indicator to the chart according to your required settings
You will be notified whenever the price hits your MA , whether touch or candle close by crossing it. Also, an arrow symbol will be displayed on the chart based on movement.
If you d o not have access to your computer, just set your MetaTrader notification by the
Heikin Ashi candlesticks smooth out the price data to help traders spot trends and patterns in the market. By averaging the price values, these candlesticks provide a clearer visual representation, making it easier to identify trends and predict future movements without the noise of standard candlesticks. We at Minions Labs are revisiting this topic because of our fellow Swing Traders, who love Heikin Ashi.
WHY SHOULD I CARE about the Smart Heikin Ashi? The Smart Heikin Ashi is an innovative to

DETECT THE TREND AND THE BEST PRICE TO ENTER A TRADE
Trend Detection for perfect entry - Distinguish the direction of thetrend and its strength, showing a line of different colors depending on whether the trend is strong bullish, weak bullish, strong bearish or weak bearish.- Best Entry point for perfect entry - Shows an area with the best entry in favor of trend. Never trade against the trend again.
Entry signals and alerts - When the price is in a valid zone, it sends pop up alerts, telephon

The Heikin Ashi Delta Pro leverages the refined elegance of Heikin Ashi candlesticks, renowned for their ability to filter market noise and highlight clearer trends and reversals. Building on a solid foundation, this advanced indicator integrates the Hull Moving Average method, enhancing its precision and responsiveness. Alongside an intuitive alert system, it transforms raw market data into actionable trading insights, empowering traders to make more informed decisions swiftly. Learn more about

The Average Price indicator calculates the average prices of BUY (LONG) and SELL (SHORT) open positions, taking into account the size of open positions, commissions and swaps.
The indicator builds the average line of LONG open positions, after crossing which, from the bottom up, the total profit for all LONG positions for the current instrument becomes greater than 0.
The indicator builds the average line of SHORT open positions, after crossing which, from top to bottom, the total profit for a

Swing Point Volume, the indicator that signals weakness and strength at the tops and bottoms. This indicador can be for used the Wyckoff Method.
Information provided; - Swing on customized ticks. - Volume and points in each balance sheet. - Percentage of Displacement. - Sound alert option on top and bottom breaks. - Volume in ticks and Real Volume. - Volume HL (extreme) or (opening and closing) - Customized volume shapes.
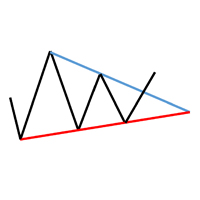
The TrianglesPro indicator for MetaTrader5 draws triangles on the chart based on the local highs and lows. The length of the trendlines can be limited. Optionally, you can display the highs and lows that are used to determine the triangles. It is also possible to determine how far back the identification of triangles should start. Also check out my other indicators.
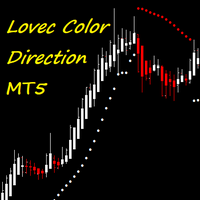
An indicator for better perception and recognition of the current trend direction, the beginning and end of corrections. It is recommended for manual trading, but it is possible to integrate it into an Expert Advisor for automated trading. The dots around the price indicate the current trend direction, the color of the candles themselves indicates the presence or absence of a correction. It is recommended to enter a position in the direction of the current trend after the end of corrections.
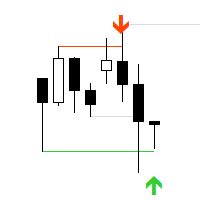
"AV Stop Hunter MT5" is an indicator for MetaTrader 5, which draws entry arrows for long and short after so-called Stop Hunt candles and has several notifications about them. Since this is a smart money concept , the periods H1 and H4 are the best. Increasing volume improves the signal, lines and arrows are then thicker. The MQL5 variant has colored stop-hunting candles. NEW: Signal Buffer: 1, 0 or -1
Definition :
Stop hunting, also known as stop running, is the practice of institutional trad

The principle of construction - on top of any number of bars set by the user, a channel is constructed with maximum and minimum lines so that the bars touch the maximum and minimum of the channel at exactly three points. The name of the indicator follows from this principle. Both vertical lines can be moved along the graph by the user, thus specifying the period on which the channel is built. After a specified period, channel rays are drawn that define a channel in which the price can move.
In

The FourierExtrapolationMA indicator transforms and extrapolates the Moving Average function by the Fast Fourier Transformation method.
1. The transformation period is set by two vertical lines, by default the first blue line and the second pink.
2. By default, the Moving Average (MA) line is drawn in red.
3. By Fourier Transform, the indicator builds a model of N harmonics, which is as close as possible to the MA values. The model is drawn by default in blue over the MA for the period betwee

Niubility Trend Niubility Trend displays the trend direction for all time frames in real time.
You'll see at a glance at which direction the trends are running, how long they last and how powerful they are.
All this makes it an easy-to-use trend trading system for beginners, advanced and professional traders.
Features
Easy to trade Customizable colors and sizes It is non-repainting and non-backpainting It is fantastic as a trailing stop method It implements alerts of all kinds

Oscilador bem próximo que o indicador SANTO mostrado pelo Bo Williams em sua metodologia PhiCube, para mim este indicador ainda é melhor que o próprio SANTO original. Ótimo para entender a força e tendência de movimentos e possíveis divergências. Preço fazendo topo e o SANTO não renovando máxima, tudo indica que teremos uma reversão ou no mínimo um drawback.
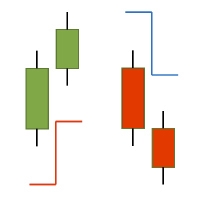
The ATR-StopLoss-Line indicator for MT5 calculates a stoploss line by the Average-True-Range (ATR) - Value of the particular candle. As point of reference you can choose the High/Low or Close of the particular candle. The indicator is suitable for scalping and intraday trading. The indicator does not redraw (recalculate). Signals are generated strictly on the "Close of the bar". It can be used as a standalone tool or together with other indicators. Alerts on Colorchanges are activatable.

The market price usually falls between the borders of the channel .
If the price is out of range, it is a trading signal or trading opportunity.
Basically, Fit Channel can be used to help determine overbought and oversold conditions in the market. When the market price is close to the upper limit, the market is considered overbought (sell zone). Conversely, when the market price is close to the bottom range, the market is considered oversold (buy zone).
However, the research can be used to

RSI Entry Points is the upgrade of the standard RSI indicator to avoid lagging. Indicator draws the clouds and the arrows to have clear picture where price is and what to wait for. Why standard RSI is lagging? because mostly we do not use it correctly and it is with very weak visual flexibility, less informativity. With my current upgrade I tried to Fix both problems same time and I got much better results and more exact entries than standard RSI has. To make yourself sure check out the screens

Hello Traders
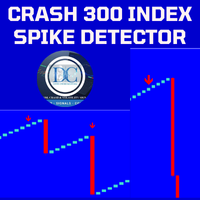
I have created this indicator to Catch SPIKES on Crash1000, Crash500 and Crash300. Follow the below mention instruction for better Result
1. When Red arrow pop up on the Chart, Take a Sell entry
2. Stay in trade until price break below from entry
3. Do not hold trades after all trades went in Blue
4. Keep adding position until spike cross below from intial entry
See Example for more assistance

Forecasting the future by combining trend and average price
with many signals
Can be used in all symbols
Can be used in all time frames
Settings:
BackShow: The number of candles displayed
Osi: Main setting, the larger the number, the longer the trend
If you need more settings, or have any questions or suggestions, message me
How to trade:
Blue: sell signal
Red: buy signal
Blue and red at the same time: no signal

- Times and Trades, também chamado de Time and Sales ou histórico de negócios, é uma ferramenta essencial para quem opera através do Tape Reading (Fluxo). - O Metatrader 5 não informa os dados das corretoras, sendo assim, impossível diferenciar quem enviou a ordem. - Os dados só podem ser usados por corretoras que informam os dados dos volumes de negociação, como a B3. No mercado forex não é possível usar.

--- StudentK Sync Chart --- 1. Move charts at the same time 2. Cross check among different Symbols and Timeframes 3. Plan your own trading strategies
--- Context --- StudentK is not indicated as a master or K Sir for knowledgeable person who claims for winning all the time. (But lots of traders should know the fact that it is rarely truth, especially in fluctuated period of time)
StudentK is a group of years-experienced traders who want to share amazing tools in Free and Paid versions. Aiming

up down v6 for mt5 is no repaint all timeframe and all pairs indicator. red histogram cros trigger that is up point,and put a red point on histogram. and blue histogram cros trigger that is deep point.and put blue point on histogram. this indicator need to sometimes zoom out .for thise pres + button. if newly comes signal is too high makes before invisible.red and blue points are there.to see the signals. indicator is no repaint and can use all time frame and all pairs. only need minimum 500 bar

indicator is no repaint trend indicator.for mt5 when white stars up to Red histogram that is probably end of long trades. when White stars up to Blue histogram that is probably end of down trades. indicator can use all pairs and lower than weekly charts, to use weekly chart need to at least 500 bars data on back.and lowering processing value 500. it is also suitable for 1m charts. indicator hold long way to go. there is not too many signals.
Spike Detector for Boom and Crash Indices
The Spike Detector is specifically designed to cater to the unique needs of traders in the Boom and Crash indices markets. Optimized for M1 (1-minute) and M5 (5-minute) timeframes, this tool ensures you receive timely and actionable insights. Below, you'll find a comprehensive guide on its key features, advantages, installation process, and how to use it effectively.
Key Features and Advantages
1. Non-Repainting: The Spike Detector guarantees accurac
This is the ADX Dashboard MT5. This dashboard will scan multiple timeframes in MT5 platform, from M1 chart to D1 chart. It will send the buy/sell signals by alert on the platform or sending notification to your phone or message you via a email.
The buy signal is the cross over of DI+ and DI- The sell signal is the cross under of DI+ and DI-.
The up trend color will be displayed when DI+ is greater than DI- The down trend color will be displayed when DI+ is less than DI- The value of ADX value wi

Esse indicador mede o 1º Canal de referencia e a 1º Zona Neutra * configurar o canal macro para verificar a frequencia MAIOR H1 H4 1D * configurar o canal micro para verificar a frequencia Menor 1M 5M 15M Como instalar o Indicador fimathe. E uma pré mentoria tem uma estrategia Secreta bonus nesse video . assitao o video para enteder as logicas que podemos iniciar com esse indicador.
https://www.youtube.com/playlist?list=PLxg54MWVGlJzzKuaEntFbyI4ospQi3Kw2
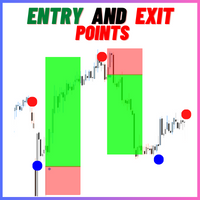
Description: For a comprehensive understanding of our indicators, we invite you to explore the entire Q&A section within this MQL5 blog post here . The Entry and Exit Points Indicator is a powerful tool meticulously designed to assist traders in making precise decisions regarding their trading positions. This indicator provides a comprehensive analysis of market conditions, identifying opportune moments for entering or exiting trades. It does this through a combination of advanced algorithms
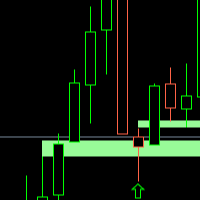
FVG WATCHER is an indicator that helps traders identify fair value gaps in the market. The indicator draws fair value gaps and alerts the user when the fair value gap has been swept. It allows users to specify how it should be swept, what time range to alert, and the size of the fair value gap to alert. It also allows the user to apply a moving average trend filter for better choice of alerts. The indicator also allows push mobile notifications. What makes FVG Watcher special is that it can be

In the ever-evolving world of Forex trading, understanding the different trading sessions is paramount to making informed trading decisions. Each trading session brings its own unique characteristics, opportunities, and challenges, and recognizing these can greatly enhance your trading strategies. Whether you're a novice or a seasoned trader, the Forex market's three main trading sessions – Asian, London, and New York – are crucial milestones that dictate market behavior and potential trade set

50+ Candlestick Patterns, Simulated Trading Results, Top Five Performers Candle Analysis extends Candlesticks Pattern Analysis by not only identifying Patterns but also recording the Past Performance of the Patterns. What it Does:- Identifies and plots results on chart Displays Top Patterns for both Bullish and Bearish type. Log can be printed in experts tab to see Simulated Trading results Displays All or Selected Patterns Alerts on Pattern formation More detailed information in Blog

RaysFX (Average Directional Movement Index)
Technical indicator (ADX) helps to determine the market trend. It was developed and described in detail by Welles Wilder.
The simplest trading method based on the system of directional movement implies comparison of two direction indicators: the 14-period +DI one and the 14-period -DI.
To do this, one either puts the charts of indicators one on top of the other, or +DI is subtracted from -DI.
W. Wilder recommends buying whenever the +DI crosses above

Descriptions
A point point is a technical analysis indicator, or calculations, used to determine the overall trend of market over different time frames. This indicator calculate the highest or lowest pivots among left x and right y bars and show the high/low level during that period. From that, you could clearly see the top resistance & bottom support level and how market goes break out.
Instructions
pivotLeft - pivot left bar count pivotRight - pivot right bar count pivotHighColor - color
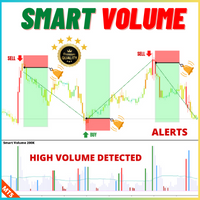
Description: For a comprehensive understanding of our indicators, we invite you to explore the entire Q&A section within this MQL5 blog post here . Technical indicators are crucial tools for analyzing market trends. Smart Volume, can help traders understand price movements and market strength. This indicator utilizes tick volume and price action to identify market trends and reversals. The Smart Volume indicator displays volume bars in blue, yellow, green, red, and white, each signifying dis
One of the basic needs of every trader is to have a checklist to enter every position. Of course, using pen and paper may not be convenient forever. With this indicator, you can have a small checklist next to the screen for each of your charts and use it for better use in your trades.
By pressing the r button, you can return everything to the original state.
MT4 Version
This indicator will have many updates and special settings will be added to it.
You can contact us via Instagram, Telegram, Wh

Previous Period High Low . This indicator shows the previous Day, Week, Month and Years High and Low. It's great for price action strategies. : Provides clear and visible breaks in structure. : Easy to see breakout levels. : Easy to see gaps between previous high, low levels after breakouts have occurred. The indicator works on every time frame. Multiple periods can be selected and be seen on the same chart. Every line can be customized to Your liking. Color, style and thickness. Enjoy!

** NOTE: This indicator uses realtime data. Thus DO NOT download Demo version. If you still need demo version, please refer to free version .
Symbol Chart Changer is an indicator/utility that offers you the option to switch between symbols and timeframes.
You can choose any symbol and timeframe on the same chart with just a few clicks. In addition, this indicator also shows the profit of the symbol through the color of the buttons.
Features: Click buttons on the chart to monitor all your fa

Presenting the uGenesys Break of Structure and Change of Character Indicator The uGenesys Market Structure Indicator is the advanced solution designed specifically for forex traders seeking a competitive edge. This innovative tool goes beyond merely identifying Break of Structure (BoS) and Change of Character (CHoC); it also illuminates optimal entry and exit points on your forex charts, transforming your trading experience.
While the uGenesys Market Structure Indicator can reveal pivotal pat

The GGP ADX and DI MT5 Indicator is used to quantify trend strength. ADX calculations are based on a moving average of price range expansion over a given period of time. This indicator is MT5 conversion of the ADX and DI Indicator by “BeikabuOyaji “ in Trading View website and some alert methods are added to provide real-time alerts when a trading signal is generated, in order to allow traders to act quickly and efficiently. For MT4 version please click here . ADX is plotted as a single line wit

The indicator determines and marks the short-term lows and highs of the market on the chart according to Larry Williams` book "Long-term secrets to short-term trading". "Any time there is a daily low with higher lows on both sides of it, that low will be a short-term low. We know this because a study of market action will show that prices descended in the low day, then failed to make a new low, and thus turned up, marking that ultimate low as a short-term point. A short-term market high is just

The indicator determines the inside bar and marks its High/Low. It is plotted based on the closed candles (does not redraw). The identified inside bar can be displayed on the smaller periods. You may set a higher period (to search for the inside bar) and analyze on a smaller one. Also you can see the levels for Mother bar.
Indicator Parameters Period to find Inside Bar — the period to search for the inside bar. If a specific period is set, the search will be performed in that period. Type of in

The Quantitative Qualitative Estimation (QQE) indicator is derived from Wilder’s famous Relative Strength Index (RSI). In essence, the QQE is a heavily smoothed RSI.
Modification of this version: ( converted from tradingview script by Mihkell00, original from Glaz)
So there are Two QQEs. One that is shown on the chart as columns, and the other "hidden" in the background which also has a 50 MA bollinger band acting as a zero line.
When both of them agree - you get a blue or a red bar.

Squat bar.
One of the signals of the "Trade Chaos" system of Bill Williams.
It is calculated based on the difference in price changes and tick volume.
Strengthens the signal of the "Bearish/Bullish Divergent Bar (First Wiseman)" if it coincides with it or is nearby.
Tested in comparison with the original program "Investor's Dream".
For more effective development of the system, read and see the materials of Bill Williams.
In the settings you can choose the color of bar.

A indicator to show saturation in buying or selling With fast and complex mathematical calculations Easily find saturation points for buying or selling Can be used in all symbols and time frames with many signals Can be combined with different indicators and different time frames With simple settings and simple working methods
Features: Can be used on all symbols Can be used in all time frames Can be used in all markets (Forex, stock, etc.) Large number of signals Same performance on all time

Every trader knows that he or she should never Risk more than 2% (or 5%) per trade. This is a Money Management law and an usable LotSize should be calculated each time because a trader must use a different StopLoss value for different Support and Resistant level. This indicator will calculate an appropriate LotSize for the moment when you will put it on the chart and each time you will drag the "Stop Loss Line" in any direction.
Inputs: Order_Type - Buy or Sell TakeProfitPoints - how many po

MT4 Version Kill Zones
Kill Zones allows you to insert up to 3 time zones in the chart. The visual representation of the Kill Zones in the chart together with an alert and notification system helps you to ignore fake trading setups occurring outside the Kill Zones or specific trading sessions. Using Kill Zones in your trading will help you filter higher probability trading setups. You should select time ranges where the market usually reacts with high volatility. Based on EST time zone, fo

The Game-Changing Engulfing Candle Hunter - Your Guide to Profitable Trend Trading
Step into the realm of trading possibilities with our revolutionary product - The Engulfing Hunter. Designed by traders for traders, this dynamic indicator combines the potency of engulfing candlestick patterns and the versatility of proprietary trend detection system, offering a trading edge unlike any other. Engulfing candlestick patterns have always been a revered tool in the arsenal of seasoned traders. Actin

Welcome to the world of SMC (Smart Money Concepts) Trading, where we empower traders with the tools and knowledge to make smarter trading decisions. Our latest addition to our suite of trading tools is the SMC Trading Pro indicator, version 1.0. Key Features: Major Market Structure Identification with BODY break. Order Block must be in Major Swing ( not Small Swing ). Order Block with Fair Value Gap Detection. Order Block in Discount | Premium zone. Filter for only Bullish, Bearish or All Order
<< See how it works on YouTube >>
Possibilities:
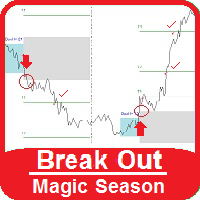
Arrow signal to buy, sell and hit the targets Alert signal send mail Execute custom audio file The Break Out Magic indicator monitors price fluctuations over a set period of time (adjustable rectangle). Then, according to the maximum and minimum price, in the second rectangle, it determines the outline break lines. And sets 3 goals to exit from each side. In the settings we have:
Start Time: Start time of range
End Time: The end of range time
Ex
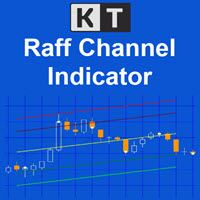
The KT Raff Channel is an enhanced and refined iteration of the original Raff channel concept pioneered by Gilbert Raff in 1996. This indicator builds upon Raff's initial work, incorporating modifications and advancements to provide traders with a more sophisticated and powerful tool. Gilbert Raff, a renowned name in the field of financial market analysis, is the developer of the Raff Regression Channel. This technical tool is designed for discerning and validating possible market price trends.
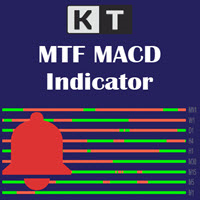
As a trader, monitoring multiple timeframes simultaneously will help you better understand the trend and know when multiple timeframes are in agreement or disagreement. The KT Multiple Time Frame (MTF) MACD displays the overall direction of an instrument in one chart by showing the moving average convergence divergence (MACD) for all time frames. The indicator displays a simple table with the respective MACD trend for each timeframe. You can also see whether MACD is gaining or losing momentum ac

Description Price action patterns detection that can work as triggers in any trading strategy, It include Flag, Flag Top, Flag 1234, and micro pullback patterns Support: We create great tools for the entire trading community. Most of them are free. If you believe in what we do Support Us Here. How is this indicator useful? You can use the indicator signals as a trigger to entry in the market and complement any trading strategy. Components Note 1: This indicator should only be considered a

KT Stochastic Alerts is a personal implementation of the Stochastic oscillator that provide signals and alerts based on six custom events: Bullish Crossover: When Stochastic main line cross above the signal line. Bearish Crossover: When Stochastic main line cross below the signal line. When Stochastic enter in an overbought zone. When Stochastic exit from an overbought zone. When Stochastic enter in an oversold zone. When Stochastic exit from an oversold zone.
Features
A perfect choice for tra
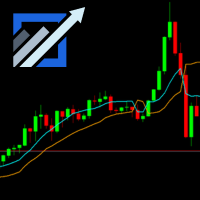
Boost your trading accuracy with the SSL Channel Indicator , designed to identify trends and precise entry points. This dynamic tool adapts to all trading instruments and timeframes. Perfect for scalpers, day traders, and swing traders, the SSL Channel Indicator simplifies market analysis, helping you trade confidently and effectively. Unlock your trading potential today! MT4 Link- https://www.mql5.com/en/market/product/127493

Color Levels - удобный инструмент для тех, кто использует технический анализ с использованием таких инструментов, как Трендовая линия и Прямоугольник. Имеется возможность настройки двух пустых прямоугольников, трех закрашенных и двух трендовых линий. Настройки индикатора крайне просты и делятся на пронумерованные блоки: С цифрами 1 и 2 вначале - настройки пустых прямоугольников (рамок); С цифрами 3, 4 и 5 - настройки закрашенных прямоугольников; С цифрами 6 и 7 - настройки трендовых линий. Объ
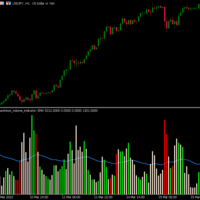
Hawkeye Volume Indicator contains a complex algorithm which executes over 300 calculations per bar in order to analyze the price action and associated volume, giving traders a tremendous advantage. Now Available in MT5 for U nlimited Use !
Volume is the only leading indicator which: .signals a price movement prior to it happening
.provides the fuel that drives the market Hawkeye Volume works in all markets and can be used in all timeframes for both tick and time charts – from longer term swing a
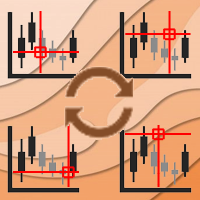
Async Charts is an indicator to synchronize charts and display a customized crosshair (cursor) on all selected charts. This is a useful utility for traders using multiple timeframes of analyzing multiple symbols for trade entry or exit.
Main Features : Real time Crosshair Synchronization on All Selected Charts
Supports Multiple Timeframes and Multiple Symbols at the same time
Auto Scroll Option
Graphical Adjustment of Color, Font, Size, ...
Locking All or Locking Specific Charts
More and More .

The GGP Wave Trend Oscillator MT5 Indicator is a volatility and momentum tool designed to help traders optimize their trading performance and providing traders find the most accurate market reversals. This indicator is MT5 conversion of the Indicator: WaveTrend Oscillator [WT] by “ LazyBear “ in Trading View website and some alert methods are added to provide real-time alerts when a trading signal is generated, in order to allow traders to act quickly and efficiently. When the oscillator is abov

The double top bottom pattern is arguably one of the technical analysis's most popular chart patterns. These patterns are used to capitalize on recurring patterns and identify trend reversal patterns, thereby creating well-placed entry and exit levels. The KT Double Top Bottom is based on these patterns and fine-tunes the trade signal development process for traders.
Features
It's based on one of the most reliable trading patterns and brings some fine-tuning and automation to the process. Also
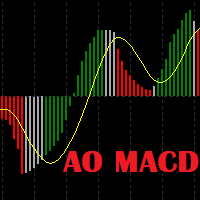
Awesome Oscillator Moving Average Convergence/Divergence Indicator. Not late as AO and not noisy as MACD. The basic version of the indicator is presented. The "PRO" version is under development with such features as sending signals to e-mail and plotting divergence and convergence lines on the chart.
Input parameters: Fast: short EMA Slow: long EMA Signal: signal line Colors: Red: MACD < Signal Green: MACD > Signal Gray: MACD above Signal, but lower than the previous MACD MACD below Signal, but
MetaTrader 마켓은 거래로봇과 기술지표를 판매하기에 최적의 장소입니다.
오직 어플리케이션만 개발하면 됩니다. 수백만 명의 MetaTrader 사용자에게 제품을 제공하기 위해 마켓에 제품을 게시하는 방법에 대해 설명해 드리겠습니다.
트레이딩 기회를 놓치고 있어요:
- 무료 트레이딩 앱
- 복사용 8,000 이상의 시그널
- 금융 시장 개척을 위한 경제 뉴스
등록
로그인
계정이 없으시면, 가입하십시오
MQL5.com 웹사이트에 로그인을 하기 위해 쿠키를 허용하십시오.
브라우저에서 필요한 설정을 활성화하시지 않으면, 로그인할 수 없습니다.