MetaTrader 4용 기술 지표 - 89
DMI ADX Histogram Oscillator I present you one of the most precise and powerful indicator Its made of DMI Histogram together with ADX Oscillator. It has inside arrow to show a buy or sell setup.
Features The way it works its the next one : the histogram is a difference between DMI+ and DMI-. At the same time together we have the oscillator ADX for
Market to run
It can be adapted to all type of trading styles such as scalping, day trading or swing. It doesn't matter if its forex, stock ,
The indicator is designed for trading binary options on small timeframes up to 15 m Easy to use does not need additional settings and can be used without additional filters Recommendations for trading When a signal appears (blue arrows pointing up), you need to consider the buy direction When a signal appears (the red line indicates the bottom), you need to consider the direction to sell To conclude a deal is on the candle where the signal for one candle came, if the signal turned out to be unpr

KDJ指标,从国内代码中转译而来,带有J线 -------------------------------------------------------------------------------------------------------------- 你可以在这里联系我 https://www.mql5.com/zh/users/chaoping0326 可以承接MT4,MT5的指标,EA定制 长期从事编程项目(MT4从2012年,MT5从2016年), 有很好的编程能力,参数设置合理,能很好地理解客户的要求。 请联系我,根据你的要求进行报价。 我对程序的逻辑负责,如果程序有问题,我可以免费修复,如果我不能修复,我可以全额退款。 增加和调整逻辑需要额外收费。 免费提供全英文或中文源代码。

It is an indicator that analyzes the high and low prices in real time by Dow theory, draws a trend line, and draws the predicted arrival point in the Box format after breaking the low price and the high return price. The high and low prices are determined by the nBars parameter (initial value = 5), but displaying the corresponding moving averages (SMA and EMA 4 to 5 times nBars) at the same time makes it easier to understand the trend change. (D ownload the demo version of the free GreenBox and

双线MACD -------------------------------------------------------------------------------------------------------------- 你可以在这里联系我 https://www.mql5.com/zh/users/chaoping0326 可以承接MT4,MT5的指标,EA定制 长期从事编程项目(MT4从2012年,MT5从2016年), 有很好的编程能力,参数设置合理,能很好地理解客户的要求。 请联系我,根据你的要求进行报价。 我对程序的逻辑负责,如果程序有问题,我可以免费修复,如果我不能修复,我可以全额退款。 增加和调整逻辑需要额外收费。 免费提供全英文或中文源代码。

데일리 트렌드 스캘퍼(DTS) 이 표시기는 RPTrade Pro 솔루션 시스템의 일부입니다.
DTS는 가격 조치, 동적 지원 및 저항을 사용하는 일일 추세 지표입니다. 누구나 사용할 수 있도록 설계되었으며 거래의 절대 초보자도 사용할 수 있습니다. 다시 칠하지 마십시오. 표시는 닫기에서 닫기로 제공됩니다. 단독으로 사용하도록 설계되어 다른 표시기가 필요하지 않습니다. 당신에게 하루의 시작에 추세와 잠재적인 이익실현을 제공합니다.
어떻게 작동합니까 DTS는 가격 조치 및 동적 지원 및 저항과 결합된 돌파 전략을 사용하고 있습니다. 야간 추세와 변동성은 다음날에 사용할 것으로 분석됩니다. 이 분석에서 브레이크아웃 한계(파란색 및 진한 주황색 선)와 이익실현(Take Profit)이 결정됩니다. 이력 데이터 덕분에 전략 및 설정의 "성공"을 즉시 확인할 수 있습니다. 역사적인 부분을 통해 전략에 "구멍"이 있는지 즉시 확인하고 더 잘 맞는 다른 TimeFrame 또는 Symbol을
!!!REVISION 3 OF THE INDICATOR HAS BEEN RELEASED! IF YOU WANT TO TRY THE INDICATOR FOR 1 MONTH FOR FREE JUST WRITE ME NOW!!!
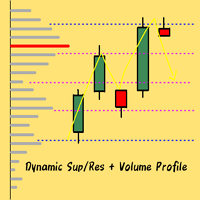
DYNAMIC LEVELS + VOLUME PROFILE + REGRESSION CHANNEL Hello Guys! Revision 3 of the indicator has been released! The indicator plots SUPPORTS AND RESISTANCES DYNAMICALLY on the chart, identifying different levels of interest based on the price action. Every trader knows that indicators are important, but they often provide the signal "with a candle of delay", therefore whe

Это стрелочный индикатор. Он выбирает данные от 23-х стандартных индикаторов и расчитывает уровень сигнала который показывает предполагаемое движение цены инструмента торговли. Минимальный уровень сигнала индикатора установлен в пределах -100 до +100%. Используйте усреднение для формирования сигнала.
Как работать с индикаторам.
Следим за сигналом и принимаем решения. Индикатор перерисовывается только на нулевой свечи, поэтому решения принимаются после закрытия свечи с новым сигналом, и сигнал
Это линейный индикатор. Он выбирает данные от 23-х стандартных индикаторов и рассчитывает уровень сигнала, который показывает предполагаемое движение цены инструмента торговли. Минимальный уровень сигнала индикатора установлен в пределах -100 до +100%. Используйте усреднение для формирования сигнала.
Как работать с индикаторам.
Следим за сигналом и принимаем решения. При пересечении нулевого уровня индикатора снизу вверх можно рассматривать покупки. При пересечении нулевого уровня сверху вни
Это индикатор гистограмма. Он выбирает данные от 23-х стандартных индикаторов и расчитывает уровень сигнала который показывает предполагаемое движение цены инструмента торговли. Минимальный уровень сигнала индикатора установлен в пределах -100 до +100%. Используйте усреднение для формирования сигнала.
Как работать с индикаторам.
Следим за сигналом и принимаем решения, цвета гистограммы показывают когда возможны покупки а когда продажи, или нейтральный цвет - сделать паузу. Индикатор перерисов

Stochastic force is an advanced version of the stochastic oscillator. Instead of using the regular price a more efficient price data is provided as an input for the oscillator which takes into account the price efficiency, volume and market noise. Also price is pre-filtered with the selected average type and then post-filtered by a hull moving average which provides a smooth transition of the oscillator. It eliminates maximum false signals and has the potential to become an integral part of any

Trend Harvester is yet another trend indicator with flat detection. It uses price series and Moving Average for detecting market trend.
For better result I would recomend to play with parameters.
Lower periods will force to react to short trends.
Higher periods will try to show longer trands.
You can set the same period for Price Series and Moving Average for quick test.
You can also choose Moving Average type between "Regular" and "Zero Lag".
"Zero Lag" type improves reaction to trend change.

VertexFilter - это индикатор соединивший в себе классический zig zag и осциллятор. Принцип действия следующий: когда регистрируется новый максимум или минимум, это делается с помощью индикатора zig zag, индикатор ждет смены направления движения цены, это делается с помощью осциллятора, в такие моменты появляются сигналы на покупку и продажу. Таким образом индикатор подает сигналы когда цена меняет направление движения вблизи экстремумов. Это позволяет отфильтровать ложные сигналы. Индикатор имее
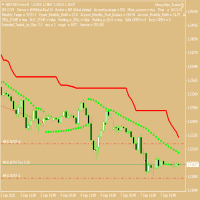
ATR Stops Attach to chart of any timescale Length = 10 ATR period = 9 kv = 6 I use this set up on a one hour chart, basically the blue line indicates an upward trend while the red line indicates a downward trend All setting can be used on any chart period, If you don't like the settings I use then just play around with the settings on any chosen time period until you find a setup which suites your trading style
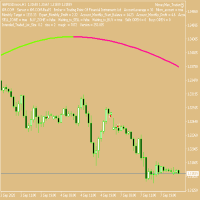
MA with Trend colour Attach to chart of any timescale MA period = 200 buffer = 1 I use this set up on a one hour chart, basically the green line indicates an upward trend while the red line indicates a downward trend All setting can be used on any chart period, If you don't like the settings I use, then just play around with the settings on any chosen time period until you find a setup which suites your trading style

The indicator allows you to trade binary options. The recommended time frame is М5 and the expiration time is 5 minutes. The indicator suitable for auto and manual trading. A possible signal is specified as a arrows above/under a candle. You should wait until the candle closes and entry the trade at new candle Arrows are not re-painted Trade sessions: Any Currency pairs: ( recommended) AUD/CAD Working time frame: M5 Expiration time: 5,10,15 minute Up buffer: 1, down buffer: 0 *** Use with bro

The indicator allows you to trade binary options. The recommended time frame is М5 and the expiration time is 5 minutes. The indicator suitable for auto and manual trading. A possible signal is specified as a arrows above/under a candle. You should wait until the candle closes and entry the trade at new candle Arrows are not re-painted Trade sessions: Any Currency pairs: ( recommended) EUR/AUD Working time frame: M5 Expiration time: 5,10,15 minute Up buffer: 1, down buffer: 0 *** Use with brok

The indicator allows you to trade binary options. The recommended time frame is М5 and the expiration time is 5 minutes. The indicator suitable for auto and manual trading. A possible signal is specified as a arrows above/under a candle. You should wait until the candle closes and entry the trade at new candle Arrows are not re-painted Trade sessions: Any Currency pairs: ( recommended) AUD/NZD Working time frame: M5 Expiration time: 5,10,15 minute Up buffer: 1, down buffer: 0 *** Use with brok
It is a judgment tool that judges trends in 1 minute and supports discretionary trading.
Various usages 1. It is used to recognize the environmental advantage of buying or selling with the color of the line. If the line is red, it is advantageous to buy. If it is blue, it is advantageous to sell. Neither if there is no line. 2. Used as a guide for entry by signing the entry. Red arrow long Blue arrow short 3.Used as a guide for closing (Even if there is no entry sign, the close point will be s

This indicator is intended for professionals assessing fundamental market trends. This indicator calculates the index of any instrument and analyzes it. The index of the state currency shows the real purchasing power of this currency, and the dynamics of this index shows the dynamics of the economic state of the corresponding state. An analysis of the indices of both currencies included in a currency pair makes it much more reliable to identify the trend of this cur

Bearish/Bullish divergent bar . One of the signals of the "Trade Chaos" system of Bill Williams. (First wiseman)
When bar moving away from the "Alligator" indicator and there is divergence on the Awesome Oscillator indicator, it shows a potential point of movement change.
It is based on the opening/closing of the bar, the position relative to the previous ones, the Alligator and AO.
When trading, the entrance is at the breakthrough of the bar(short trade - low of bar, long trade high of bar), a

The strategy works on the ECN account (5min and more)
Inside bar : with the direction of movement average 200 (you can change 200 it if you want). when the price is on the MA the indicator only gives the buy sign, and the opposite if the price is below the MA 1 Buy: The indicator draws a blue line, when a candle closes above that line and the price reverses towards the line, Buy from that blue line. Put the stop on the red line and the take profit on the yellow line TP1, or green line TP2 2
ATR on Chart has been made for anyone wants to easily analyze ATR from Price Chart. It will show ATR rang and you can apply with each bar or MA .
When price touches the line it means it is trending to that side .
Please be aware that this indicator DOES NOT point out the momentum of trending. I r ecommend to use this indicator to find : https://www.mql5.com/en/market/product/55009
Input d escription : ATRperiod = Setting of ATR period. ATRmulti = Multiply value from ATRperiod . Mode = se

Indicator with the function of catching trees should Engulfing Pattern of all time frames 1. Engulfing identification indicator for multi timeframe. 2. Function backtest of Engulfing candlestick patterns 3. Announcements on MT4 and on mobile phones Please watch my movie on youtube for instructions. Subscribe my channel for free indicator. Thanks for your https://youtu.be/_Dg99o6I_m4

the indicator will show signal arrows on the graph at the crossing of a given level it has push and audible alerts. By crossing from low to high level 0.3, a blue arrow will come out for the purchase, at the same time an audible signal will sound. By crossing from low to high level 0.7, a red arrow will come out for the sale, at the same time an audible signal will sound. Possibility to deactivate push and audible alerts.
MT5 version : https://www.mql5.com/en/market/product/51968

The indicator allows you to trade binary options. The recommended time frame is М5 and the expiration time is 5 minutes. The indicator suitable for auto and manual trading. A possible signal is specified as a arrows above/under a candle. You should wait until the candle closes and entry the trade at new candle Arrows are not re-painted Trade sessions: Any Currency pairs: ( recommended) EUR/CAD Working time frame: M5 Expiration time: 5,10,15 minute Up buffer: 1, down buffer: 0 *** Use with brok

This indicator Super XT indicator.Indicator displays trend movement. Indicator calculates automatically line. Features
FiltPer - displays indicator period. Window - displays indicator trend (true/false).
Trend - displays indicator trend (true/false).
X - move the trend left and right. Y - move the trend up and down.
How to understand the status: If the Trend color is green, trend is up.
If the Trend color is red, trend is down.
////////////////////////////////////////////////////////

Mr Pip Trend indicator combines powerful price action analysis and sophisticated algorithmic data analysis to provide traders with high-accuracy chart analysis and support the decision-making process. You can use Mr Pip Trend Indicator to trade all the markets (all Forex pairs, all CFDs and Cryptocurrencies) on all timeframes! Mr Pip Trend Indicator provides chart analysis that is effective at detecting new trends but finds the exact sweet-spot between early and late entries. What is different
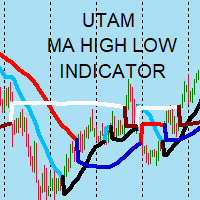
Nice Day! - A moving average candle indicates a high and low turn trend.
- MA_vonal_vastagsaga: MA_line_thickness. - MA_vonal_szine: MA_line_color. - MA_vonal_szine_long: MA_line_color_long. - MA_vonal_szine_short: MA_line_color_short. - mql5.com can also be used for my robots. Szép Napot! - Mozgó átlag gyertyájának magas (High) és alacsony (Low) fordulos trend jelzése. - mql5.com robotjaimhoz is használható.

What you can do with CandleStick CandleStick is a useful indicator for doing MTF analysis. This indicator displays the CandleStick of another time frame on the chart . By understanding the information in multiple time charts at the same time, it is easier to understand the overall market view. It is also a useful tool for validating and studying past quotes and trades. There are similar products made by others, but I designed and developed it so that it is easy for me to use.
Features of Candle

Indicator developed with precision algorithm that seeks moments of strong trend in the markets. Reconciled with an algorithm that seeks high volume moments in the market. I recommend using timeframes M15 to H1. I also recommend an optimization to your liking for your best currency pairs. Any questions, do not hesitate to ask. Buy EA based on this indicator CLICKING HERE This is an excellent trigger indicator for your trading system. If you already operate a trend and want an indicator to show y

Displays the appearance of a gap on the chart (when the closing price of the previous bar differs from the opening price of the new bar). My #1 Utility: includes 65+ functions | Contact me if you have any questions In the initial settings you can configure: The size of the gap (in points): only gaps that exceed this value will be displayed. Arrow color : separate for up and down gaps. When you hover the mouse over the gap arrows on the chart, their size will be displayed ; I recommend ch

The indicator allows you to trade binary options. The recommended time frame is М5 and the expiration time is 5 minutes. The indicator suitable for auto and manual trading. A possible signal is specified as a arrows above/under a candle. You should wait until the candle closes and entry the trade at new candle Arrows are not re-painted Trade sessions: Any Currency pairs: ( recommended) EUR/NZD Working time frame: M5 Expiration time: 5,10,15 minute Up buffer: 1, down buffer: 0 *** Use with b

We know for sure that The Fibonacci sequence is a science used to calculate or estimate target distances.
How does this indicator work? 1. Tell the spread status 2. Tell me the current price 3. Indicate whether the candlestick status is bullish or bearish on each time frame. 4. Indicates the status of the past 2 candles 5. Tell Pivot Point 6. Tell the Fibonacci sequence. 7.The Fibonacci measurement can be set. 8. Pivot can be set backward. 9. Look at support and resistance.
Suitable for 1. Da

Squat bar.
One of the signals of the "Trade Chaos" system of Bill Williams.
It is calculated based on the difference in price changes and tick volume.
Strengthens the signal of the "Bearish/Bullish Divergent Bar (First Wiseman)" if it coincides with it or is nearby.
Tested in comparison with the original program "Investor's Dream".
For more effective development of the system, read and see the materials of Bill Williams.
In the settings you can choose the color and width of bar. (Width: 3-if

TorN ( Trend or Not ) has been made from ADX problem on fixed level. Only fixed level is hard to find trending or not. Now I find the better method to analyze ADX with MA . You can use this signal to confirm your trending strategy. (Or use it to find Sideway)
The best signal is signal line get higher than MA line and fixed level. ( Recommend to use level value same as ADX period or higher ) If signal line lower than MA line on Any level is mean weakening trend.
Please be aware that thi

This type of arrow indicator works without redrawing signals. The signal on the indicator is shown as arrows (in the direction of movement). It is very simple and effective to use in the Forex market. Type of trading: "Scalping" It is applicable and performs well in intraday trading, as well as long-term trading. Сигнал на индикаторе показан в виде стрелок ( по направлению движения).
Очень прост и эффективен в применении на рынке Форекс.
Вид торговли: " Скальпинг"
Применим и хорошо себя по
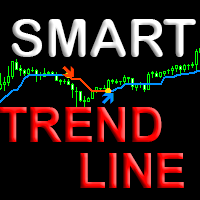
Indicator with an innovative algorithm for determining the direction of the trend. Shows the best results for determining the trend on any currency pairs, stocks, cryptocurrency without redrawing the result. It will help you immediately determine the profitability of the current pair and timeframe. Uses Price action patterns in conjunction with the author's unique algorithm. Suitable for both beginners and professionals for all types of trading. How to choose a profitable timeframe and optimize
The Icarus Signals Continuation(TM) Indicator is a simple, but highly effective tool for identifying strong price trends, both long and short, across all time-frames and instrument types. The Icarus Continuation Indicator allows users to plot individual markers for each bar, when price has extended into a high-probability trend area, after a set level of extension. The Continuation Indicator allows users to fully optimise each of the unique Icarus settings to best fit a particular trading s

The Knowledge of which Geometry aims is the knowledge of the Eternal - Plato Quant Stress Scanner is a Scientifically developed Stress detection algorithm along the geometrical lines on the price data which are quantified into Stress repulsion, fractures and clusters in a easily understandable signal form. Each signal are displayed in well-arranged with currency pairs in row-wise and timeframes in column-wise manner. Explanation of signal and plotting stress levels with trendlines are shown in

Description
Range Detector is an indicator that identifies impulses in the market and displays their slope angles on the chart.
Recommendations
You can use this indicator to determine a trend and, accordingly, to determine the direction of opening a position or closing an opposite position.
Parameters
===== _INDICATOR_SETTINGS_ ===== - indicator settings
Maximum History Bars - maximum number of history bars for calculating the indicator. Average True Range Period - ATR indicator p
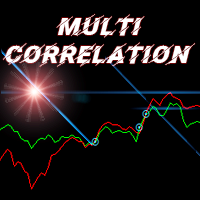
Indicator of correlation of two trading instruments.
Ideal for pair trading.
Example of use: if there is a significant divergence of correlated trading instruments, open two deals in the direction of each of them. Trades are closed when the correlation lines are crossed. Settings: First symbol (if empty - current) - The first trading instrument (if empty, the current one); Second tool (if empty - current) - Second trading instrument (if empty - current); Number of bars - Number of bars for ca

The original BoomTroom trend indicator. With this indicator, you do not need to sit near the computer and wait for the inflection point to appear day and night.
How important it is to determine the trend in the stock market or the Forex market! Still not sure how to determine the inflection point of a trend? Are you still worried about how to draw short-term and long-term trend lines? Run this smart utility. You will see pivot points of varying strength, as well as long-term and short-term tre

The Unique Trend indicator tracks market trends, ignoring sharp fluctuations and market noise. The indicator is suitable for trading on small timeframes because it ignores sudden price jumps or price corrections due to the reduction of market noise around the average price.
The scan at minima and maxima forms the internal boundaries (channel) when calculating the indicator signals. The channel allows you to remove market noise. iMA and iATR are used to generate signals using the author's algor

Implementation of indication of trend movement with moments for potential stops in the Cloud Power indicator.
The transition to the shadow warns of a possible reversal. The entry of the price inside the shadow speaks of a flat movement. The indicator tracks the market trend with unmatched reliability, ignoring sharp market fluctuations and noise around the average price. Simple, visual and efficient use. The indicator does not redraw and does not lag.
It can be easily used as an independent t

The Forex market can go through many different price paths to reach a point in the future. The future is dynamic. Therefore, planning a trade with a possible future scenario is an essential step for your success. For these purposes, we present to your attention Trend Units.
A unique author's strategy that simultaneously determines the strength of trends and points of entry into the market, visualizing it using arrows on the chart. The indicator is optimally adapted for trading on time periods
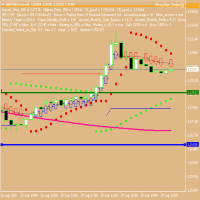
My Trend Finder
//**************************** FREE signal that uses all three of my indicators feel free to copy see link below https://www.mql5.com/en/signals/1318509?source=Site +Signals+My //**************************** period is the only setting basically number of bars on your chosen timeframe, Attach to chart of any timescale Period in bars = 7 which is a short monitoring period, 100 would be longer monitoring I use this set up on a one hour chart, basically No arrow means not su
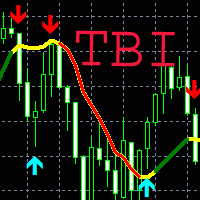
Простое визуальное и эффективное обнаружение тренда.Сигнал поступает на " закрытой свече ".Работает на всех символах и таймфреймах.Индикатор не использует входных параметров.Все алгоритмы для расчета заложены в код.Индикатор может использовать для разработки советников.Изменение цвета индикатора,характеризует поведение рынка.Зеленый цвет сигнализирует восходящее движение.Красный цвет сигнализирует о нисходящем движении.Желтый цвет показывает флет.Желаю всем удачной торговли!!!

LSM Basket Indicator is a ideal tool to trade "Basket Currency" for scalping/day trading or swing trading. Imbedded tools: 1. MTF(Multi Time frame) Basket Currency Trend filtering system . 2. Identify Basket Currency Trend reversal Area (Combined with " SupplyDemand Zones Indicator " ) 3. Basket Currency Strength indicator. 4. Chart Symbols Changer.(please see video) 5. Symbol daily change %.
Parameters:
Alert On "Reached Buy level/Sell level: true/false Alert On "Enter Supply Demand

Trend Code (v2.0) Trend Code is a very simple and yet effective trend indicator to capture trend movement, detect the trend reversal, calculate entry price as well as proper stop loss. Trend Code indicator is made up of a series of block, while bull trend block in bull colour and bear block in bear trend colour. For bull trend block, the TrendOpen is the lower edge, TrendClose is the upper edge, for bear trend block, the other way round. Parameters: TrendOpenAdjustment = 0.8, (range 0~1.0) Tr

Icarus Bolli-Band Change Display(TM) Indicator is a simple, but highly effective tool for visually identifying areas where the all-important 'Bollinger Band' values are in a state of expansion, contraction of neither. The traditional Bollinger Bands have been widely applied to trading charts globally since their creation by John Bollinger several decades ago. One of the limitations of the traditional Bollinger Bands is the ability to clearly identify when the bands are in fact expanding or contr

Hit Man is an indicator for determining the trend, complements any strategy, and can also be used as an independent tool. Professional indicator for determining the trend and entry points. It uses a unique filtering algorithm to determine the trend. Shows a change in the direction of price movement on any currency pairs, without redrawing the result. Suitable for determining entry points for scalping and swing, as well as for intraday, medium-term trading.
Benefits Suitable for all types of tr

No redrawing, No delay, No repainting arrows, indicator for binary options and forex
IF YOU HAVE ANY QUESTIONS, CONSULTATIONS OR ACTIVATIONS OF THE INDICATORS PLEASE CONTACT ME IMMEDIATELY AT MY PERSONAL TELEGRAM When you buy this indicator you get two free indicators with binary and forex template for metatrader 4 One is a bot check there, it sends you signals automatically, you only execute after the signal, in favor or in reversal for FREE . The other indicator

Breakout FX draws arrows and emits alarms if the price exceeds or falls below the previous n candles.
️ Breakout FX can be used in expert advisors.
️ Breakout FX can improve already existing trading strategies.
️ Breakout FX is very fast and is not repainting.
Inputs Breakout Range [Candles] Breakout Price Type Arrow Size Enable Alerts Enable Push Notifications Enable Emails

Switchman is a smart indicator without delays or redrawing that shows the trend of the selected timeframes. The most important task of a trader is to spot a trend and follow it on time.
Uses an algorithm for calculating finding possible price reversals. It can be used as an additional or auxiliary tool for your trading strategy. The current timeframe the indicator is set to is used.
Using arrows for this that show the direction of the pivot points. Can be used with an optimal risk to reward r

you are in a trade making profit... should you take profit now or wait...? This easy to use Dynamic Take Profit Indicator helps you to decide when to get out of a winning trade. Or you can supervise or overrule any EA when to close an open order when manual trading, or read out the buffers[1][2] to integrate in an Expert! As soon as the price crosses the yellow line, price direction should reverse soon and orders should be closed. The band is dynamic and changing with every new candle as it
DYJ SuperMATrend is a highly accurate MA trading system.
This indicator marks Bull line segment color (green) and Bear line segment color (red) on the average line. The entrance time and price are the candle time and price at the junction of the green and red lines. The next entrance is the exit point of the previous order.
Input
inpPeriod = 50 inpAtrPeriod = 5 InpLineWidth = 3 clr_buy = clrSpringGreen clr_sell = clrRed InpMup = 40

Watch the Clock shows a clock at a desired position. The clock is useful if you want to check when a candle closes. You can also set an alert to be prepared before the news.
️ Watch the Clock works also in the strategy tester.
️ Watch the Clock requires a minimum of CPU power.
️ Watch the Clock can improve your manual style of trading.
Inputs Alert -> At which time should the alert occur? Time Shift in Minutes -> Should the time be incremented by x minutes? Size -> The font size of the tim

The Magic Arrow Scalper sorts out low-probability signals in a trading strategy. The indicator uses a sophisticated filtration algorithm based on the market sentiment and trend. The indicator displays arrows on a chart (see attached screenshots) indicating a likely price reversal. Magic Arrow Scalper is not repainted. Once the candle is closed, a signal is confirmed and will never disappear from a chart. You can setup alerts when new arrows are displayed on a chart. The indicator is not des

The Icarus Reversals(TM) Indicator is a powerful tool to identify high-probability reversal points, across all instruments. The Reversals Indicator provides traders and investors with a simple-to-use and highly dynamic insight into points of likely price-action reversals. Generated by a unique proprietary code-set, the Reversals Indicator generates long and short trade signals, which can be customised for all inputs, allowing for the complete optimisation fitted to any trader or investor style
The leading indicator calculates the most likely places for a trend reversal or stop.
An example of use is shown on the screenshot using the ChainVector trading panel ( https://www.mql5.com/en/market/product/49155 ).
Support: https://www.mql5.com/en/channels/TrendHunter This indicator can be used as a stand-alone trading system or as an additional part of another trading system. Support : https://www.mql5.com/en/channels/TrendHunter
More products are available here: https://www.mql5.com/en
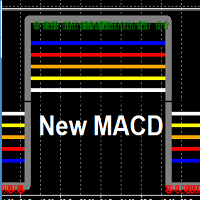
This is a New Single/Multi Timeframes Indictor based on Moving Average divergence concepts You can use it in differerent modes : Single time frame Mode :(2nd prefered) you input the time frames all the same period - you will get a square wave for Bear /Bull Areas two- time frame Mode :(1st prefered) you input the two time frames you prefer- you will get two square waves representing the 2 timeframes - when the two square waves are showing a Bear area a Red down arrow will appear and the same

The Icarus Auto Dynamic Support and Resistance Indicator provides a highly advanced, simple to use tool for identifying high-probability areas of price-action automatically - without any manual input whatsoever. . All traders and investors understand the importance of marking horizontal levels on their charts, identifying areas of supply and demand, or support and resistance. It is time-consuming and cumbersome to manually update all instruments, across all timeframes, and it requires regular

This is a complete HiLo activator indicator. A trend guide indicator capable of signaling when the trend is changing, thus ensuring greater assertiveness in the entries. For the periods M30, M15 and M5 we recommend the setup: HiLo Periods 27, MA Method Exponential. For H1 or above, we recomend the setup: Hilo Periods 13, MA Method Smoothed. -- Periods Control -- MA Smoothing Type Control -- MA Line Width Control

Chỉ báo tự động rút ra mức thoái lui fibonacci của tháng và năm. Draw from the same or under the same same or on the same of the tree before that. https://www.mql5.com/en/charts/12730171/audusd-pro-d1-axicorp-financial-services Màu đỏ là tháng fibonacci Màu vàng là tuần fibonacci White color is fibonacci date Red color is fibonacci month Yellow color is fibonacci tuần White color is fibonacci date Red color is fibonacci month Yellow color is fibonacci tuần White color is fibonacci date
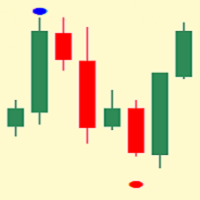
Indicator that shows two bars cluster bot and top. It will show you the forming top/bot based on the close prices. You can see the actual support and resistance.
The indicator accepts three arguments: Start bar - from which bar to start calculating Size of the dot on the chart (in font size) Distance from the top/bot Note: the indicator works on the timeframe you are currently on This indicator is very simple, does not distract you and will help you define better the trends and the channels.
S

The indicator is created using a unique algorithm that has no analogues. Based on the calculations, the contract price itself and the percentages displayed in it are calculated, which are displayed in the indicator in the form of histograms in two drawing options, as well as in six options for displaying prices on a chart in various combinations, which allows you to accurately see the interest of all trading participants in the form of drawing levels support and resistance. Trading decisions can

FIRST 10 COPIES AT 30 USD, NEXT PRICE WOULD BE 50 USD
HAWA MOMENTUM & TREND PRO (MT4) Advanced trading indicator with proper pre-defined entry and exit levels with almost 80% win rate. Its smart and advanced algorithm detects trend and trend strength using momentum for maximum profits and send signals after filtering out market noise. SETTINGS: Please make sure all inputs are NOT "false" in indicator properties otherwise it will not display identified trades. Directory Location: Download fil

Introducing the Austin Trend Scanner: Your Ultimate Tool for Timely Trend Identification.
The Austin Trend Scanner is a groundbreaking MetaTrader 4 indicator meticulously engineered to provide traders with precise trend reversal signals across multiple timeframes. Built upon advanced algorithms and non-repainting technology, this indicator offers unparalleled accuracy in identifying profitable trading opportunities.
Key Features: 1. Non-Repainting Signals: The Austin Trend Scanner delivers non
"Grow together!" "Cooperative QQ:556024" "Cooperation wechat:556024" "Cooperative email:556024@qq.com"
"The trend is forming or dying, and following the dancing snake circling, moving forward together, never giving up "Clearly visible long and short judgment, follow it!" "The twisted snake is the ladder leading to the trend, step by step, ascend and descend!" "We are good friends with Trend, and Shock is also our best partner!" "Grow together!"
Index content: 1. The benchmark price, re
MetaTrader 마켓은 MetaTrader 플랫폼용 애플리케이션을 구입할 수 있는 편리하고 안전한 환경을 제공합니다. Strategy Tester의 테스트를 위해 터미널에서 Expert Advisor 및 인디케이터의 무료 데모 버전을 다운로드하십시오.
MQL5.community 결제 시스템을 이용해 성능을 모니터링하고 원하는 제품에 대해 결제할 수 있도록 다양한 모드로 애플리케이션을 테스트할 수 있습니다.
트레이딩 기회를 놓치고 있어요:
- 무료 트레이딩 앱
- 복사용 8,000 이상의 시그널
- 금융 시장 개척을 위한 경제 뉴스
등록
로그인
계정이 없으시면, 가입하십시오
MQL5.com 웹사이트에 로그인을 하기 위해 쿠키를 허용하십시오.
브라우저에서 필요한 설정을 활성화하시지 않으면, 로그인할 수 없습니다.