MetaTrader 4용 기술 지표 - 84
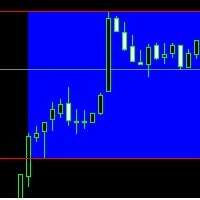
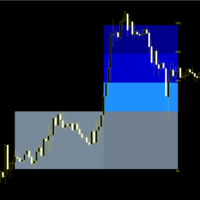
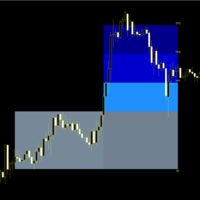
Hi, This is only a simple indicator. It selects a range between two times - you can choose it from how long. Don't wait miracle. This indicator is ideal choose for your break out strategy, for example London break out strategy. Happy trading! We wish you the best! Yours sincerely: MarginCallMasters Team Warning! This is only an indicator, it will not open position or orders to your account.

The MACD indicator is based on volume , which can offer us a very valuable type of information (it marks the long or short strength of each candle), es pecially if we are operating in shorter time frames. Green = bullish signal; Red = bearish signal; Blue = MACD volume
Parameters: Fast: Numbers of bars used for fast period calculations Slow: Numbers of bars used for slow period calculations

Displays the local time with the time difference you set.
(It does not correspond to the time difference in 30-minute increments.)
It also displays a price line with a good price, such as 100.000 .100 or .200.
The standard gridlines are displayed with the time and price by MT4, but they are very confusing as they become the broker's time and are displayed at the halfway point along with the price. It hides them and displays gridlines at user-defined time differences and prices in easy-to-unders

BeST_Breakout Strategy is a Metatrader Indicator based on a proprietary algorithm implementing a very powerful tool that can exploit every breakout leading to huge market movements. It timely locates the most likely points for Entering the Market as well as the most suitable Exit points and can be used successfully as a standalone Trading System which often results in huge profits accompanied by very impressive statistics like Success Ratio and Profit Factor.
The BeST_Breakout Strategy is a

The indicator is based on the analysis of the volatility of a trading instrument.
The indicator does not repaint (except for the last candle).
On the chart it looks like 2 lines (estimated support / resistance levels) and displays arrows when a trend changes.
It can be used on any timeframe, but best of all, the indicator shows itself on timeframes from H1 and higher.
Extremely easy to set up and use.
Input parameters:
Sensivity - indicator sensitivity. The lower the value, the faster the
SPECIAL PRICE Great offers on all products. Great opportunities.
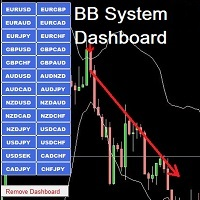
BB System Dashboard is a dashboard that collects signals from the currencies you will select, or from all the currencies of your metatreder by setting the item Check all currency pairs. The buttons are clickable and open the desired chart. Whenever there is a signal, the dashboard warns you with a visual and audio signal. You can immediately open the chart and then open the position. This dashboard will help you to be more profit
BO Trade Simulator is an excellent indicator that will allow us to test our Binary Options strategies correctly and at the desired time.
The Indicator allows you to put amount, expiration time and percentage of profit, everything a Binary Options trader needs without the need to test with demo accounts in different brokers since you will be able to do everything from your Metatrader 4 platform.
Its use is designed to be simple and practical, from the options you can indicate the desired param

Определение текущей тенденции - одна из самых важных задач трейдера независимо от стиля торговли. Индикатор Trend Selection поможет с достаточно высокой вероятностью это сделать. В расчетах индикатора используется авторская методика. Trend Selection подходит для любой валютной пары, любого таймфрейма, и не меняет свои показания. Цвет гистограммы зависит от силы текущей тенденции: чем темнее гистограмма, тем сильнее текущая тенденция. На текущий момент индикатор имеет два метода расчета сигн

PM Redefine : Is Simply, Simple, Straight and Direct in opening orders and closing of orders;
PM Redefine : Can be run in all type of instrument.{Forex, Commodity ,Stock, or Cryptocurrencies}.
PM Redefine : Can be run in all type of TimeFrame,{M1,M5,M15,M30 , H60, H240, D, W, M}.
PM Redefine : can be used for scalping and day trading.
Input Parameters
typeFrom_0_to_9: type in between 0 and 9 ; upper_levelAlert: if line cross this predefine level up , Arrow Buy show if : showArrow =true: lower_l

Diviner PRO Divine PRO indicator is based on the random forest machine learning algorithm. This is my first standalone product. In this indicator, all calculations of price patterns and the formation of indicator trading signals is performed through 43x Trees. I chose this amount to keep the indicator deep in training and reduce the size of the indicator. DIVINE indicator - universal indicator, can work with the following: EURUSD, USDCHF, GBPUSD . In the future I will conduct experimen

Broker Tester allow you to test the real terms applied by your broker. Using the 28 forex cross, this indicator records the changes in spreads for the duration of the test. It shows moreover the swap applied for long and short position for multiday trades. You can have a clear expression of the quality of your broker in a short time and maybe you can use this information to negotiate better conditions. In the input parameters, you can enter prefixes and suffixes used by your broker for naming

Индикатор LevelFractal - разработан на основе всем известного индикатора Fractal, он берет значения нескольких ближайших к текущей свече фракталов, вычисляет некое среднее значение и, исходя из него строит уровни поддержки и сопротивления. Когда цена пробивает один из этих уровней, появляется сигнал или на покупку или на продажу, на графике они обозначаются стрелками. Индикатор работает на любом таймфрейме и на валютной паре. По вопросам приобретения полной версии пишите в личку.
CRAZY SALE! Was 250, NOW 50 USD till the end of MAY!!!
---> Check all the other products <---
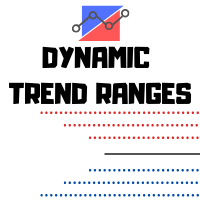
The WTR Dynamic Range Indicator is a powerful and deeply customizable range indicator that takes in account the average upward and downward movement of the price in the past trading days. This fully customizable indicator can be setted for a lot of uses and cases:
• Trend trading on level breakouts
• Spotting high probability targets for Take Profits
• Setting a multiple targets for position scali

Добрый День уважаемые трейдеры! Вашему вниманию индикатор созданный и работающий на базе трендовика ADX, для торговли на смене направления движения который учитывает коррекцию и даёт возможность на ней заработать. Применяю этот индикатор для скальпинга. Рекомендую таймфреймы от 15 ти минутного(М15) до часового (Н1) периодов. Красный кружок сигнал на продажу- Sell) Зелёный кружок сигнал на покупку Buy) Чем меньше ваш таймфрейм тем меньше пунктов вы зарабатываете. Важно выставлять стопы! !В
This analytical tool is one of the options for Zigzag indicators. On the price chart, it displays arrows. Therefore, ZigZag belongs to the category of arrow indicators. Each arrow indicates a trend reversal. red arrow means a downtrend has formed. green arrow means an uptrend has formed. It is worth considering the redrawing of ZigZag Trend signals - on a zero candle the arrow may appear and disappear several times and the final result will not be displayed at all. But if it appeared and was tra

BZSZ (Buy Zone Sell Zone) follow trend. buy zone if price is above the line, sell zone if price is below the line Works in USDTRY/EURTRY/GOLD/SILVER/EURUSD/EURJPY/GBPUSD/EURGBP/GBPJPY/AUDJPY/AUDUSD/AUDCAD/US500/JP225 and all pairs
Best timeframes
Signal on close of a bar.
DOES NOT repaint. DOES NOT repaint. DOES NOT repaint. DOES NOT repaint.
DOES NOT recalculate. DOES NOT recalculate. DOES NOT recalculate. DOES NOT recalculate No Settings

Yasha Firooz에 대한 정보
Yasha는 2012년에 자산 관리 회사의 직원이었습니다. 그는 다양한 사무 및 기술 업무를 위임받았으며, 일부 자산 관리 팀과 설립자의 요구 사항을 연결할 수 있었습니다. 자산 관리 회사는 거래 산업에 많은 투자를 했습니다.
FX Fishing MT5(Meta Trader 5 지표)에 대한 정보
Yasha는 시장 변동성에 대해 걱정했고, 황소와 곰 사이의 시장 파동을 느낄 수 있는지 고민했습니다. 따라서 그렇게 할 수 있는 지표를 전략화했습니다. 모든 상승 핍은 계산되고 모든 하락 핍은 계산됩니다. 이 두 개의 틱은 아래에 표시된 지표 이미지와 같이 표시됩니다.
- 녹색 숫자(상승 틱/핍)
- 주황색 숫자(하락 틱/핍)
중앙 아래에 표시된 숫자는 상승 및 하락 변동성의 차이입니다. 강한 황소 또는 곰 볼륨을 나타냅니다.
낚시 지표는 1:2 비율로 작동하며, 오른쪽의 색상 점에 표시됩니다. 녹색 = 황소 빨간색 = 곰 주황색 = 측면

Gossamer is a moving average ribbon indicator that uses a novel approach to identify breakout trades in trending markets. By applying a progressive period shift to each moving average, levels of consolidation become visible. Enter trades when price breaks out in the direction of the prevailing trend. Stoploss should be located on the other side of the consolidation from the breakout. Profits can be taken at the next consolidation or the stoploss trailed and the position built. Applicable to al

Trend Trading. Trend trading is a strategy that allow to trade the market by identify the direction of the price movement in near future ( according to the time frame ). A trend is a tendency for price to move in a particular direction ( Up (as a Uptrend) or Down (as a Down trend) ) over a period of time, sufficiently for open a position and close it in profit. This indicator is showing an Uptrend (Aqua line) and Downtrend (Magenta line). A point of a transition from one color to another is a g

Table of most usable Indicators. Technical Indicators actually work. keep in mind that Technical Indicators won't automatically lead you to profit, but they will do a lot of work for you. In fact, Technical Indicators can do a few wonderful thing: help to find a trade idea; help to find a trend; save time for analysis; show something that not obvious; working with mathematical consistency.

Good day!
To your attention the ForexdivergencePS indicator may not be the newest in the trading strategy
The Forex indicator detects and displays descending and ascending divergences on the chart. When a new pattern is formed, a pop-up window is triggered. An arrow is formed on the chart that shows the type of phenomenon and helps to open an order in the optimal direction.
Friends of traders rate the effectiveness of the tool as above average. You can change settings, including the sensitiv
My Intraday trading session indicator. SL Session Strength 28 Pair https://www.mql5.com/en/market/product/57585 This strategy is even used by the Banks to make profits. They take a strong currency and pitch against a weak currency This indicator allows you to analyze the hidden trends and correlations between the 8 most traded currencies via unique strength meter which creates multiple charts in a single window based on the price action of each currency in relation to all other currenci

SMA Cross Envelopes Alert is a trend indicator based on the Moving average and Envelopes indicator. It'll alert signal on next bar open with the audio or pop up on the chart
when SMA crosses above the Envelopes upper line that the signal "Buy" alert
and SMA crosses below the Envelopes lower line that the signal "Sell" alert.
Settings
SMA: Simple moving average setting period
Envelopes: Envelopes setting period
Deviation: Envelopes setting deviation (%)
Send_EMail: enable/disable sending

PULL IT BACK is a revolutionary trading system and a complete strategy with advanced algorithm developed to detect the trend direction after a PULLBACK , a RETREACEMENT or a KEY LEVEL BOUNCE . The goal of this indicator is to get as many pips as possible from market trend. Following strictly the rules of the strategy, you can become a better trader and have more safety entries in the market. Best features of our trading system are: Arrow Never repaint Arrow Never lagging Alert appears only
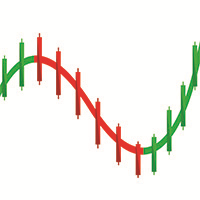
Trend Indicator
This Indicator detects the essential momentum in the market and lets you know when the market has a potential trend
Green means we are going higher and Red Means we are going Lower,
You can customise the Line to Any Color.
The alerts come in immediately there is a potential signal
Defaults Length : 55
This is the Depth of your averaging calculation. The bigger it is the more noise is filtered.
55 Is the Best Optimum Setting For This Indicator

StarTrend è un indicatore a freccia che identifica, con alta probabilità, l'inizio di un nuovo trend. La sua versatilità, però, permette di utilizzarlo anche in strategia in cui cerchiamo operazioni a favore di trend. StarTrend può essere la base del proprio sistema di trading oppure può integrare, per dare conferme o suggerimenti di astensione, il tuo sistema già collaudato. StarTrend invia segnali di preallarme quando c'è un probabile rallentamento della forza del trend e poi disegna una stel
Chart Slice is a very convenient multi-timeframe indicator, with which you can see market information at once on several time slices. This will allow the trader to learn quickly and most importantly understand the vibrant market . The author himself went this way and this indicator helped incredibly. You probably have often wanted to see in detail why at a given point in time the price was rapidly moving away from a certain level or, on the contrary, stopping there. And for this you had to chan

The New York Stock Exchange Session's Hours
This indicator facilitates observing the currency pair's quotations during subsequent parts of the stock exchange session live. Before the session starts, a rectangle is drawn on the chart but not filled in with color. It means the extent of the session duration. Before the first bar enters the rectangle of the session, a sound signal or pop-up window will notify us that the session will just start. When the price graph crosses the edge of the sessio

The NASDAQ Stock Exchange Session's Hours
This indicator facilitates observing the currency pair's quotations during subsequent parts of the stock exchange session live. Before the session starts, a rectangle is drawn on the chart but not filled in with color. It means the extent of the session duration. Before the first bar enters the rectangle of the session, a sound signal or pop-up window will notify us that the session will just start. When the price graph crosses the edge of the session

The "Atomic direction Trend Power Currency Strength Pro" indicator measures the strength of the up and down trend of the 8 main currencies USD-EUR-GBP-AUD-JPY-CAD-CHF-NZD Principal functions: 1) Show the current position of 7 currency pairs simultaneously. 2) Sort the position of each currency pair according to the market level. 3) Calculate and indicate the main trend of each currency.
This indicator unites the main elements of the market information by means of correlations, simplifying buy

스캘핑 인스턴트 인디케이터.
지표의 기저값과 함께 매수 또는 매도 신호가 화살표로 표시됩니다.
화살표와 4개의 시간대를 표시하는 지하 표시기가 예보에서 일치할 때 강한 신호로 간주됩니다.
이 지표에는 Skalping 인스턴트 지표가 제공하는 하나의 결과로 축소된 많은 알고리즘과 작업이 포함되어 있습니다. 즉, 거래자에게 시장의 방향을 알려줍니다. 따라서 그는 제공
1. 스캘핑 신호(그림 1) 그림 1-D1과 같이 D1 차트의 선택된 기간과 지표의 지하 섹션에 매수 신호가 있습니다. 신호는 지체 없이 도착합니다. 이 경우 스캘핑 전략을 사용하여 거래하는 것이 좋습니다.
2. 신호 수정 또는 추세. 그림 2와 같이 지하실에서 그래프의 모든 기간에 대해. 모든 기간은 빨간색 영역 -> 매도 위치에 있습니다. 차트 자체의 기간과 지하 지표가 일치할 때 색상이 변경될 때까지 거래를 보류하십시오. 따라서 지표는 다른 전략에 상당히 적응할 수 있습니다.
주요 통화 쌍에 사용하는 것이
The Trends Signal indicator displays the direction of the trend with arrows, works in a simple and clear way. It uses a combination of reliable and simple indicators to analyze prices. The signals of the Trends Signal indicator can be interpreted as follows: buy when the bars are colored blue, and sell when they are red. An effective indicator with a wide range of three parameters for trading.
Parameters: Length - The number of bars to calculate. LevelUP, LevelDN - Levels for determining overb
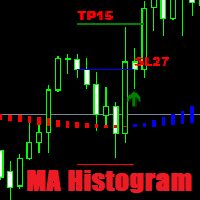
Commercial version of open code . A forex trader can create a simple trading strategy to take advantage trading opportunities using MA Histogram or associated indicators. MA Histogram are used primarily as trend indicators and also identify support and resistance levels.
Improved version 1.30 XXX
Added: Take Profit Stop Loss Automatic optimization Result R/R Consecutive losses

Trend Transition is a hybrid indicator, as it is based on signals from several well-known products: RSI and MA. MA is a trend indicator of the average true range, which determines the range of minimum and maximum price fluctuations, as well as closing prices. RSI is an indicator of the family of oscillators. The indicator helps to calculate the oversold and overbought levels of a trading instrument.
When a trend changes, the Trend Transition indicator uses a color alarm: blue - when changing f
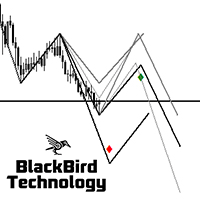
This indicator displays three forecast projections of the last market swings based on the Zig Zag indicator. Price action moves very often according to what happened in the near past, the indicator displays the price pattern that the market will possibly follow. Both short and long patterns are displayed in the chart with an indication of the target price level. If multiple projections overlap or almost overlap, then the next price movement becomes very likely. In this case it's a ranging market

The indicator detects important peaks and troughs (extremes) on the chart. These points can be used to plot support/resistance levels and trend lines, as well as any other graphical analysis. These points can serve as reference points for setting trading orders. The indicator does not redraw .
Settings:
Size_History - the size of the calculated history. Num_Candles_Right - number of candles to the right of the peak or trough.
Num_Candles_Left - number of candles to the left of the peak or
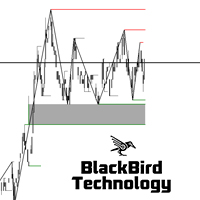
Dear Traders, check out my new multi level market liquidity indicator : https://www.mql5.com/en/market/product/73098
Many of you have been trading very good with this indicator, thanks for the support and positive feedbacks ! For more information about market liquidity, a manual on how to use this indicator please send me a message. A lot of information can be found on the net. (search liquidity trading/ inner circle trader)
https://www.youtube.com/watch?v=yUpDZCbNBRI
https://www.youtube.com/

The indicator is usefull for: binary options and forex trading..
.Support all trading Pairs.
--->Recommended expiration time for 3 to 5 candles. Exemple:
Time frame 1 minute then expiration time will be 3 to 5 minutes.
The indicator support MT2trading autotrading platform ;
SELL BUFFER : 0 (red arrow)
BUY BUFFER : 1 ( green arraw)
See #screenshot1.
This is a premium powerfull indicator show hight daily winrate..

This indicator uses several complex algorithms to accurately determine the trend. All algorithms are based on Price Action, so on the one hand there is no loss of time, for example, that the entry is only made at the end of the trend and you already have a few pips less, this does not happen with this indicator. On the other hand, this is also much safer, because international trading is almost completely based on Price Action. The input parameter "Number" is the number of applicable conditions
Standart MACD indicator but All parameters can be changed for users. Extern Inputs: FastMA method : Simple, Exponential, Smoothed and Linear Weighted FastMA Price : Close, Open, Low, High, Median, Typical and Weighted FastMA count : Default is 12 SlowMA Method : Simple, Exponential, Smoothed and Linear Weighted SlowMA Price : Close, Open, Low, High, Median, Typical and Weighted SlowMA Count : Default is 26 Draw Mode : Line or Histogram SignalMA Method : Simple, Exponential,

Email and push notification Alert This is very powerful tool to get Detailed view of all of your trading on same spot. it can send 2 types of alerts, Email Alerts Push Notification
1: Email Alert email alerts are consist of 4 sections Section 1 includes Account number and name details Section 2 includes Account Balance Equity and Floating Profit/Loss details. Section 3 includes Pair wise Profit and loss Section 4 includes Pair wise+Order wise Detailed view of all trades. its includes numbers

On top of a market has three consecutive rise brick, when price lower than the continuous rise of brick of the lowest price, can do sale, if there is a pay before, should be liquidated, until after a period of time, a reversal (three consecutive falling brick brick of the highest high with new price break), at this time, can hold some sell single warehouse, at the same time set up the check.

Indicator designed for binary options trading buy signals come along with hiding a new candle blue arrow on histogram buy signal red arrow on histogram sell signal buy worth 1 or 2 candles the signal appears with the opening of a new candle but may appear during its formation it’s worth entering the deal only when the signal has arrived at the opening, the signals do not disappear Recommended currency pairs: Any Timeframe: up to H1 You can customize the PERIOD parameter to your trading style Rec

The indicator draws support and resistance lines on an important part of the chart for making decisions. After the trend line appears, you can trade for a breakout or rebound from it, as well as place orders near it. Outdated trend lines are deleted automatically. Thus, we always deal with the most up-to-date lines. The indicator is not redrawn .
Settings:
Size_History - the size of the calculated history. Num_Candles_extremum - the number of candles on each side of the extremum. Type_Arrow
NO REPAINT The system combines several analytical techniques and presents BUY/SELL signals in an easy-to-read form. You don’t have to be a professional to use it. Conservative TP SL can make amazingly accurate market predictions by constantly auto-analyzing every price movement, trading patterns and with the help of complex trading algorithms. This indicator main task is to look for gravity zones and generate buy/sell signal with exact SL and TPs location. When specified conditions are fulf
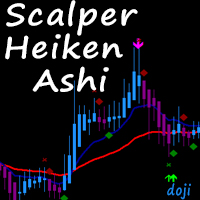
There are several types of Patterns, We choose Doji that is used for continuation and trend reversals.
Signal types : #1 Premium Signal- ---------------- Doji should have the colour of the expected direction change along with normal candle colour matching direction.
#2 Secondary Signal ---------------- Doji has the perfect formation however the bar maybe in the same colour as the previous bar but the candle colour has new direction colour.
Stochastics-Filter: ---------------- The Stochas

FEATURES OF THE HELPTRADER TO ENTER THE MARKET INDICATOR ! four types of moving averages for building a channel; ! ability to select the width of the flat (Central MA) and the margin for the channel borders; ! four options for the display channel; ! three settings for the appearance of the arrow signal; !customizable notification system. The arrow channel indicator HelpTrader to Enter the Market, due to its variability, can become a fairly effective tool for trading in combination with other in

Multi Strategies Combined Signal All in One Multi Strategies Single Combined Select from up to 6 Strategies solo or Combine different strategies for signal generation (Combining more than 2 strategies may LIMIT a lot the number of signals)! ALL inputs and Strategies selection From Chart !!! Also Inputs editing from Chart !!! Push your strategy bottom (one strategy) OR Combine signal from as may strategies (up to 6) : Selected and enabled strategies will be in GREEN !!! 1- BUY SELL areas 2-

---> Check all the other products <---
The Multi Time Frame Chandelier Channel is a good synthesis of the chandelier trailing stop and let you analyze the trend.
Enter when the price breaks one of the two lines, then trail using the opposite line. Ideal for scalping, entering after the dot appears.
Plenty of customization: Choose the lookback period, the longer, the slower Choose the Time Frame to use (must be greater or equal your chart TF Play around with the options to get the opti
NO REPAINT The system combines several analytical techniques and presents BUY/SELL signals in an easy-to-read form. You don’t have to be a professional to use it. Aggressive TP SL can make amazingly accurate market predictions by constantly auto-analyzing every price movement, trading patterns and with the help of complex trading algorithms.
This indicator main task is to look for gravity zones and generate buy/sell signal with exact SL and TPs location. When specified conditions are fulfi

Reflector is an auxiliary tool for technical analysis, which helps to determine the direction of the trend: either upward or downward price movement on the selected trading instrument. The indicator is an indicator of a trend type; it smooths out price fluctuations during signal formation by averaging data. The indicator uses calculations designed to smooth out sharp fluctuations that do not affect the overall picture of price movement.
A trend can be increasing (bullish trend) and decreasing

Icebreaker trend indicator provides an opportunity to classify the direction of price movement, determining its strength. The solution to this problem helps to enter the market on time. You can not only see the direction of the trend but also the levels by which you can work.
The indicator determines the prevailing trend in the price chart. But not only, but also analyzes the price movement, and indicate the points of possible reversals. This contributes to the quick and optimal opening of buy

MACDneun gajang ingi issneun momenteom mich chuse jipyo jung hanaibnida. tonghwa gangdo cheugjeong-gineun yeoleo tonghwaleul giban-eulo haneun chuse jipyoigido habnida. MACD tonghwa gangdo cheugjeong-gineun MACD mich tonghwa gangdo cheugjeong-giui algolijeum-eul gajin hanaui chateu jipyoibnida. ttohan won keullig gineung-i iss-eo daesibodeue 28gaeui juyo ssang-gwa bojo ssang-i pyosidoemyeo teugjeong ssang-eul keullighamyeon chateuga jadong-eulo seontaeghan chateulo byeongyeongdoebnida. jepum ja

Moving Average of Momentum This indicator shows you trend and also how strenght it is together. You can use this indicator for your own experts with iCustom() Momentum is in the buffer ( 0 ) and moving average is in the buffer ( 1 ) there are afew parameters for using this indicator on different currencies and different time frames. you can test it and optimize it . Input Parameters: MomentumPeriod: default is 40 SignalMaPeriod : default is 28 SignalMAMode : default is SSMA

The Open Trend indicator calculates the saturation levels of the price chart. Most often, a good trend is visible on a price chart visually. But an experienced trader should clearly understand the current balance of power in the market before entering.
A signal to exit the oversold area is a buy signal. A signal to exit the overbought area is a sell signal. Usually, you need to set the relative values for the overbought and oversold levels Bottom and Top for this indicator.
The Open Trend i

Smart Psar its an strategy indicator, based on the strategy of parabolic sar and exponencial moving average of 30 periods, when them aim to a long trend, then a white arrow will spawn in the high of the candle and it will a draw a line to follow the trade near the candles , before a time when the conditions are gived ,then a close position signal will be appear like a white check,but also if them aim to a shoty trend, then the arrow will be turn yellow spawning in the low of the candle and it wi

The GBP index is an index (or measure) of the value of the Great British Pound relative to a basket of foreign currencies, often referred to as a basket Britian. trade partners' currencies. The Index goes up when the great british pound gains "strength" (value) when compared to other currencies. Displays a GBP chart in a separate window of the current chart. Based on EURGBP, GBPSEK, GBPUSD, GBPJPY, GBPCHF . All these pairs should be added to Market Watch for indicator to work. customizable mov

Term "shark" in the business world denotes a high volume investor who just made a good investment in a highly Potential business deal.So, sharks are the ones who make the market move. In our case, if an American shark bought a Japanese company, he/she has to convert American dollars into Japanese yen to make the deal. So, the demand for the Japanese yen will increase sharply. Thus USD/JPY will go short rapidly if the deal was from the shark. Another example, In the case of forex, if fed increa
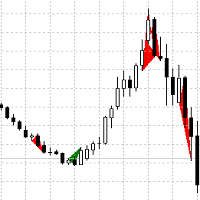
A trend indicator based on the definition of several types of candle combinations, the triangle formed is colored with the corresponding color, the red trend is down, the green one is up. Candlestick combinations of standard and non-standard types with additional conditions for their definition. The recommended timeframe is M30,H1,H4, D1. When combined with other trend indicators, it will provide more accurate points of entry and exit from the market (buying and selling).
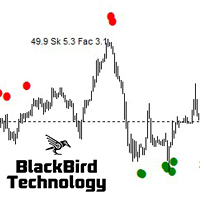
Dear Trader, this is one of the most powerful signals you will find in the market place. I worked many months to improve the accuracy. Check for yourself with the demo version. Parameters are set for EURUSD. I can assist you to configure it for any other symbol or TF. It can be configured to generate more of less in-trend or contra-trend signals. Extreme Swing Indicator is a no-nonsense, no delay, no repaint indicator ! It selects buy/sell entry signals based on a number of swing calculations a

A trading range takes place when a financial instrument (stocks, indices, bonds, commodities, Forex currencies or cryptocurrencies) oscillates between two upwards and downwards boundaries for a period of time. This Indicator tool help us to view range on the chart bar per bars, also set range in percent and get clean posicion. Range trading works best in the absence of a trend. When the markets lack a clear direction, that’s when these consolidation periods settle in. Alternatively, more exper

Hi Friends! this is countdown candles with 4 functions. 1. Countdown current Candles 2. Countdown H1 timeframe. 3. Countdown H4 timeframe. 4. show the spread index and the lowest spread value within 5 minutes. Instructions for installing and downloading this indicator in the link below. https://www.youtube.com/watch?v=fi8N84epuDw Wish you have a happy and successful day.

Liquidity Buy Sell Signal Indicator is a no-nonsense, no delay, no repaint indicator ! Liquidity pools together with a trend filter is the most powerful and reliable signal according to me (with the correct parameters depending on the timeframe used) It selects buy/sell entry signals based on liquidity in the market. The time range to scan for liquidity can be set in the parameters. Liquidity is an important aspect in the market, especially for institutional investors, as they need lots of liqu

The Trend Change indicator allows you to use the moving average to indicate to the trader a change in the direction of the trend movement. This is a modified indicator, the advantage of which is the ability to keep up with rapid changes in price dynamics in the presence of excellent SMA smoothing over the period. I recommend the standard indicator settings. Apply on a timeframe not lower than M30

SYMBOL POWER based on inputted 5 time frames and Compared to 20 Other Symbols !! Great Indicator YOU DON'T HAVE TO SHIFT ON ALL TIME FRAMES FOR EACH CURRENCY PAIR TO CONCLUDE ITS TREND AND ITS POWER YOU HAVE IT ALL IN ONE TABLE , 20 CURRENCY PAIR WITH 5 TIME FRAMES ALSO , COMPARE BETWEEN CURRENCIES STRENGTH AND ALERTS THE STRONGER /WEAKER PAIR BASED ON 5 TIMEFRAMES CALCULATIONS ALEERTS enable /disable using 5 time frames M5 M30 H1 H4 and D1 ( latest version You SELECT you own 5 timeframes fr

This indicator is only working in M1 period.it is predicting end of horizantal trend by using envolepes indicator. After takeprofit predicted, this indicator will open 4 orders as buy and sell. One of the order is market type, others are limit type. There are 25.5 and 70 pips range between these limit type orders. After market type order reach its target other limit orders will be deleted automatically. Note that this system is not martingale, this system is creating limit order. T

MACD Cross with additional features which conditions must met if there was set on 1. Stochastic Limit : Buy Above, Buy Below, Sell Above & Sell Below 2. RSI Limit: Buy Above, Buy Below, Sell Above & Sell Below 3. EMA Limit : Buy if EMA1 & EMA2 above EMA3, Sell if EMA1 & EMA2 below EMA3 It also can set whether show arrow and sound alert. MACD, RSI, Stohastic and EMA values can be changed according each user
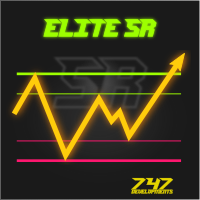
Elite SR - Advanced Level Indicator for automatic detection of support and resistance levels with different degree of credibility should become a part of your trading arsenal. This indicator is accessible via iCustom function and provides level values as well as their degree of credibility. Elite SR is fully adjustable and can work on any time-frame with any trading instrument!
Important information For all detailed information about this indicator you can visit 747Developments website.
Featur
Average Directional Movement Index Technical Indicator (ADX) helps to determine if there is a price trend. It was developed and described in detail by Welles Wilder in his book "New concepts in technical trading systems". This ADX Signal Scanner will search in Market Watch for a good Entry Point on the chart on every Time frame interval. You can set it to view back shifted signals with custom ADX period, levels and more.

This system never paints. This system created by using Envolpes bands and reverse bar count. This indicator is only working in M5 period. This system is for long term and profitable. Signals are shown as arrows. as an optional limit orders. You can set a voice alarm or email notification. You can fins our other products from link : https://www.mql5.com/en/users/drbastem/seller Also, you can ask all your questins from email : haskayafx@gmail.com or mobile : +90 530 867 5076 or @Meh
MetaTrader 마켓 - 거래자를 위한 로봇 및 기술 지표는 거래 터미널에서 바로 사용할 수 있습니다.
The MQL5.community 결제 시스템은 MQL5.com 사이트의 모든 등록된 사용자가 MetaTrader 서비스에서 트랜잭션을 수행할 수 있습니다. 여러분께서는 WebMoney, 페이팔, 또는 은행 카드를 통해 자금을 예치하거나 인출하실 수 있습니다.
트레이딩 기회를 놓치고 있어요:
- 무료 트레이딩 앱
- 복사용 8,000 이상의 시그널
- 금융 시장 개척을 위한 경제 뉴스
등록
로그인
계정이 없으시면, 가입하십시오
MQL5.com 웹사이트에 로그인을 하기 위해 쿠키를 허용하십시오.
브라우저에서 필요한 설정을 활성화하시지 않으면, 로그인할 수 없습니다.