MetaTrader 4용 무료 기술 지표 - 30

Indikator zur klaren Anzeige im Metatrader
Dieser Indikator wurde von mir Entwickelt damit die Anzeige der relevanten Parameter klar und deutlich im Chart auf einen Blick zu sehen ist. Er dient zur Information und ist ohne Gewähr. Folgende Parameter werden angezeigt:
- Der Aktuelle Kurs - Das Aktuelle Handelspaar - Die Restzeit zur nächsten Kerzenbildung / Zum Abschluss der Aktuellen Kerze - Die Kontonummer des Handelskontos - Die Frei Verfügbare Margin - Die Margin auf 1 Lot - Der Akt
FREE

This indicator helps you determine the evolution of the price depending on how these fly objects are shown in the chart. When the gliders opens their wings considerably warns us of a possible change in trend. On the contrary, when seems to get speed (looks thin because lines of wings are grouped) demonstrates safety and continuity in trend. Each wing of a glider is a directrix between the closing price and the high/low prices of the previous bar. The color (green/red) of each glider foresees bet
FREE

This indicator will turn the colors of your candles into a trend oriented colored showing 4 different colors based on two moving averages and the slope of the slow moving average. very powerful indicator for all periods of time showing you the direction of the trend to confirm your trades.
Green: Bullish
Dark Green: Bullish Weak
Light red: Bearish Weak
Red: Bearish
For more info:
https://linktr.ee/trader_1st
FREE

The LevelsPivotMT4 plots the pivot points and forms the support and resistance levels. The indicator does not repaint.
Default colors Yellow - pivot point. Green - resistance levels R1, R2, R3. Red - support levels S1, S2, S3. Installed similar to any standard indicator.
Analysis rules Trade the rebound from support or resistance lines. Accordingly, the target is the central line (the pivot point, yellow by default).
FREE

Harrow Band is an indicator based on support and resistance values. This indicator provides six bands that indicate the nearest of support or resistance position. With this indicator, it will be easier to see where entry and exit points of a trade are located.
Pairs and Timeframes This indicator can be used in any pairs and timeframes, but it is recommended to use it in XAUUSD H1.
Parameters NumCandle - number of candles used to calculate the support and resistance position. BandColor - colo
FREE
Become a constantly profitable 5-star forex trader!
We offer a few indicators to support you understand and analyse the market! With our strategies you will improve your trading system and bacome an expert...
We have indicators for trend direction, market direction and others.. for multi-time frames and that covers all majors or your favorite trading symbols! Some of them offer a customizable calculation parameters... or Graph features!
See how powerful they are! The are also easy-to-use
FREE

The indicator represents 4 moving averages, shifted back. Created, like any moving average indicators, in order to see the approximate balance of volatility and the number of bulls and bears. The difference from other Moving Averages is that an attempt is made here to bring the moving averages of different periods to a common denominator, respectively, to bring the number of traders trading on different timeframes to a common denominator. The indicator is distributed as is.
MnojitelMA1, Mnoji
FREE

Add indicator "Symbol Name Drawer " on chart. Indicator creates text object with name of current symbol.
You can change symbols on chart and indicator automatically changes text.
Free to use. Simple tool.
If you have any suggestion you can write me about it in comments. I try to improve this tool in future versions. Thanks for using my indicator. If you want to order something special in mql4 or mql5 message.
FREE

This indicator smoothes the value of CCI (Commodity Channel Index) and reduces its volatility. By using this indicator, the fluctuations created by the CCI indicator are reduced. The smoothed CCI value is placed in a buffer that you can use in your EA and strategy. Leave me a comment if you want By using this indicator, you no longer need to use the Moving Average indicator on the CCI indicator.
FREE

Magneto Power MA - трендовый осциллятор. Основан на классическом индикаторе moving average, но при этом имеет нестандартный способ интерпретации. Здесь нет никаких фокусов с пересечениями мувингов, только гибридная работа MA и волатильности инструмента. При этом при должной настройке может составить конкуренцию дорогим и сложным аналогам. По гистограмме индикатора легко определить текущую тенденцию, а так же исчерпало себя движение цены или ещё нет. Настройки индикатора аналогичны классическому
FREE

This indicator is a system of channels based on the minimum and maximum price values. The task of the indicator is to visualize the trend direction and support/resistance lines. The indicator is designed to be used in combination with indicators of the "Signal" or "Candles" series (a lot of free indicators of this type can be found on my page). At the same time, the indicator can be used independently according to the following rules: Buy/Sell signals are used to open a position only in the dire
FREE

Comb 표시기는 벌집 모양 격자 또는 정육각형을 표시합니다. 표준 거래 터미널 그리드의 대안. 표시기 설정 설명: color_comb - 그리드 색상 너비 - 너비, 예: 해상도가 1920 * 1080인 화면의 경우 22, 해상도가 1366 * 768인 화면의 경우 15 등 높이 - 높이, 예: 해상도가 1920 * 1080인 화면의 경우 6, 해상도가 1366 * 768인 화면의 경우 4 등 표시기는 벌집 모양 격자 또는 정육각형을 표시합니다. 표준 거래 터미널 그리드의 대안. 표시기 설정 설명: color_comb - 그리드 색상 너비 - 너비, 예: 해상도가 1920 * 1080인 화면의 경우 22, 해상도가 1366 * 768인 화면의 경우 15 등 높이 - 높이, 예: 해상도가 1920 * 1080인 화면의 경우 6, 해상도가 1366 * 768인 화면의 경우 4 등
FREE

This is an original trend indicator. The indicator draws three lines in a separate window. Its values vary from -1 to +1. The closer the indicator is to +1, the stronger is the ascending trend. The closer it is to -1, the stronger is the descending trend. The indicator can be also used as an oscillator for determining the overbought/oversold state of the market. The indicator has one input parameter Period for specifying the number of bars to be used for calculations.
FREE

Индикатор рассчитывает волатильность относительно свечи заданной в настройках, в заданном диапазоне. period -диапазон для расчета максимум минимум. point - номер свечи от которой будет рассчёт (нуль текущая цена). По всем вопросам можно обратиться на сайте через форму обратной связи или в комментариях в ютюб. Также на сайте есть другие работы ссылка в индикаторе на вкладке общее .
FREE

Do you use dynamic ranges (like Bollinger Bands or Envelopes) in your trading? A fixed period is usually used for such calculations. But is such approach relevant to the very nature of the market? In fact, the price chart consists of a series of successive processes - trends and flats. In this case, we can talk about the internal development logic inside a single process only. Therefore, the nature of the market is better described by dynamic ranges designed for the processes occurring "here and
FREE

Индикатор сглаженного Moving Average (xMA)
Входные параметры: xMA Period - период усреднения xMA Method - метод усреднения ( 0-SMA | 1-EMA | 2-SMMA | 3 - LWMA) xMA Price - используемая цена ( 0 - CLOSE | 1 - OPEN | 2 - HIGH | 3 - LOW | 4 - MEDIAN | 5 - TYPICAL | 6 - WEIGHTED) xMA Color - цвет индикаторной линии xMA Width - толщина индикаторной линии
Принцип работы
Индикатор перерассчитывает стандартный технический индикатор Moving Average (дважды усредняет получаемые значения iMA). Перио
FREE

Indicator for fast navigation through financial instruments. When you click on the button, you go to the chart of the financial instrument, the name of which was written on the button. In other words, the indicator opens or unfolds an existing chart window. For each chart, you can customize the name of the financial instrument, text color and background color; in total, you can customize symbols buttons that you trade often. The indicator can be installed on any charts for which you need to swit
FREE

Tibors Timer - Indikator zur Übersicht und Klarheit im Chart
Dieser Indikator wurde von mir geschrieben, da ich oftmals die wichtigsten Informationen während eines Trades bzw. im Chart mühevoll suchen musste. Bitte täglich neu in den Chart ziehen. Er zeigt folgendes an: - Akuteller Kurs - Aktuelles Handelspaar - Die Zeiteinheit - Die Restzeit zur nächsten Kerzenbildung - Die Nummer des Handelskontos - Die Frei Verfügbare Margin - Margin auf 1 Lot - Der Aktuelle Hebel - Der Aktuelle Sppr
FREE

Трендовый индикатор предназначенный для поиска так называемого разворота цены. Который точно показывает трейдеру момент разворота цены. Данный индикатор лучше всего подходит для выставления стоп ордеров, а также для установления движения тренда или настроения рынка.Лучше всего работает в момент установления на рынке сильных трендовых направлений движения , которые происходят приблизительно 40% времени. مؤشر الاتجاه المصمم للبحث عن ما يسمى بالنقاط المحورية ، الذي يبين بدقة للتاجر لحظة الانعكا
FREE
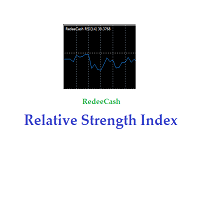
Version History Date Version Changes 07/09/2022 1.10 Initial released Description The RedeeCash RSI is your typical RSI indicator with the three latest RSI calculations exposed as global variables for easier integration with scripts and expert advisors. Code Sample To invoke this indicator from an EA or script, call the iCustom metatrader function, iCustom ( Symbol (), PERIOD_CURRENT , "Market/RedeeCash RSI" , 14 , 1 , 0 ); string RSIVarName = StringConcatenate ( Symbol (), "_rsi" ); string RSIP
FREE

The indicator analyzes TTF and ATR data to define the current trend and allow traders to gain maximum profit from strong price movements. The indicator is intuitively clear: line direction change - trend direction change. Change of the line color warns of a coming direction change.
Customized parameters:
Ind_Period (>1) - TTF calculation period; Sensitivity (>1) - ATR sensitivity. Alerts - show a dialog box containing user data; Send_Mail - sends an email using an address specified on the Em
FREE
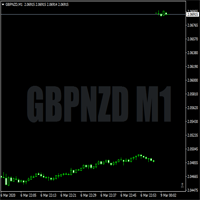
A small decoration for MT4.
Lettering in the background.
Shows the currency pair and time interval.
There can be a number of settings for changing the color, size, location, and time interval.
Promark Settings: TURN_OFF - enable / disable decoration;
Show Period-enable / disable the time interval;
MyChartX-x-axis location;
MyChartY-location on the Y axis;
My Corner-location at the corners of the chart;
My Font Size is the size of the jewelry;
Enjoy your use. Leave f
FREE

Adaptiv Ma это индикатор средняя линия значение которой выставляется в меню и применяется на тейфрейме Н4. В последствии она адаптируется к выбранному определенному таймфрейму. В меню индикатора задаются следующие параметры 1. Период индикатора 2.Метод определения Ма. 3. Стиль Ма. 4.Толщина линии Ма. 5.Цвет линии Ма.
При переключении между таймфреймами автоматически переключается значение периода Ма для адаптации к новому таймфрейму. Пишите насколько вам была полезен такой индикатор.
FREE

Всем привет, мои друзья, сябрыыы. Я трейдер, 20 лет опыта. Хочу продемонстрировать свой индикатор. Индикатор создан на базе в тесной кооперации с индикатором arrows_template. Данный индикатор рисует на графике инструмента (любого) индикатор AO(Awesom) поверх. Видите сам AO на графике. Видите пересечение зоны нуля, Блюдце и т.д.. Если будут подсказки, корректировки. Пишите смело, всех пошлю.......Шутка До свидания.
FREE
This indicator is based on the idea of a popular Trend Trigger Factor indicator (TTF). The indicator determines a price movement direction comparing high and low of the current candle with high and low of a price for a longer period. Parameters: Long_TTF_Bars - number of candles to calculate the price movement direction for a longer period of time (cannot be less than 2) Short_TTF_bars - number of candles to calculate the price movement direction for a shorter period of time (cannot be less tha
FREE
The indicator identifies the strength of the trend based on the points where the CCI indicator exceeds the overbought and oversold levels. This indicator: Suitable for all markets; Not redrawn; Intuitive and simple; It can be useful for both beginners and experienced traders; Allows you to identify market entry points where there is a high probability of a significant price movement sufficient for a successful transaction; Settings: Ind_Period (>1) - period of the indicator; Price - price f
FREE
This indicator allows to hide Stochastic oscillator (on all MT4 timeframes) from a date define by the user, with a vertical line (Alone) or a panel (with "Hidden Candles"). Indicator Inputs: % K Period % D Period Slowing Apply To Method Information on "Stochastic Oscillator" indicator is available here: https://www.metatrader4.com/en/trading-platform/help/analytics/tech_indicators/stochastic_oscillator ************************************************************* Hey traders!! Give me your
FREE

NZD INDEX
The Currency Index Project is ONE part of a thorough Forex study. Many people do not know the theoretical basis that drives currency exchange rates to move on the market. With this set of tools you will be able to have a more complete view of the entire market by analyzing not only the single currency of an exchange, but all the exchange rates that make up that currency by looking at a single window!
The indicator faithfully represents the real index of a single currency present in
FREE

This indicator calculate the minimum,maximum,average and relative (to points of the bar) spread in the chart applied period. The indicator must be applied to one or more different period on a Pair and analyze the spread for all the Pairs available by the Broker. The csv output for one minute chart is something like this https://gofile.io/?c=K5JtN9 This video will show how to apply the indicator https://youtu.be/2cOE-pFrud8 Free version works only for GBPNZD
FREE

The Shanghai Stock Exchange Session's Hours
This indicator facilitates observing the currency pair's quotations during subsequent parts of the stock exchange session live. Before the session starts, a rectangle is drawn on the chart but not filled in with color. It means the extent of the session duration. Before the first bar enters the rectangle of the session, a sound signal or pop-up window will notify us that the session will just start. When the price graph crosses the edge of the sessi
FREE

1、能显示货币之间的强弱 0是最弱 7是最强 2、能显示28个货币以及黄金 原油的 涨跌幅度 3、能切换货币对 4、能显示持仓订单的货币对 1、能显示货币之间的强弱 0是最弱 7是最强 2、能显示28个货币以及黄金 原油的 涨跌幅度 3、能切换货币对 4、能显示持仓订单的货币对 5、能利用键盘的的上下键切换货币对,左右键切换周期 1、能显示货币之间的强弱 0是最弱 7是最强 2、能显示28个货币以及黄金 原油的 涨跌幅度 3、能切换货币对 4、能显示持仓订单的货币对 5、能利用键盘的的上下键切换货币对,左右键切换周期 5、能利用键盘的的上下键切换货币对,左右键切换周期 1、能显示货币之间的强弱 0是最弱 7是最强 2、能显示28个货币以及黄金 原油的 涨跌幅度 3、能切换货币对 4、能显示持仓订单的货币对 5、能利用键盘的的上下键切换货币对,左右键切换周期
FREE

Infometer индикатор для вывода информации в одном из углов - сколько пунктов (пипсов) или в валюте депозита профита во всех отрытых ордеров данного торгового инструмента. В меню индикатора внесены такие данные 1. Угол вывода информации. 2. Цвет вывода информации. 3. вывод валюты депозита и пипсов. 4. Выбор вывода информации - профит и пункты - профит -пункты. На белом фоне автоматически информация выводится черным цветом на других фонах цвет вывода информации определяется в меню.
FREE
This indicator allows to hide Bill Williams Alligator (on all MT4 timeframes) from a date define by the user with a vertical line (Alone) or a panel (with "Hidden Candles"). Indicator Inputs: Jaws Period Jaws Shift Teeth Period Teeth Shift Lips Period Lips Shift Method Apply To Information on "Alligator" indicator is available here: https://www.metatrader4.com/en/trading-platform/help/analytics/tech_indicators/alligator ************************************************************* Hey traders!
FREE

CAD INDEX
The Currency Index Project is ONE part of a thorough Forex study. Many people do not know the theoretical basis that drives currency exchange rates to move on the market. With this set of tools you will be able to have a more complete view of the entire market by analyzing not only the single currency of an exchange, but all the exchange rates that make up that currency by looking at a single window!
The indicator faithfully represents the real index of a single currency present in
FREE
Useful indicator that incorporates two moving averages, for your favorite trading strategy. Moving averages are fully configurable, Period, Method, Color, Etc Just place it on your favorite timeframe.
The benefits you get : Never redesigns, does not retreat, never recalculates. Works on forex and CFD, timeframe from M1 to Monthly. Easy to use. Convenience for your trading.
FREE

This indicator maps price crossover with Simple Moving Average (SMA) for each candle. Works like a SMA but has non-repaint characteristic. How to Use: As stated before, this indicator works like a SMA. Use this to determine trend. When price is above this line then the uptrend is expected (downtrend if price below the line). 2 of these indicator (with different periods) can also generate buy/sell signal like 2 SMAs. When the lower period SMA crosses higher period SMA from below, then buy signal
FREE

This version of the indicator Floating Nest works only in the tester, on demo accounts and on real accounts on the USDCHF pair.
1. What is Floating Nest?
This indicator is designed to automate the construction of decision zones (can act as support-resistance levels) according to the Floating Socket strategy.
The same indicator allows you to significantly reduce the time when analyzing the behavior of prices in decision areas on historical data.
It works on any currency pairs. Time frame
FREE

The indicator defines the buy and sell arrows with high performance and consistent results. Suitable for trend trading or following the trend. Automatic analysis of market opportunities ; Help traders earn more from their investments;
Never repaints, recalculates or backpaints signals; This is FREE demo version of the indicator and works only on "EUR USD M5" . The demo version does not work on SUFFIX OR PREFIX brokers ! Forex Trend Commander All details about the indicator here :
FREE

This indicator effectively separates the tick volume in the forex market into bullish and bearish categories. Additionally, it provides the functionality to calculate and display the sum of bullish and bearish tick volumes for any selected period of your choice. You can easily adjust the period by moving the two blue lines on the chart, allowing for customizable and precise volume analysis tailored to your trading needs.
FREE
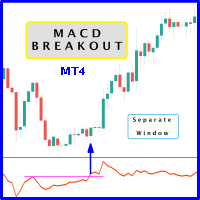
Probability emerges to record higher prices when MACD breaks out oscillator historical resistance level. It's strongly encouraged to confirm price breakout with oscillator breakout since they have comparable effects to price breaking support and resistance levels; surely, short trades will have the same perception. As advantage, many times oscillator breakout precedes price breakout as early alert to upcoming event as illustrated by 2nd & 3rd screenshot. Furthermore, divergence is confirmed
FREE
Probability emerges to record higher prices when MACD breaks out oscillator historical resistance level. It's strongly encouraged to confirm price breakout with oscillator breakout since they have comparable effects to price breaking support and resistance levels; surely, short trades will have the same perception. As advantage, many times oscillator breakout precedes price breakout as early alert to upcoming event as illustrated by 2nd & 3rd screenshot. Furthermore, divergence is confirmed
FREE
MetaTrader 마켓 - 거래자를 위한 로봇 및 기술 지표는 거래 터미널에서 바로 사용할 수 있습니다.
The MQL5.community 결제 시스템은 MQL5.com 사이트의 모든 등록된 사용자가 MetaTrader 서비스에서 트랜잭션을 수행할 수 있습니다. 여러분께서는 WebMoney, 페이팔, 또는 은행 카드를 통해 자금을 예치하거나 인출하실 수 있습니다.
트레이딩 기회를 놓치고 있어요:
- 무료 트레이딩 앱
- 복사용 8,000 이상의 시그널
- 금융 시장 개척을 위한 경제 뉴스
등록
로그인
계정이 없으시면, 가입하십시오
MQL5.com 웹사이트에 로그인을 하기 위해 쿠키를 허용하십시오.
브라우저에서 필요한 설정을 활성화하시지 않으면, 로그인할 수 없습니다.