Conheça o Mercado MQL5 no YouTube, assista aos vídeos tutoriais
Como comprar um robô de negociação ou indicador?
Execute seu EA na
hospedagem virtual
hospedagem virtual
Teste indicadores/robôs de negociação antes de comprá-los
Quer ganhar dinheiro no Mercado?
Como apresentar um produto para o consumidor final?
Indicadores Técnicos Grátis para MetaTrader 4 - 30

LyfUD指标专门 为黄金设计的趋势指标 ,也可以用于任何金融工具。用于及时反映多空力量,由U线和D线组成, 波动以0为中轴偏离运行, U线为快线D线为慢线。 LyfUD指标可以和 绝大多数策略结合使用 ,能够更加有效的把握风控。 U线和D线采用价格行为市场追踪算法,能及时反映市场方向, 可用在任意货币。 特性: 1. U线、D线在0轴上方,买入信号参考。 2. U线、D线 在0轴下方 ,卖出信号参考。 3. U线、D 线极限背离转向,行情可能出现反转。 4. 滞后性低,能及时反映趋势。 致力于结合其他指标,LyfUD和 均线、Pinbar 等搭配使用能迅速找到一些合理的关键位。 LyfUD只作为参考依据,其风险与作者无关。未经作者同意,禁止他售。
FREE

Pipsurfer Tide Meter is a Momentum Indicator that is designed to help trades know which way the "Tide" is turning. This indicator is a great supporting indicator to the pipsurfer main indicator that is listed in MQL5 under "Pipsurfer Indicator"
The Strategy Behind the Tide Meter is that youll see the blue bars and the red bars. Blue bars are for bullish momentum Red bars are for bearish momentum Use price action to find a trading zone then wait for the tide meter to change color then you ent
FREE

MP Price Change Indicator is a tool to calculate the price movement by percentage. The Value of this indicator can be adjusted to look back of the percent of price change within certain timeframes. This is a powerful tool when used by other indicators as well, such as ATR and ADR, for understanding price fluctuations and tolerance in different strategies. ___________________________________________________________________________________ Disclaimer:
Do NOT trade or invest based upon the analysi
FREE

Do you use dynamic ranges (like Bollinger Bands or Envelopes) in your trading? A fixed period is usually used for such calculations. But is such approach relevant to the very nature of the market? In fact, the price chart consists of a series of successive processes - trends and flats. In this case, we can talk about the internal development logic inside a single process only. Therefore, the nature of the market is better described by dynamic ranges designed for the processes occurring "here and
FREE

RaysFX Market Trend Histogram Il RaysFX Market Trend Histogram è un indicatore personalizzato per la piattaforma di trading MetaTrader 4. Utilizza il Commodity Channel Index (CCI) per identificare le tendenze del mercato e visualizza queste informazioni in un istogramma intuitivo. Caratteristiche principali: Identificazione delle tendenze: L’indicatore calcola il CCI per ogni periodo di tempo e lo utilizza per determinare se il mercato è in una tendenza al rialzo o al ribasso. Visualizzazione in
FREE

MA Digital Indicator Suitable for multi time frame
Buy Call: When the Red, Blue and Steel blue line crossed above the dark violet line. Sell Call: When the Red, Blue and Steel blue line crossed below the dark violet line.
Happy trade!!! this indicator is suitable for all time frame, but our recommended time frame to use 1hour and 4 hours, suitable for any chart.
FREE

The indicator searches for matches in history for a specified range of the latest known oscillated Moving Average data.
Found matches are indicated on the graph as colored fields. Analysis of historical data (the behavior of quotes in history) will help make decisions in trading.
The matches found are updated when a new bar is opened (i.e., the calculation is performed upon opening prices).
The value of the increase accuracy (Accuracy) must be changed with a decrease in the timeframe, and de
FREE

This is a trend following indicator that identifies optimal entry points in the direction of a trend with an objective stop loss to manage the trade. The indicator allows you to catch trend early and ride it. The Indicator draws resistance line as it detects an Uptrend and draws support line when it detects a Downtrend on the chart. When those levels are broken, that allows you to identify the Trend Direction and Momentum in the direction of prevailing trend which offers optimal entry points in
FREE

Indikator zur klaren Anzeige im Metatrader
Dieser Indikator wurde von mir Entwickelt damit die Anzeige der relevanten Parameter klar und deutlich im Chart auf einen Blick zu sehen ist. Er dient zur Information und ist ohne Gewähr. Folgende Parameter werden angezeigt:
- Der Aktuelle Kurs - Das Aktuelle Handelspaar - Die Restzeit zur nächsten Kerzenbildung / Zum Abschluss der Aktuellen Kerze - Die Kontonummer des Handelskontos - Die Frei Verfügbare Margin - Die Margin auf 1 Lot - Der Aktue
FREE
Simple dashboard to view ATR value across multiple time frame, no need to click at any timeframe, we can see the overview of ATR quicker. Support changing value of ATR period. Download free! We already tested via Strategy Tester, nothing wrong. If you found something wrong just drop the comment below or contact me at site: https://youtube.com/@itwetrade
Email: itwetrade@gmail.com
--------------------------- Support for development: https://www.buymeacoffee.com/itwetrade
FREE

This is a Bot which send notifications every hour at your MT4 platform. The notification consists of four part. <<Clock>> + Your Message + Symbols + profit + Total # of Orders + Total profit Here is an example : 21:00 Hodor: #US30 $+40.31 GOLD $-5.31 Total 5 Orders $+35.00 If there is no order : 21:00 Hodor: HODOR signals: https://www.mql5.com/en/signals/977796
There is a private message parameter where you can enter your own message also. Hodor_Comment_OnOff_Flag removes the "Hodor i
FREE

This is Demo Version of PipsFactoryMonthly This indicator depends on High and Low price of Currency in last Month and then i made some secret equations to draw 10 lines.
Features You will know what exactly price you should enter the market. You will know when to be out of market. You will know you what should you do in market: Buy Sell Take profit and there are 3 levels to take your profit Support Resistance Risk to buy Risk to Sell
Signal Types and Timeframe Used You can use this indicator ju
FREE

This is an original trend indicator. The indicator draws three lines in a separate window. Its values vary from -1 to +1. The closer the indicator is to +1, the stronger is the ascending trend. The closer it is to -1, the stronger is the descending trend. The indicator can be also used as an oscillator for determining the overbought/oversold state of the market. The indicator has one input parameter Period for specifying the number of bars to be used for calculations.
FREE

An indicator in the form of a panel for collecting statistics on spreads from a specified list of pairs. It is enough to open one chart and set an indicator to collect statistics for all specified pairs.
After completion of work, the panel writes values to a file, which allows not to interrupt statistics after completion of work.
Input parameters:
-Interval to update the spread for pairs (sec) Allows you to specify how often to collect statistics (allows you to reduce the load) -List of pair
FREE

***IMPORTANT: This free indicator works with the paid for Strong Weak Forex Expert Advisor. The EA also depends on the following custom indicators: Strong Weak Heiken Ashi Strong Weak Parabolic Strong Weak Values Strong Weak Indicator Download them for free in the Market. The EA will not work without it. These are all custom indicators which the Strong Weak Forex Expert Advisor relies on to generate trading signals. If you have any problems with installation send me a message.
FREE

The Stock Exchange One Sessions Hours version 2.00
This indicator facilitates observing the currency pair's quotations during subsequent parts of the stock exchange session live. Before the session starts, a rectangle is drawn on the chart but not filled in with color. It means the extent of the session duration. Before the first bar enters the rectangle of the session, a sound signal or pop-up window will notify us that the session will just start. When the price graph crosses the edge of the
FREE

1、能显示货币之间的强弱 0是最弱 7是最强 2、能显示28个货币以及黄金 原油的 涨跌幅度 3、能切换货币对 4、能显示持仓订单的货币对 1、能显示货币之间的强弱 0是最弱 7是最强 2、能显示28个货币以及黄金 原油的 涨跌幅度 3、能切换货币对 4、能显示持仓订单的货币对 5、能利用键盘的的上下键切换货币对,左右键切换周期 1、能显示货币之间的强弱 0是最弱 7是最强 2、能显示28个货币以及黄金 原油的 涨跌幅度 3、能切换货币对 4、能显示持仓订单的货币对 5、能利用键盘的的上下键切换货币对,左右键切换周期 5、能利用键盘的的上下键切换货币对,左右键切换周期 1、能显示货币之间的强弱 0是最弱 7是最强 2、能显示28个货币以及黄金 原油的 涨跌幅度 3、能切换货币对 4、能显示持仓订单的货币对 5、能利用键盘的的上下键切换货币对,左右键切换周期
FREE
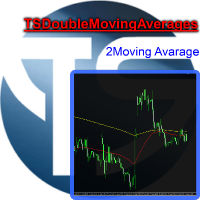
Useful indicator that incorporates two moving averages, for your favorite trading strategy. Moving averages are fully configurable, Period, Method, Color, Etc Just place it on your favorite timeframe.
The benefits you get : Never redesigns, does not retreat, never recalculates. Works on forex and CFD, timeframe from M1 to Monthly. Easy to use. Convenience for your trading.
FREE
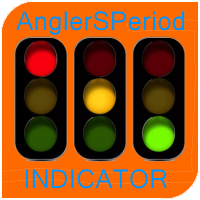
The oscillator indicator " AnglerSPeriod " is one of a series of three calculators of the angular deviation of the price chart of a trading instrument.
INPUT PARAMETER: DRAWs =128 - Number of bars to display the indicator in the chart history; PeriodIND =14 - calculation period of the indicator in the number of bars.
The values of the indicator indicators are degrees . The presence of a Strong price Movement begins with a value of +-45 degrees, and can not exceed +-90 degrees. A Good Trading
FREE

The indicator allows you to trade binary options. The recommended time frame is М1 and the expiration time is 1 minutes. The indicator suitable for auto and manual trading. A possible signal is specified as a arrows above/under a candle. You should wait until the candle closes! Arrows are not re-painted Trade sessions: London and New York section Currency pairs: EUR/GRB Working time frame: M1 Expiration time: 1 minute The indicator also shows good results when using the martingale strategy - "M
FREE

Индикатор отображает скользящие средние на заданном количестве баров ( Count bar for show MA ). Данный способ отображения упрощает анализ, так как график не загромождён лишними линиями. Так же имеется текстовая метка с отображением текущей цены скользящей средней и периода графика. Горячие клавиши служат для упрощения использования индикатора.
Настройки индикатора: Moving average #1 - скользящая средняя #1 Period - период усреднения Mode - метод сглаживания Price - используемая цена для расчё
FREE

Индикатор сглаженного DeMarker Oscillator (xDeM)
Входные параметры: Period - период усреднения Принцип работы
Индикатор перерассчитывает стандартный технический индикатор DeMarker Oscillato r (дважды усредняет получаемые значения). Период усреднения индикатора соответствует двойному периоду стандартного DeMarker Oscillato r . Например : xDeM с периодом усреднения 7 соответствует DeM c периодом 14. Индикаторный буфер не перерисовывается.
FREE

The Toronto Stock Exchange Session's Hours
This indicator facilitates observing the currency pair's quotations during subsequent parts of the stock exchange session live. Before the session starts, a rectangle is drawn on the chart but not filled in with color. It means the extent of the session duration. Before the first bar enters the rectangle of the session, a sound signal or pop-up window will notify us that the session will just start. When the price graph crosses the edge of the session
FREE

IMP
The Panel presents a number of indicators in abbreviated form: 2 oscillators, 2 trend and 1 volume indicator. Location - upper left corner.
Indicators values and colors can be customized by the user. Combined with other market analysis, can greatly improve trading results. This Indicator is a suitable tool for beginners and professional traders as one.
Metta Trader 4 Indicator Version _1.0
FREE

SkyNet EMA is an indicator will assist you by suggesting when to go long or short based on price action and the crossings of Exponential Moving Averages such as 14 period and 50 period. Just attach it to your chart and it will monitor the asset for potential sell opportunities and if found will paint a red arrow in your chart. Also will try to find buy opportunities and if found will paint a green arrow in your chart. It could be used with any currency but majors are recommended since they will
FREE
This indicator allows to hide RSI (on all MT4 timeframes) from a date define by the user with a vertical line (Alone) or a panel (with "Hidden Candles" utility). Indicator Inputs: Period Apply To Information on "Relative Strength Index" indicator is available here: https://www.metatrader4.com/en/trading-platform/help/analytics/tech_indicators/relative_strength_index ************************************************************* Hey traders!! Give me your feeds! We are a community here and we
FREE

This indicator shows the value of returns in the selected time frame .
They are calculated as logarithm of returns , rather than price or raw returns. For small returns, arithmetic and logarithmic returns will be similar. The benefit of using returns, versus prices, is normalization. It is possible measures all variables in a comparable metric despite originating from price series of unequal values.
Inputs You can display data both as a Histogram or a Line It's also possible to display th
FREE
An indicator for analyzing different currency pairs simultaneously Forex is a complex market that requires several currency pairs to be analyzed simultaneously Determine the number of currency pairs yourself Determine the currency pair you want to analyze to analyze 4 of the most important and similar currency pairs at the same time. For direct and simple analysis, some currency pairs have changed (EURUSD>>>USDEUR) Do not doubt that to succeed in this market, you must analyze several currency pa
FREE

FXDragunov.MyThemes. Forex Chart Color Themes.
Chart templates are responsible for chart layout and for contents of technical indicators applied to them.
Chart templates are used: When customizing an opened chart window. When customizing settings of a new chart window. When customizing a chart opened via the “New chart” window.
Original code by FXDragunov Indonesia
FREE

Tool converted from tradingview. A simple indicator that plots difference between 2 moving averages and depicts convergance/divergance in color coded format.
Anything <= 0 is red and shows a bearish trend whereas > 0 is green and shows bullish trend.
Adjust the input parameters as following for your preferred time frame :
4-Hr: Exponential, 15, 30
Daily: Exponential, 10, 20
Weekly: Exponential, 5, 10
FREE
Standard deviation with levels is a modification of the Standard deviation indicator, supplemented by the levels of expected Highs and Lows. The levels are plotted using the Support and resistance bands indicator, which determines the High and Low levels nearest to the current indicator value based on the historical values of the extremes.
Parameters standard deviation period - period of the standard deviation indicator. extremum detector period - period of extremum detection. This parameter
FREE

Este indicador foi inspirado no "average true range (ATR)" criado por John Welles Wilder , mas com alguma informação extra. Semelhantemente, calcula a média móvel exponencial do intervalo real, mas usando o peso alfa padrão em vez do de Wilder . Também calcula o desvio médio da média do intervalo e o exibe como um deslocamento. Isto ajuda não só a identificar uma mudança mais rapidamente, mas também o seu impacto.
FREE

This Indicator works based on several well-known Technical Indicators in different time frame Works. These Technical Indicators include: · Moving Averages(MA) · Average Directional Index (ADX) · Parabolic Stop and Reverse (SAR) · Moving Average Convergence Divergence (MACD) · Commodity Channel Index (CCI) · Oscillator of a Moving Average (OsMA) · Momentum(MOM) · Relative Strength Index (RSI) · Williams' Percent Rang
FREE
The RSI S-RoC indicator differs from the standard RSI in that it takes into account the price rate of change when calculating values. When the price moves in a trend, the indicator produces good entry signals oncethe price touches its levels. The level values can be configured in the indicator settings. They can also be modified and adjusted directly in the indicator window. You can also set on a chart signal lines. Once they are crossed, the indicator will produce a sound alert or play a user
FREE
Uma pequena decoração para MT4.
A inscrição no fundo.
Mostra o par de moedas e intervalo de tempo.
Pode uma série de ajustes por alteração de cor, tamanho, lugar de posição, a indicação de um intervalo de tempo.
Configurações Promark: TURN_OFF - ligar/desligar a decoração;
Show Period - ligar/desligar o intervalo de tempo;
MyChartX - localização do eixo X;
MyChartY - localização do eixo Y;
My Corner - localização cantos gráfico;
My Font Size - tamanho da decoração;
Agradável
FREE
Your attention is invited to the indicator Price Action Indicators. It doesn't need settings. And also it is not tied to more than one indicator, which makes it not vulnerable to different accounts or brokers.
Add one setting PERIOD
Regards, Mikhail
Вашему вниманию предлагается индикатор Price Action Indicators. Ему не нужны настройки. А также он не привязан не к одному индикатору, что делает его не уязвимым перед разными счетами или брокерами.
С Уважением Михаил
FREE
Version History Date Version Changes 07/09/2022 1.10 Initial released Description The RedeeCash RSI is your typical RSI indicator with the three latest RSI calculations exposed as global variables for easier integration with scripts and expert advisors. Code Sample To invoke this indicator from an EA or script, call the iCustom metatrader function, iCustom ( Symbol (), PERIOD_CURRENT , "Market/RedeeCash RSI" , 14 , 1 , 0 ); string RSIVarName = StringConcatenate ( Symbol (), "_rsi" ); string RSIP
FREE

The indicator allows you to trade binary options. The recommended time frame is М1 and the expiration time is 1 minutes. The indicator suitable for auto and manual trading. A possible signal is specified as a arrows above/under a candle. You should wait until the candle closes! Arrows are not re-painted Trade sessions: London and New York section Currency pairs: AUD/CAD Working time frame: M1 Expiration time: 1 minute The indicator also shows good results when using the martingale strategy - "Ma
FREE

Session Average Date Range: Analyze and average the low - high of specific trading sessions within custom date ranges, offering insights into price movements and market behavior over selected periods. The "Session Average Date Range" tool is an advanced analytical utility designed to empower traders and analysts by allowing them to dissect and evaluate the high and low range of specific trading sessions within a user-defined date range. This tool provides a flexible and precise approach to analy
FREE

The indicator shows the current situation on 16 indicators and 10 strategies.
Its values are formed based on the evaluation of the specified criteria for each strategy separately.
As a result, we can observe on the chart the strength of all the indicators included in it, as well as additional logic. Advantages: Signals do not redraw their values. The arrow is drawn after confirmation. All types of alerts. Shows weak zones based on the evaluation results. The passing value of the score is dete
FREE

Belogex - Мы делаем трейдинг простым и удобным! BX Indicator позволяет трейдеру объединять стандартные индикаторы с разных таймфреймов в один уникальный сигнал на графике, настраивать поиск любых свечных моделей и комбинировать их с сигналами от абсолютно любых индикаторов, даже с закрытым исходным кодом, а также получать уведомления о их работе в реальном времени. Это демо версия программы! В демо версии встроены готовые шаблоны торговых систем. Менять параметры индикаторов, добавлять свечны
FREE

O indicador de "Elvis A" destina-se muito da definição estrita de reversão. Com o autor configurações definido no cronograma D1. Ele vai transmitir uma grande quantidade de sinais e escolher apenas os mais confiáveis. Então, o melhor é instalá-lo em vários pares de moedas.
Na imagem a seguir mostra um exemplo de funcionamento deste indicador em forma de conselheiro no par de moedas com um spread.
FREE

Non-proprietary study of Joe Dinapoli used for overbought/oversold evaluation. Uses of Detrended Oscillator indicator Profit taking. Filter for market entry technics. Stop placement. Part of volatility breakout pattern. Determining major trend changes. Part of Dinapoli Stretch pattern. Inputs lnpPeriod: Perid of moving average Method: Calculation method ********************************************************************************* If you want to know market Overb
FREE

Current Pips and Money Profit This indicator displays the results of the currently open position on the graph. Result in pips and in the invoice currency. Thanks to this, you can enlarge the chart to the entire screen and have control over the result of trading without opening a terminal window which takes a space of a screen. The display positions of this data can be adjusted at the user's discretion and colors also.
FREE

Adaptive MA is a simple modification of the moving averages (MAs) that allows displaying an average value line based on multiple MAs on the chart. The parameters allow you to set any number of MA periods. The number of parameters is equal to the number of moving averages applied in calculation.
At first, it may seem that nothing new has been invented and there is no sense in this approach. However, this impression is deceptive. As we know, the trends have different duration. Have you ever tried
FREE

Comb O indicador exibe uma grade em forma de favo de mel ou um hexágono regular. Alternativa à grade de terminal de negociação padrão. Descrição das configurações do indicador: color_comb - cor da grade largura - largura, exemplo: 22 para uma tela com resolução de 1920 * 1080, 15 para uma tela com resolução de 1366 * 768 etc. altura - altura, por exemplo: 6 para uma tela com resolução de 1920 * 1080, 4 para uma tela com resolução de 1366 * 768 etc.
FREE

Not everyone can write an indicator. But anyone can have an idea. The indicator Universal Separate Window Free , which takes as an input parameter the formula by which the indicator line will be drawn, will help to implement it. This indicator is intended for use in the separate chart window.
All indicators of the series Universal :
Main window Separate window Free MT4 Universal Main Window Free MT5 Universal Main Window Free MT5 MT4 Universal Separate Window Free MT5 Universal Separate Window
FREE
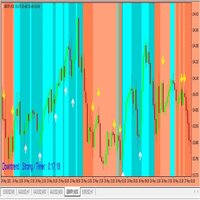
You have to wait the background colors, if the background's RED, you have to wait the yellow arrows to take selling orders. If the background's BLUE, you have to wait the white arrows to take buying orders. When the arrows show out, please wait for the close candles, otherwise it repaints. Please you watch the background colors, if the background's Lighter Red, that means big downtrend signals, if it's Darker Red, you have to be carefull. Because the downtrend can change to uptrend suddenly. if
FREE
Parabolic Sar easy mode, remake the original p.sar indicator making it more easy to read for novicians traders and experimented traders looking to reduce the time analizing the charts, you can make your own strategy modificating the periods and fusioning it with others indicators like RSI ,stochastic or what you want,its one indicator runs better on high time charts like H4 or D1.
FREE

Long term stats is a trend indicator. As the name suggests, it computes long term running average, standard deviation and min/max values Average and standard deviation are plotted on the graph and deviation value is taken as input parameter (similarly to bollinger bands). Historical minimum and maximum are plotted on the graph and updated for each bar, considering historical time series slope. (this is to somehow account for inflation/deflation) Can be used as filter for signals, as trigger to
FREE

Introducing Momentum Jurik—an innovative indicator designed to optimize your forex trading strategy by incorporating custom moving averages based on the Momentum indicator with the MetaTrader 4 indicator, Momentum.
Jurik moving averages are renowned for their precision and reliability in analyzing price movements in the forex market. They provide traders with smoother representations of price action, reducing noise and offering clearer signals for identifying trends and potential reversals.
T
FREE

The ' Average OHLC ZigZag ' indicator was designed for entry confirmations as well as scalping with a larger trend. A custom formula to average the last two bars to generate arrows following market trends with bar 1 confirmation.
Key Features An extreme scalper calculating the averages between the last two market periods to generate a buy or sell arrow. No settings are available due to it's simplicity of custom price action pattern and using repainting four OHLC prices.
Input Parameters ZigZa
FREE

Not everyone can write an indicator. But anyone can have an idea. The indicator Universal Main Window Free , which takes as an input parameter the formula by which the indicator line will be drawn, will help to implement it. This indicator is intended for use in the main chart window.
All indicators of the series Universal :
Main window Separate window Free MT4 Universal Main Window Free MT5 Universal Main Window Free MT5 MT4 Universal Separate Window Free MT5 Universal Separate Window Free MT
FREE

This indicator helps you determine the evolution of the price depending on how these fly objects are shown in the chart. When the gliders opens their wings considerably warns us of a possible change in trend. On the contrary, when seems to get speed (looks thin because lines of wings are grouped) demonstrates safety and continuity in trend. Each wing of a glider is a directrix between the closing price and the high/low prices of the previous bar. The color (green/red) of each glider foresees bet
FREE
This indicator collects and organizes spread data. It is an organic add-on to my news robot, ExpertNews , which can be downloaded here .
You can also watch a video about news trading using the ExpertNews robot. It is available on youtube .
Unfortunately, it is not possible to place the robot in the mql5.com store, because the automatic validation of ExpertNews by the mql5 service ends in failure. In reality, there are no errors in the robot.
Testing fails due to the fact that the advisor is
FREE

Ever wondered what is XAU/XAG rate or how Chinese Yuan is traded against Russian Ruble? This indicator gives the answers. It shows a cross rate between current chart symbol and other symbol specified in parameters. Both symbols must have a common currency. For example, in cases of XAUUSD and XAGUSD, or USDRUB and USDCHN, USD is the common currency. The indicator tries to determine the common part from symbols automatically. If it fails, the DefaultBase parameter is used. It is required for non-F
FREE
NearONE displays the average value of the price deviation in points for a specified period in a subwindow of a selected trading instrument.
Inputs : DRAWs - number of bars to display the indicator; NearPeriod - indicator period.
If NearPeriod is 0 , recommended periods are used for each chart timeframe.
If NearPeriod = 0: M1 timeframe - period = 60 ; M5 timeframe - period = 48 ; M15 timeframe - period = 96 ; M30 timeframe - period = 192 ; H1 timeframe - period = 96 ; H4 timeframe - period = 3
FREE
Price Alert Indicator FREE
Description:
Configurable price alert indicator for when the price crosses upwards or downwards.
Characteristics:
It can be configured one-way, or both ways.
Horizontal lines are used to indicate the level to which you want to be alerted.
On-screen buttons to hide or show the lines.
Alerts:
MT4 alert.
Push alert to mobile phone.
FREE VERSION ONLY WORKS ON AUDUSD PRO VERSION: https://www.mql5.com/es/market/product/53040
FREE
TradingDesk Demo – Performance Analyse MT4 This is a Demo version of TradingDesk indicator which is limited to show only EURUSD. Full version can be found here: https://www.mql5.com/en/market/product/40189
TradingDesk analysed MetaTrader 4 historical data by Symbol, Magic Number, Trade or Comment. All these evaluations will be displayed in real time on your MetaTrader 4 chart window.
All this information will be displayed in the following dashboards: account info General information about the
FREE

The indicator builds alternative quotes based on the average price of a bar and shadows for a specified period of time or according to a fixed body size.
Options:
StartDrawing - the date from which the indicator will build quotes;
PerCounting - period for calculating the average body size and shadows. If AverageBody = 0, then it builds at an average price;
AverageBody - fixed candlestick body size. If greater than zero, builds on this parameter.
FREE
This indicator allows to hide CCI oscillator (on all MT4 timeframes) from a date define by the user, with a vertical line (Alone) or a panel (with "Hidden Candles"). Indicator Inputs: Period Apply To Information on "Commodity Channel Index" indicator is available here: https://www.metatrader4.com/en/trading-platform/help/analytics/tech_indicators/commodity_channel_index ************************************************************* Hey traders!! Give me your feeds! We are a community here and
FREE

The Shanghai Stock Exchange Session's Hours
This indicator facilitates observing the currency pair's quotations during subsequent parts of the stock exchange session live. Before the session starts, a rectangle is drawn on the chart but not filled in with color. It means the extent of the session duration. Before the first bar enters the rectangle of the session, a sound signal or pop-up window will notify us that the session will just start. When the price graph crosses the edge of the sessio
FREE

The Tokyo Stock Exchange Session's Hours
This indicator facilitates observing the currency pair's quotations during subsequent parts of the stock exchange session live. Before the session starts, a rectangle is drawn on the chart but not filled in with color. It means the extent of the session duration. Before the first bar enters the rectangle of the session, a sound signal or pop-up window will notify us that the session will just start. When the price graph crosses the edge of the session r
FREE

Основное удобство донного индикатора в том, что он не назойлив как большинство, он хорошо показывает среднюю цену на текущем графике. индикатор информирует о количестве открытых позиций по текущему инструменту, а так же по всем открытым инструментам в том числе. при расчете средней цены учитывает комиссию и свопы, показывает чистую цену. Отображается на графике внизу экрана, есть возможность менять цвет и размер шрифта.
FREE

Infometer индикатор для вывода информации в одном из углов - сколько пунктов (пипсов) или в валюте депозита профита во всех отрытых ордеров данного торгового инструмента. В меню индикатора внесены такие данные 1. Угол вывода информации. 2. Цвет вывода информации. 3. вывод валюты депозита и пипсов. 4. Выбор вывода информации - профит и пункты - профит -пункты. На белом фоне автоматически информация выводится черным цветом на других фонах цвет вывода информации определяется в меню.
FREE

The Shenzhen Stock Exchange Session's Hours
This indicator facilitates observing the currency pair's quotations during subsequent parts of the stock exchange session live. Before the session starts, a rectangle is drawn on the chart but not filled in with color. It means the extent of the session duration. Before the first bar enters the rectangle of the session, a sound signal or pop-up window will notify us that the session will just start. When the price graph crosses the edge of the sessio
FREE

This indicator calculate the minimum,maximum,average and relative (to points of the bar) spread in the chart applied period. The indicator must be applied to one or more different period on a Pair and analyze the spread for all the Pairs available by the Broker. The csv output for one minute chart is something like this https://gofile.io/?c=K5JtN9 This video will show how to apply the indicator https://youtu.be/2cOE-pFrud8 Free version works only for GBPNZD
FREE

This version of the indicator Floating Nest works only in the tester, on demo accounts and on real accounts on the USDCHF pair.
1. What is Floating Nest?
This indicator is designed to automate the construction of decision zones (can act as support-resistance levels) according to the Floating Socket strategy.
The same indicator allows you to significantly reduce the time when analyzing the behavior of prices in decision areas on historical data.
It works on any currency pairs. Time frame: M1-H
FREE
O Mercado MetaTrader é a única loja onde você pode baixar um robô demonstração de negociação gratuitamente para testes e otimização usando dados históricos.
Leia a visão geral e opiniões de outros clientes sobre os aplicativos, faça o download para o seu terminal e teste um robô de negociação antes de comprá-lo. Apenas no Mercado MetaTrader você pode testar um aplicativo de forma absolutamente gratuita.
Você está perdendo oportunidades de negociação:
- Aplicativos de negociação gratuitos
- 8 000+ sinais para cópia
- Notícias econômicas para análise dos mercados financeiros
Registro
Login
Se você não tem uma conta, por favor registre-se
Para login e uso do site MQL5.com, você deve ativar o uso de cookies.
Ative esta opção no seu navegador, caso contrário você não poderá fazer login.