MetaTrader 4용 무료 Expert Advisor 및 지표 - 41

Key Level Key Level is a MetaTrader 4 Indicator that uses a proprietary algorithm based on Price Retracement/Breakout Method to show the Entry-Line on your trading.
Instead, it analyzes data of market and identify entry points and opportunities. (Price Retracement / Price Breakout)
It's also a trading tool that be used to practice and enhance your manual trading skills.
Key Level is an amazing tool for Scalping Trader. It also a trading tool that be used to practice and enhance your manual trad
FREE

The indicator calculates the angle between the Highs, Lows and Closes of neighboring bars. The angle can be measured in degrees or radians. A linear chart or a histogram is drawn in a subwindow. You can set the scale for the calculation — floating or fixed. For use in the EA, you need to specify a fixed scale.
Parameters Angular measure — degrees or radians. Scale mode for calculation — scaling mode. Free scale — free transformation, the indicator will calculate values each time the chart scale
FREE

This indicator is a perfect tool able to compare which brokers have the lower latency. It shows us immediately which brokers are slower or faster. When you see the dot icon on the line, it means this broker is the faster one and the red line (Broker_A) is the slower one. See the example on the screenshot.
How It Works? This indicator shares the prices information to and from the "shared" common data folder. It compares all the prices. The price is based on average by (Ask + Bid) / 2. There are
FREE

This indicator maps price crossover with Simple Moving Average (SMA) for each candle. Works like a SMA but has non-repaint characteristic. How to Use: As stated before, this indicator works like a SMA. Use this to determine trend. When price is above this line then the uptrend is expected (downtrend if price below the line). 2 of these indicator (with different periods) can also generate buy/sell signal like 2 SMAs. When the lower period SMA crosses higher period SMA from below, then buy signal
FREE
The trade of this EA is based on Trend Following Strategy which doesn't wanna get a high price. This Ea helps us to get a lower price. Increase the opportunity of a Winning chance. EA with customizable lot size (use martingale or not), stop-loss, and take-profit levels. Easy to use and Simple Recommended Timeframe M30,H1 others timeframes with the appropriate settings. Works for ECN/Non-ECN brokers and 2-3-4-5 digit symbols A low latency vps is always recommended and An low spread broker
FREE
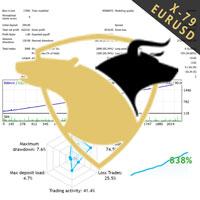
TraderX-79 uses non repainting home made indicatiors to predict the direction of the market. It has been trained over the years with Ai to efficiently predict market movement. Nothing is certain in life so does forex trading, However traderX-79 has managed to be right 70% of the time, And in the 30% of cases when it is wrong, we added a great reverse strategy inside which instantly activates to enable breakeven and not take any loses. This simple trick makes the robot really undefeatable on bot
FREE

Buy a Coffee for Yuniesky Carralero Cuellar
This indicator draws the RED - GREEN and GREEN - RED candlestick pattern, the green candles that close above their previous red candle, and the red candles closing below your previous green candle. https://www.youtube.com/shorts/MdJvatl_mng Input Parameters 1. RED - GREEN: Draw the green candles that close above their previous red candle. 2. GREEN - RED: Draw the red candles that close below their previous green candle. 3. PREV CANDLE: Draw previous
FREE

This Expert Advisor captures and sends information about all open positions to a REST API server in real-time using HTTP POST requests. It is ideal for building synchronization tools, external monitoring systems, or custom trade copier solutions. What does this EA do? Iterates through all active orders in the account. Compares current positions with the previously sent ones. If any change is detected (SL, TP, price, symbol, volume, type, etc.), it sends updated information to the defined endpoi
FREE

This forex robot is a unique, authoring development! WHEN TESTING IN THE TESTER, TRANSACTIONS ARE FORCED CLOSED AT THE END OF THE REPORTING PERIOD - EXACTLY DUE TO THIS DAMAGE. REALLY DAMAGES ARE NOT AND CAN'T BE! IN THIS ADVISOR DEFAULT SETTINGS FOR COUPLE ONLY - AUD U SD All bugs fixed and profitability improved. Added default settings for a couple of euro usd
- TIME FRAME ONLY H1 For each currency pair needs its own setting. Each currency pair to be optimized separately. no one setting f
FREE
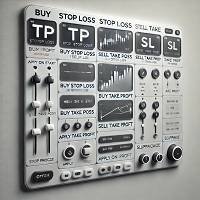
User Guide Overview This tool is designed to help traders efficiently manage their trading orders. It enables you to set unified Take Profit (TP) and Stop Loss (SL) levels for buy orders, sell orders, and pending orders through a single interface, significantly improving order management efficiency and eliminating the hassle of manual adjustments. Use Cases Quick Risk Management : Adjust stop-loss levels for all orders in volatile markets to control potential losses. Unified Profit Targets : Set
FREE

Signals and Alerts for Accelerator/Decelerator indicator based on these MQL5 posts: Accelerator Oscillator and Signals of the Indicator Accelerator Oscillator . Note : this tool is based on the code of Accelerator indicator developed by MetaQuotes Software Corp.
Features The signals are triggered at closing of last bar/opening of a new bar; Any kind of alerts can be enabled: Dialog Box, Email message, SMS notifications for smartphones and tablets, and Sound alerts; Customizable arrows. By d
FREE

Choosing the levels of StopLoss and TakeProfit can have a very strong impact on the overall performance of trading. In addition to the obvious parameters of a trade transaction - the size of a possible win or probable loss - the levels of StopLoss and TakeProfit also affect the expected duration of the transaction, and the profitability of trading in general. If you have already determined the optimal transaction duration using the “ AIS-ODT ” script, then you can begin to determine the paramete
FREE

This indicator alerts you when indicator-created lines are "touched" by price, You can change the interval between alerts. You can change colors and styles of lines as you want. However, lines must be named "Upper" and "Lower.
There is a more powerful PRO version .
Input Parameters WaitTime: Interval between alarm.
How To Use Place lines wherever you want to add alarms.
FREE

스프레드 경보 는 스프레드를 모니터링하고 스프레드 가 정상보다 높으면 경고하거나 설정한 임계값을 초과하면 경고합니다 . 특징:
스프레드가 정상 인지, 정상 보다 높 거나, 경고를 유발 했는지에 따라 3가지 색상을 선택 합니다.
사용자 지정 사운드 를 설정할 수 있는 선택적 사운드 경고 (.wav 파일이어야 함)
레이블 위로 마우스를 가져가면 가장 낮게 기록된 스프레드 , 스프레드 경고 , 경고 핍 및 스프레드 상태 를 도구 설명에 표시합니다.
매개변수:
이름
설명
소리 경고 경고 임계값이 충족되면 사운드 파일을 재생합니다. 경고음 파일(.wav 파일이어야 함) 경고가 꺼지면 재생될 wav 파일
경고음 끄기 시작(브로커 시간) 소리 알람이 음소거되는 시작 시간
경고음 끄기 종료(브로커 시간) 소리 알람이 음소거 해제되는 종료 시간
경고 핍 가격이 충족하거나 초과해야 하는 임계값(핍)
경고 핍 표시 현재 스프레드 옆에 설정한 임계값을 표시합니다.
경고 레이블: 확대 활성화된 경우 경고
FREE

Martingala Assistance, as its name says ... It is an assistant, an expert advisor that monitors all the orders for the asset in which it has been placed, no matter if that order was by some other expert advisor or by the trader placed on the Manually, he will start his work after each order that is negative.
See more products on: https://www.mql5.com/en/users/joaquinmetayer/seller .
FREE

The Cossover MA Histogram indicator is a simple tool showing the trend based on crossover of moving averages. Simply specify two mobving averages and addicional parameters like MA method and Applied price. When fast MA is above slow MA the histogram is green, indicating an uptrend. When MA fast is below MA slow the histogram is red, indicating an downtrend.
FREE

MT4/5通用交易库( 一份代码通用4和5 ) #import "K Trade Lib.ex4" //简单开单 long OrderOpen( int type, double volume, int magic, string symbol= "" , string comment= "" , double opprice= 0 , double sl= 0 , double tp= 0 , int expiration= 0 , bool slsetmode= false , bool tpsetmode= false ); //复杂开单 void SetMagic( int magic, int magic_plus= 0 ); void SetLotsAddMode(int mode=0,double lotsadd=0); long OrderOpenAdvance( int mode, int type, double volume, int step, int magic, string symbol= "" , string comme
FREE

Indicator overview Trend indicator usage Moving averages. Highest quality alerts that need no introduction. It is completely loyal to the original algorithm and uses other useful features.
Easy to trade Carry out all kinds of notifications It's not a new paint and it's not a back paint. Setting Indicator WMA50 in Time frame H1 for any pair currency and Gold Spot. EMA200 in Time frame H1 for any pair currency and more than EMA250 for Gold spot. Using it for maximum benefit Set up notification
FREE
Version History : Date Version Changes 6/20/2022 1.00 Initial release 6/21/2022 1.10 Add global variables for Minimum (SYMBOL_volume_min) and Maximum (SYMBOL_volume_max) History Volumes Description : RedeeCash Volumes Indicator is the Volumes indicator that you have come to trust for market entry and exit with the added benefit of exposing key metrics as global variables. Including global variables in an indicator permits easier interaction with expert advisors (EA) and scripts. When attaching
FREE

Key Features: Trade Copy MT4 to MT4 . #forex #sharemarket #trading Disclaimer :- My videos, presentations, and writings are strictly for educational purposes and should not be considered investment advice. I cannot guarantee the accuracy of any information provided. It is essential to conduct your own research and consult a qualified financial advisor before making any investment decisions. I bear no responsibility for any financial losses or negative outcomes resulting from the use of my con
FREE
The AllClosedMT4 utility in the form of an expert. The utility is designed for closing all open positions simultaneously based on the total profit (in the deposit currency) of all open positions. The utility can be attached to any chart with any trading instrument.
Parameters Profit - the total positive profit in the deposit currency, at which all open positions are closed (profit). Stop - the total negative profit in the deposit currency, at which all open positions are closed (loss). The valu
FREE
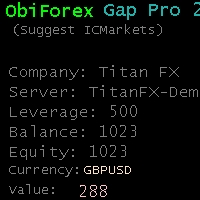
Obiforex Gap Pro Functions: Assists in identifying potential trading opportunities associated with weekend market gaps. Facilitates risk management and order adjustments based on your configured settings. Trades exclusively on the first market opening day (Monday) and only with the specified currency pairs. Please note: Trading involves risks. The Obiforex Gap Pro expert advisor provides tools for analysis; however, results may vary. Use at your own discretion.
FREE

The indicator allows you to trade binary options. The recommended time frame is М1 and the expiration time is 1 minute. The indicator suitable for auto and manual trading. A possible signal is specified as a arrows above/under a candle. You should wait until the candle closes! Arrows are not re-painted Trade sessions: TOKYO section (Half end) and LONDON section (First half) Currency pairs: EUR/USD Working time frame: M1 Expiration time: 1 minute. The indicator also shows good results when using
FREE

Full Automated Trading panel . it works on any trading instruments: Forex, Stocks, Futures, Indices, CFD, Bonds, Cryptocurrencies; interface minimization function; flexibility of use;
Join my channel and check video of it ===> https://t.me/Ash_TheTrader/4986
Features :
Auto SL and TP Auto Close partial Auto Trailing Session Time Alert Time of trading Alert Profit and Percentage and etc.
FREE

Active Price Lines
Indicator gives you full custom control over the Bid and Ask price lines, both color and style. Color control is also customizable based on increased or decreased price by the tick.
Options include: Show both the Bid line and the Ask line Set unique color for each Set unique line style for each Set unique color for increased price (by the tick) Show only Bid line Show only Ask line
Rider Capital Group
FREE
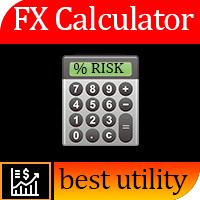
Forex Calculator is a must-have program for every trader. This script allows you to calculate the percentage% risk of a deposit depending on the set Stop Loss in pips. The advantages of the script: You always know exactly what you are risking in every trade The calculator takes into account the contract specification Only 2 columns for data entry risk and Stop Loss size in pips Recommended Robot Scalper - https://www.mql5.com/en/market/product/77108
Options Risk_in_% – the percentage of
FREE

Action Scanner is a market scanner. It’s yet another product in my "Can’t trade with out it" series. Do you want to know what is moving right now? Action Scanner scans your watchlist and opens the 10 currently most moving charts. You can chose between, most moving in points, most moving in your account currency(if you were to trade it with a standard lot size 1.00) and most moving in percentage. The standard version is a complete tool with no limitations. However the pro version has additiona
FREE
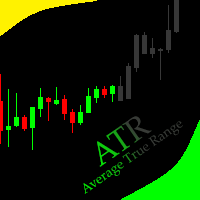
This indicator allows to hide ATR oscillator (on all MT4 timeframes) from a date define by the user, with a vertical line (Alone) or a panel (with "Hidden Candles"). Indicator Inputs: Period Information on "Average True Range" indicator is available here: https://www.metatrader4.com/en/trading-platform/help/analytics/tech_indicators/average_true_range ************************************************************* Hey traders!! Give me your feeds! We are a community here and we have the same
FREE
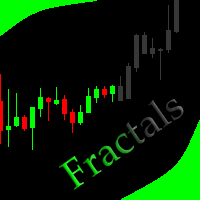
This indicator allows to hide Bill Williams Fractals (on all MT4 timeframes) from a date define by the user with a vertical line (Alone) or a panel (with "Hidden Candles"). Indicator Inputs: Indicator Color Indicator Width Information on "Fractals" indicator is available here: https://www.metatrader4.com/en/trading-platform/help/analytics/tech_indicators/fractals ************************************************************* Hey traders!! Give me your feeds! We are a community here and we hav
FREE

Indicator for fast navigation through financial instruments. When you click on the button, you go to the chart of the financial instrument, the name of which was written on the button. In other words, the indicator opens or unfolds an existing chart window. For each chart, you can customize the name of the financial instrument, text color and background color; in total, you can customize symbols buttons that you trade often. The indicator can be installed on any charts for which you need to swit
FREE
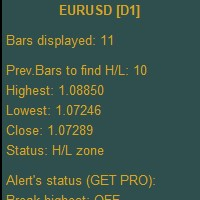
Higher Timeframe Chart Overlay will display higher timeframe candles, including the number of candles high/low you specify.
You no longer need to switch timeframes to check the candles. Everything can be shown in one chart. Get Full Version - https://www.mql5.com/en/market/product/115680 Please feel free Contact me if you have any questions regarding this tool.
FREE
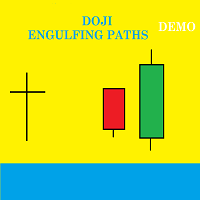
Presentation Doji Engulfing Paths enables to get signals and data about the doji and the engulfing patterns on charts. It makes it possible to get opportunities from trends, and to follow the directional moves to get some profits on the forex and stocks markets. It is a good advantage to take all the appearing opportunities with reversal signals and direct signals in order to obtain some profits on the forex market. With the demo version, only the signals starting with the 20th candle or bar are
FREE

Close Positions on Candle Close This tool allows you to automatically close positions based on the last candle's closing price, helping confirm trade exits and avoiding unpredictable price movements. How It Works: The EA waits for a candle to close above or below the Stop Loss level before executing a position close. It eliminates the need to manually monitor trades and helps automate exit strategies. Settings: Order_Type: Select the types of orders or positions to be managed. CandleTimeFrame:
FREE

The relative strength index ( RSI ) is a technical indicator used in the analysis of financial markets . It is intended to chart the current and historical strength or weakness of a stock or market based on the closing prices of a recent trading period. The indicator should not be confused with relative strength . The RSI is classified as a momentum oscillator , measuring the velocity and magnitude of price movements. Momentum is the rate of the rise or fall in price. The RSI c
FREE

This EA helps traders in the following benefits : - show the entry point for sell or buy orders that you makes. -show the TP & SL levels on chart - control the lot size - control the TP & SL level in points - works on all chart period - rising algo trading rank in your signal - closing all deals in one click - closing only profitable deals - closing only losable traders enjoy
FREE

A simple tick indicator of Bid and Ask prices. The period separator (1 minute) is displayed as a histogram. Parameters Price_levels_count - number of price levels to be displayed. Bar_under_calculation - number of bars of the indicator to be displayed on the chart.
FREE

This is an extension of the previous published DollarIndex with the addition of the function for calculating EURO Index under ICE Formula. Note that the broker should provide the following data:
For Dollar Index formula, EURUSD, USDJPY, GBPUSD, USDCAD, USDSEK and USDCHF are needed. For Euro Index formula, EURUSD, EURGBP, EURSEK and EURCHF are needed. Now in this version if the SEK (the most uncommon) is not provided, the formula still works, since it adds 0.0001 to its value, but the index will
FREE

This is a very simple indicator that mixes the Sunday session with the Monday one. This is useful because the Sunday session is a partial session mostly with only Australian and Asian sessions included, so the analysis of the Monday's daily session if mixed with Sunday tends to be more comprehensive. This indicator plots a candle with the following values: Open - the Friday's Close or Sunday's Open (depending on your choice). High - the highest High of Sunday and Monday. Low - the lowest Low of
FREE

Trailing Even is a free complement for the Control adora Expert Adviser. It adds a trailing stop function and changes the exit level that works as stop loss if some price is reached, let's review how to make it work: First of all make sure you have the same language selected both in the Control adora Expert and in this indicator. Change of the exit level that works as stop loss with "BES" and "BEO": This function needs 2 arrows to work: 1 named BES (stands for Break Even Start) place it at the
FREE
DMI Symbol Switcher: Dynamic Symbol Switching on the Chart 100% free, functional, and without limitations! The DMI Symbol Switcher is an indicator designed to enhance trading efficiency by allowing dynamic symbol switching on the chart through navigation buttons and keyboard shortcuts. It simplifies the management of symbols on your trading platform, making the process of switching between different symbols much smoother. Main Parameters: Symbol List: List of symbols that you can easily navigate
FREE
Our EA is designed to monitor the user's account and provide useful information about the balance, net balance, and current drawdown for the day and month. Additionally, it provides detailed information about daily, previous day, weekly, monthly, and yearly performance, which helps the user evaluate the effectiveness of their trading strategy. One of the unique features of our EA is that it draws the profit at the end of each operation on the chart, allowing the user to easily visualize the prof
FREE

This free tool is more reliable and user friendly to use Please give five star if you feel the tool is helpful Lot size positioning is the important risk management rule The larger the lot, the more risk you're exposed to. Smaller lot sizes are often favored by traders who want to manage risk more conservatively.
A general rule of thumb is to risk no more than 1-2% of their account on each trade. Traders need to determine their risk tolerance for each trade. This will help them decide how muc
FREE

전략 테스터에서 잘 작동합니다. 무료 데모로 사용해 보세요.(빌드 1353)
How to run the FREE DEMO => https://www.mql5.com/en/blogs/post/749299
Msg2Discord는 무료 텍스트를 게시하고 텍스트 상자에서 Discord로 캡처합니다.
그래프에 선, 마크, 코멘트를 작성하면 이미지가 전송됩니다.
매우 유용하고 간단한 도구입니다.
- 무료 메시지 보내기
1. 편집 상자에 자유 텍스트를 입력합니다.
2. 보내기 버튼을 누릅니다.
- 무료 메시지 보내기 + 이미지 캡처
1. 편집 상자에 텍스트를 입력합니다. 2.
2. w/img 버튼을 누릅니다.
- 캡처한 이미지 보내기
1. w/IMG 버튼을 누르기만 하면 됩니다.
* 매개변수로 Discord WEBHOOK이 필요합니다.
*이 도구는 "WebRequest"를
이것은 간단한 기능이지만 Discord 사용자에게 유용한 도구가 될 것입니다.
전략 테스터에서
FREE

Useful indicator that incorporates three moving averages, for your favorite trading strategy. Moving averages are fully configurable, Period, Method, Color, Etc Just place it on your favorite timeframe.
The benefits you get : Never redesigns, does not retreat, never recalculates. Works on forex and CFD, timeframe from M1 to Monthly. Easy to use. Convenience for your trading.
FREE
블라인드 브로커 시스템 의 유일한 목적은 거래 계획을 숨기고 브로커에게 보이지 않게 만드는 것입니다. 당신이 정말로 그를 "맹인"으로 만들고 그가 당신의 손절매 수준, 거래량, 사전 이익 수준에 대해 아무것도 모르고 있는지 확인하고 싶다면 이 거래 로봇을 사용하십시오.
Blind Broker System 은 주문을 관리하는 대체 시스템입니다. 어떤 의미에서는 Meta Trader Terminal 내부의 시스템과 동일합니다.
차이점은 Blind Broker System 을 통해 제출된 모든 주문은 브로커의 서버에 기록되지 않고 프로그램의 메모리에 기록된다는 것입니다.
브로커는 시장 주문이 발생하는 순간에만 요청을 받습니다. 그 이상은 없습니다.
메모! 올바른 작동을 위해서는 무정전 전원 공급이 필요하며 VPS(Virtual Private Server)를 권장합니다.
이 시스템은 화면 앞에 앉아 거래하는 자신의 복제품이라고 생각할 수 있습니다. 그러면 아무도 당신의 마음을 읽을
FREE
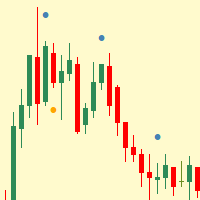
Simple indicator that shows internal (inside) bars.
Internal bars are probably one of the best price action setups to trade Forex with. This is due to the fact that they are a high-chance Forex trading strategy. They provide traders with a nice risk-reward ratio for the simple reason that they require smaller stop-losses compared to other setups. They can also be successfully utilised as reversal signals from key chart levels. Inside bar is a series of bars contained within the range of the co
FREE

Индикатор выводит первые производные двух MACD. По умолчанию, желтая MACD является более быстрой, чем синяя MACD. В настройках можно задать подходящие вам параметры для каждой из MACD. Одновременное изменение знака производных может являться дополнительным сигналом разворота. Входные параметры
Yellow MACD fast EMA period Yellow MACD slow EMA period Blue MACD fast EMA period Blue MACD slow EMA period
FREE
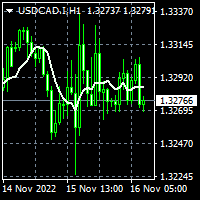
To download MT5 version please click here . Metatrader users are limited to few moving average types. Therefor I decided to create a package consisting of all MAs I knew. This package suggests 12 different types: { SMA, EMA, DEMA, TEMA, WMA, VWMA, SMMA(RMA), HullMA, LSMA, ALMA, SSMA, TMA } You can configure them via input tab. This is a non-repaint indicator with light load. To implement them I referred to standard libraries of pine script.
FREE

Description:
This Free Indicator will allow you to monitor the Max/Min spread in a bar/candle. By running it 24h/24h will allow you to recognize which period of time having maximum spread, based on that you will understand the market more, and could develop/improve to have better trading strategy.
Parameters: limit: <specify the limit of spread, above which the indicator will mark the price, at which high spread occurs>
Note: Beside the price marked due to high spread above, the indicator al
FREE

Features This EA uses MACD technical. This EA specializes in GBPJPY, so please run the backtest using the corresponding currency. Please apply this EA to the 15 minute chart. This EA divides the position into 3 positions for entry and exit, so it realizes high profit factor and low drawdown. The maximum profit is set at 0 pips(Unlimited). The maximum loss cut is set at 60pips. This EA is highly reliable because it is optimized using TICKDATA.
Parameters -----Basic parameter----- magicResistance
FREE

Area 51 EA generates signals on different strategies. Has different money management strategies and dynamic lot size function. When a position is opened, it is equipped with a take profit and a stop loss. If the position becomes profitable, a dynamic stop loss based on the specified values (TrailingStep and DistanceStep) will be set for it and constantly trailed. This allows you to always close positions in profit. For using the EA we recommend to use an ICMarkets True ECN account. Parameters
FREE

The script is based on the simulation of trade transactions using a random number generator. This allows you to get completely different results, even with the same input parameters. When you run the script, a dialog box opens in which you can set the desired values for external variables. In the Trading options block, the basic parameters that are necessary for trading modeling are defined. Start Balance - sets the initial size of the trade balance. Number Trade - sets the number of trade tr
FREE

Buffer Scanner is a Scripts to help you export only 2 buffers of your custom indicator data with history date time and open&close price in CSV file, The file name already has rename. More like for BinaryOptions indicators, analyzes, you can modify the input from script parameters,especially~!No need to worry about the indicator sets bars limited, some of the indicators have parameters, but important thing is bars limited, remind you this script just only for "The indicator which has one paramet
FREE

MDG REBORN It is a fully automatic, high precision breakout scalper born from the reworking and improvement of Million Dollar Guru, which runs on M1 chart.
By identifying areas of overbought and oversold over very short periods in combination with the ENVELOPES indicator and AVERAGE REGRESSION, this system allows for very high long-term returns that are difficult to compare with other types of scalping.
Furthermore, through a series of internal calculations on the speed and pressure of pri
FREE
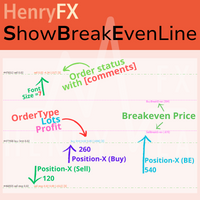
This indicator can help easy to management your order on screen.
FREE Version, included: - " Show Breakeven Price "
Show Breakeven Line Pro : : https://www.mql5.com/en/market/product/58289
Input Parameter: " Label Prefix "
:: [ ] Description; " Position-X-Dis "
:: [ ] Description; " Position-Y-Dis "
:: [ ] Description; " Show Market Price "
:: [ ] Description ; " Price Up Color "
:: [ ] Description; " Price Down Color "
:: [ ] Description ; " Position-Y-D
FREE

VisualOrders and InfoAccount - an indicator for analyzing your own trading or analyzing someone else's account.
Additionally, there is a possibility to quickly obtain information on the account and the terminal. Information is placed both on the chart and in the Experts tab.
All displayed information is disabled in the settings, allowing the trader to leave only the necessary information.
FREE

This is a very simple multiple moving average indicator.
It can display 12 moving averages. The time axis of the moving averages can be changed in the input field of the indicator. The process is faster than the 12 moving averages included with MT4.
We also have a buffer set up so you can access it from an Expert Advisor. *For advanced users.
If you have any questions or requests, please message me.
Thank you. MT5 Version: https://www.mql5.com/en/market/product/124997
FREE
Introducing Austin RSI—an innovative indicator designed to elevate your forex trading strategy by applying moving averages to the MetaTrader 4 indicator, RSI.
The Relative Strength Index (RSI) is a popular momentum oscillator that measures the speed and change of price movements. It oscillates between 0 and 100 and is used to identify overbought and oversold conditions in the market. Traders often use RSI to gauge the strength of price movements and anticipate potential trend reversals.
Austi
FREE
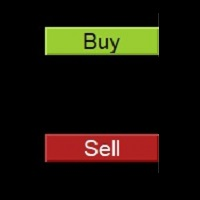
Simple buy and sell buttons to execute orders instant with automatically stop loss and take profit levels.
Stop loss and Take profit- levels can be changed in settings. Free version, only for US30- market.
Feel free to send direct message for improvements or other ideas..
---------------------- Payed version comming soon (for all markets/ timeframes).
FREE

Velvet MACD is intended for use with the Velvet advanced ordering layer. It is a modified version of the MACD indicator provided by Metaquotes and all of the data it displays is accurate and verified, when it is detected by the ordering layer. In order to place orders with the Velvet MACD indicator, the ordering layer must be installed and running. Ordering from the Velvet MACD indicator requires that "Velvet Ordering Layer" ( found here ), version 2.0 or higher, be installed and running. Whe
FREE

Sends price alerts conveniently to your Android/IOS device. Make sure push notifications are enabled in Metatrader settings and the PC/VPS is online 24/7. Price levels are updated automatically, but you can modify them in global variables, if needed. Suitable for any market instrument, but if notifications are too frequent, increase point value of the indicator parameter.
FREE

Risk Management Panel is unique to tool calculate your risk quickly and place trades based on your account money. There are two options for the user Account Equity Account Balance Tools like these is specially useful when you have to take a quickly decision about your trade but dont have the time to calculate the risk. It works with magic number. So the advantage is a trade placed by this panel could be manipulated by the other expert advisors as well
FREE

Индикатор вычисляет наиболее вероятные уровни возврата цены. Может быть использован для установки уровня тейк профит. Рекомендуемый таймфрейм - любой, при соответствующей настройке. Настройки.
Period - количество свечей для анализа. Accuracy - точность расчёта уровня в пунктах. Width - размер ценовой метки. Отработка уровней как правило не занимает много времени, уровни достаточно точны при касании и процент возврата цены к ним достаточно высок. Но следует учитывать риск продаж на локальных мин
FREE
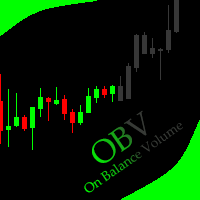
This indicator allows to hide OBV (on all MT4 timeframes) from a date define by the user with a vertical line (Alone) or a panel (with "Hidden Candles"). Indicator Inputs: Apply To Information on "On Balance Volume" indicator is available here: https://www.metatrader4.com/en/trading-platform/help/analytics/tech_indicators/on_balance_volume ************************************************************* Hey traders!! Give me your feeds! We are a community here and we have the same objective....
FREE
Please share a comment or rate for improvement Main Function : The start function is called on each new tick. It performs the main logic of the indicator: It initializes arrays to store daily high and low prices. It resizes and initializes these arrays based on the number of days specified by the DAYS input parameter. It copies the daily high and low prices into these arrays. It finds the highest high and the lowest low over the specified number of days. It displays these values as com
FREE

MWC COX indicator shows the extreme zones of net short/long positions for four periods of time. Default settings are periods of 12, 26, 52 and 156 weeks.
Additional Features
- Displays the sum of all 4 periods in one line
- MA, MOM and RSI indicators are integrated
Please make sure that you download the MWC_Demo.zip file and unpack it into [...]/MQL4/Files folder. -> www.myweeklycot.com/teaser-demo
FREE
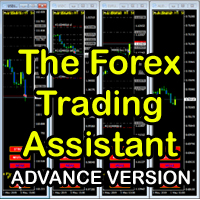
The Forex Trading Assistant is a trading utility that speeds up our execution of orders. The lot size is automatically computed based on the risk-on-balance you set in the input window. The pip value will be based on your risk-on-balance. Hence, the total stoploss is the actual risk computed based on your risk-on-balance per trade. Morever, you can drag your Order Line, Stoploss Line, and Takeprofit Line just like dragging a horizontal line on your chart. The following are the inputs. ( Click D
FREE

"Giant" is a flexible system in relation to trading strategies. It consists of two high-quality indicators that are installed on five different timeframes of the same currency pair (see screenshot). It monitors the trend and gives signals to open. The system passed a large number of checks and showed high accuracy. Indicators are sold separately. The second word in the main name is the indicator itself. This issue sells the indicator "Nicely" .
FREE
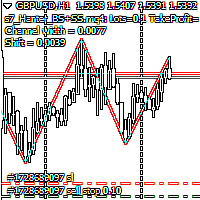
Script Hunting for the Channel Breakout The script is designed for semi-automatic trading. It can place required number of pending BuyStop and SellStop orders with preset StopLoss and TakeProfit levels in one go. The script calculates the channel width using the ZigZag indicator and places a grid of pending BuyStop and SellStop orders according to specified settings. The first pair of pending BuyStop and SellStop orders is placed at the specified distance from the channel's borders. This distanc
FREE
Trade Master is advanced forex robot for manual trading and managing open trades. When attached to a chart it prints two buttons BUY and SELL. Using these two buttons you can trade manually by predefined Stop Loss, Take Profit and other parameters. Trade Master is also equipped with Trailing Stop system to protect the profits. Trade Master is the best tools for scheduled closing of trades. It can be used for closing trades for each weekday from Monday to Friday at specific time (hour and minutes
FREE
MetaTrader 마켓 - 거래자를 위한 로봇 및 기술 지표는 거래 터미널에서 바로 사용할 수 있습니다.
The MQL5.community 결제 시스템은 MQL5.com 사이트의 모든 등록된 사용자가 MetaTrader 서비스에서 트랜잭션을 수행할 수 있습니다. 여러분께서는 WebMoney, 페이팔, 또는 은행 카드를 통해 자금을 예치하거나 인출하실 수 있습니다.
트레이딩 기회를 놓치고 있어요:
- 무료 트레이딩 앱
- 복사용 8,000 이상의 시그널
- 금융 시장 개척을 위한 경제 뉴스
등록
로그인
계정이 없으시면, 가입하십시오
MQL5.com 웹사이트에 로그인을 하기 위해 쿠키를 허용하십시오.
브라우저에서 필요한 설정을 활성화하시지 않으면, 로그인할 수 없습니다.