당사 팬 페이지에 가입하십시오
- 조회수:
- 24537
- 평가:
- 게시됨:
- 2016.04.26 15:43
-
이 코드를 기반으로 한 로봇이나 지표가 필요하신가요? 프리랜스로 주문하세요 프리랜스로 이동

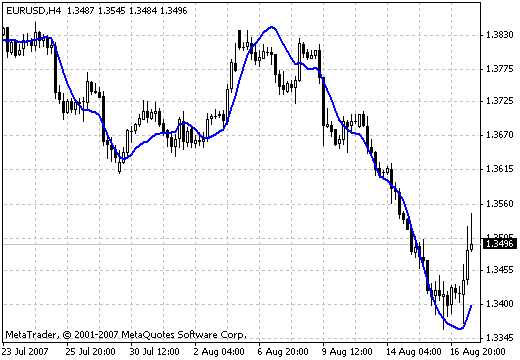
The mathematical formula expressing the linear regression looks the following way:
у = а + bx, where:
у - close price;
х - position of the current time period in the database;
а - 1/п (Ey - bEх);
b - (nExy - EхEу)/nEх2 - (Ex)2;
п - the number of time periods during the summation;
E - the sum for n periods.
The method of least squares is used for linear regressions in order to fit the line in the data set. The best line is found by minimizing the distance from the data points to this line.
MetaQuotes Ltd에서 러시아어로 번역함.
원본 코드: https://www.mql5.com/ru/code/7325
 DynamicRS+Channel
The indicator of dynamic resistance/support level with a fixed channel.
 LWMA-Crossover_Signal
In the case of weighted moving average, the latest data is of more value than more early data. Weighted moving average is calculated by multiplying each one of the closing prices within the considered series, by a certain weight coefficient.
 Lines_buy и Lines_sell
The indicators that perform the chart ruling.
 Macd-2
MACD2 generates bearish signals from three main sources. These signals are a reflection of the bullish signals - negative divergence, bearish intersection of the moving averages, bearish intersection of the center line.