당사 팬 페이지에 가입하십시오
- 조회수:
- 19563
- 평가:
- 게시됨:
- 2016.04.26 15:42
-
 이 코드를 기반으로 한 로봇이나 지표가 필요하신가요? 프리랜스로 주문하세요
프리랜스로 이동
이 코드를 기반으로 한 로봇이나 지표가 필요하신가요? 프리랜스로 주문하세요
프리랜스로 이동
The second indicator of the series of simple indicators without averaging.
The meaning of the indicator is quite clear from its code. Instead of analyzing the period, a fixed channel in both sides of the indicator line has been added. Initially it included period analysis, but experiments have shown that in the indicator values are mainly formed at the channel borders.
Use: first - we need to know the current trend at the older TFs. The most convenient way is to use the indicator on smaller timeframes with a small target. For example, for timeframe M5 the channel of 8 points works well. Enter a trade during correction one point above the main line of the indicator (to Sell) and one point below it (to Buy) with a target about 10 points, or one point beyond the channel. Better work with pending orders because small timeframe is used. Otherwise, you can be late sometimes. I have not tried it on the higher timeframes, as I am currently trying to create a program in such a way that it made 2-3 profitable positions with minimal risk every day. It is convenient to place the stop one point beyond the boundaries of the price channel (Donchian) with a period from 16 to 20.
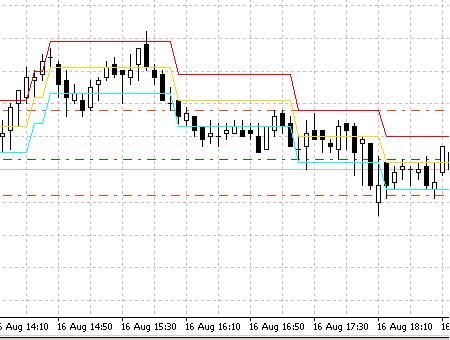
DynamicRS+Channel
MetaQuotes Ltd에서 러시아어로 번역함.
원본 코드: https://www.mql5.com/ru/code/7324
 LWMA-Crossover_Signal
In the case of weighted moving average, the latest data is of more value than more early data. Weighted moving average is calculated by multiplying each one of the closing prices within the considered series, by a certain weight coefficient.
LGP_Ivanoff_Maloma-Demark_levels
The indicator shows the price points of reference.
Linear Regression Line
Linear regression is a mathematical method for determining the linear dependence between the variables. This technique is often used by analysts to identify the trend based on the time and price data.
Lines_buy и Lines_sell
The indicators that perform the chart ruling.