당사 팬 페이지에 가입하십시오
- 조회수:
- 8037
- 평가:
- 게시됨:
- 2018.02.09 16:23
- 업데이트됨:
- 2018.05.07 07:40
-
 이 코드를 기반으로 한 로봇이나 지표가 필요하신가요? 프리랜스로 주문하세요
프리랜스로 이동
이 코드를 기반으로 한 로봇이나 지표가 필요하신가요? 프리랜스로 주문하세요
프리랜스로 이동
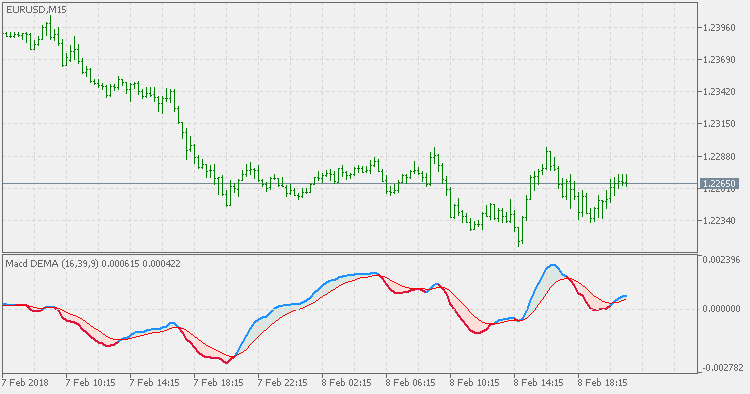
In his TASC January 1994 article "Smoothing Data With Faster Moving Averages", Patrick Mulloy describes a MACD that does not use EMA for MACD calculation but uses DEMA (Double Exponential Moving Averages).
According to him:
So here is the MACD that is using DEMA fo calculation.
 Smoothed Kijun-Sen
The Kijun-Sen is a major indicator line and component of the Ichimoku Kinko Hyo indicator, also known as the Ichimoku cloud. It is generally used as a metric for medium-term momentum.
CCI alternative
Commodity Channel Index (CCI) is a versatile indicator that can be used to identify a new trend or warn of extreme conditions. Donald Lambert originally developed CCI to identify cyclical turns in commodities, but the indicator can be successfully applied to indices, ETFs, stocks, and other securities.
MACD TEMA
MACD TEMA is even a bit more "faster" than MACD DEMA so, depending on the parameters, in scalping mode (short calculating periods) or trending mode (when longer periods are used. Never forget that MACD is primarily a momentum indicator and that it is the main goal of MACD.
TTM trend
The TTM (Trade The Markets) Trend is basically an easier way to look at candlesticks. It is the The Heikin-Ashi method. Literally translated Heikin is "average" or "balance,", while Ashi means "foot" or "bar." The TTM trend is a visual technique that eliminates the irregularities from a normal candlestick chart and offers a better picture of trends and consolidations.