Piyush Lalsingh Ratnu / プロファイル
- 情報
|
no
経験
|
0
製品
|
0
デモバージョン
|
|
0
ジョブ
|
0
シグナル
|
0
購読者
|
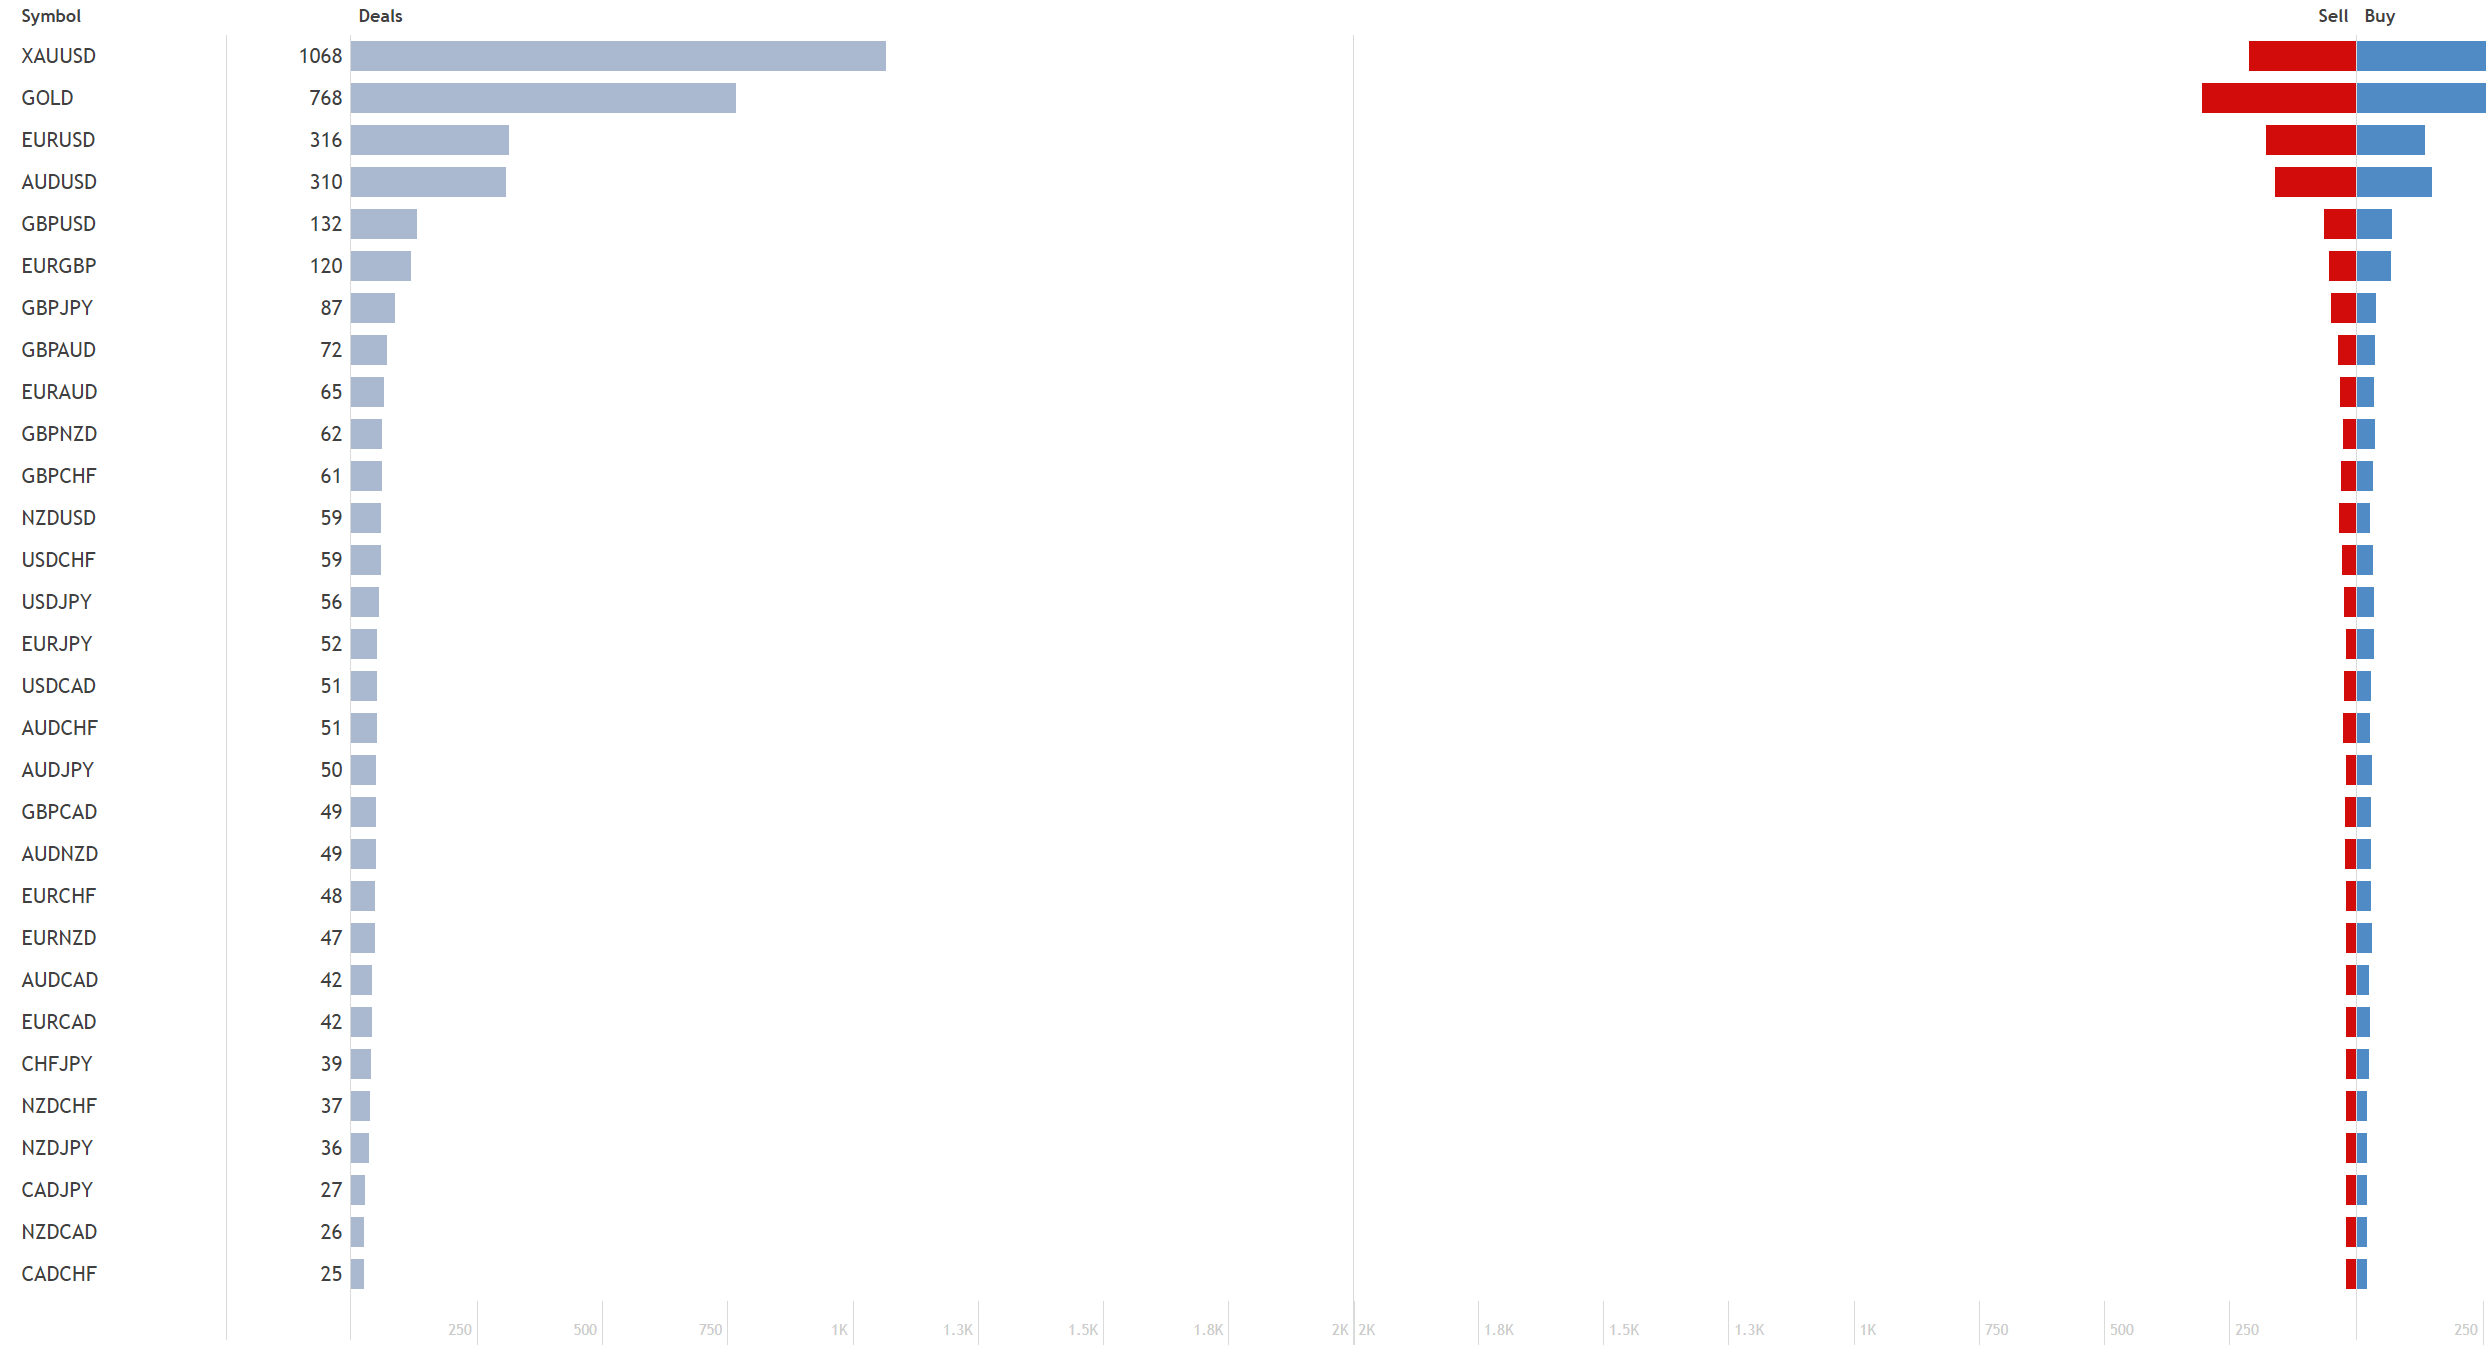
Piyush Ratnu is an independent forex market analyst & trader with core expertise in XAUUSD/Spot Gold.
With more than 15 years of experience as a Financial Market Analyst, Piyush Ratnu held the responsibility of developing and refining a series of algorithms & analytic tools to simplify the trading processes. His tools and algorithms were defined and rated as “unlike tools seen in the market before, extensively designed and most importantly, functional and logical” by some of the top financial companies and analysts at New York, London and Dubai.
Piyush Ratnu holds an experience of 290,000 trades, 1,790,000 pips calculated with a remarkable trading execution rate of 2 trades per second in an ideal scenario with profit booking in less than 8 seconds tracing 60+ pips/trade, as per audited and verified track record of last 10 years.
Core strength:
Economics, Economic Data Analysis, Spot Gold (XAUUSD), USD Majors, SR MTF Range Trading, Chart Patterns,
Volume Trading, Day Trading & Position Trading
Trading style
Fundamental based Intra-day trading.
Analysis based on proprietary algorithm + 90+ parameters.
Core focus: US Futures and XAUUSD | Spot Gold
Motto
Plan your trade, and then trade your plan!
Detailed research: https://www.reddit.com/r/prgoldanalysis
Track Record since 2021: https://bit.ly/PRxauusdAnalysis
MyFxBook:
X.com: https://x.com/piyushratnu
Insta: https://www.instagram.com/piyushratnuofficial
Connect for more details:
Telegram: https://www.T.me/PiyushRatnuOfficial
Risk Disclaimer:
Trading in foreign exchange (“Forex”) on margins entails high risk and is not suitable for all investors. Past performance is not an indication of future results. In this case, as well, the high degree of leverage can act both against you and for you. Trading foreign exchange, indices and commodities, on margin, carries a high level of risk and may not be suitable for all individuals.
The information made available by Piyush Ratnu is for your general information only and is not intended to address your particular requirements. In particular, the information does not constitute any form of advice or recommendation and is not intended to be relied upon by users in making, or refraining from making, any investment decisions.
Piyush Ratnu does not in any way guarantee that this information is free from mistakes, errors, or material misstatements. It also does not guarantee that this information is of a timely nature. Investing in Open Markets involves a great deal of risk, including the loss of all or a portion of your investment, as well as emotional distress. All risks, losses and costs associated with investing, including total loss of principal, are your responsibility. The views and opinions expressed in this article are those of the authors and do not necessarily reflect the official policy or position(s) of Piyush Ratnu.
Piyush Lalsingh Ratnu
GOLD: Daily chart setup: Key observations: 1836/1830 ZONE is a tough support, unless there is a catalyst to drive the downwards rally, 1830 zone looks solid support on 16.06.2021 and a point of reversal for 25% retracement after today's movement, before crashing further or reversing to 61.8% FIB level on today's chart. 38.2% at 1827.00 level also makes it a solid support, in addition two support lines can be seen at 1833 - 1827 adding to the solidarity of this price range. A sell signal on Daily chart is still pending which might indicate the further crash till 1818/1777 level subject to fundamentals, tapering, interest rate project, DOT plots, XAUXAG ratio, Yields, DXY, ETF, D-S zone and Inflation concerns.
GOLD: H1 chart setup: Algorithm has already published the crashing level till 1846 and 1839 (1836 zone) yesterday based on different parameters observed in algorithm. Again this indicates, a crash till 1846/1836 level as per our 15/20/30 level price crash and reversal till 30% retracement level after the crash in the first phase. NEXT expected signal on H1 chart is BUY, so we will be BUYING Session and Daily LOWS as indicated yesterday too.
Reverse scenario:
If GOLD rises to price level if 1872 and 1883, I will prefer to enter in retracement from 1880/1888 levels ( that is after a movement of minimum 25$ with price gap of $6 between each trade in GR strategy, this increasing the possibility of net average profit with every step, since 61.8% rests at 1881 price range with resistance at 1883.80 for today.
The rise can be repeated in early Asian session tomorrow early morning, with more 10-15 dollar price rise in GOLD, if the data, statements support GOLD prices for a higher rise.
Concluding:
A crash till 1836/1830 price range or a rise till 1880/1888 price range is expected, in both the cases we will first observe the movement and pattern, after the price rnage is achieved by GOLD we will enter in retracement keeping in mind 23.6 and 38.2% / 61.8% levels on M15 and H1 charts.
In addition, SMA, trend line, existing FIB Levels, yields, DXY, USDJPY movement, Dollar strength/weakness, XAUXAG ratio - interest rate and monetary policy related statements have to be observed and analysed carefully before taking any big lot, FED and FOMC is not an event to GAMBLE, it is an important event to understand FED's projection and further actions to set the price range and price targets for MAJORS and GOLD in correct co relation and retracement levels.
US Stocks will be range bound today due to Economic event today.
In price range based markets sudden rally followed by dead zones is very common resulting in frustration and multiplication of trades in a hope of exit in net average usually resulting in let loss.
Hence, trade wisely.
It is suggested to trade after watching NYSE opening, price range before and after opening followed by pattern formed before FED and FOMC.
I had suggested a V pattern and hence I will observing the crash first to enter in BUY: Retracement direction.
If I feel I am wrong and Gold rises first then I will wait to find out the reason behind it and then take entry based on the price range achieved before FOMC.

Piyush Lalsingh Ratnu

· Fed likely to steer clear of any discussion about exiting cheap money
· But it might pencil in a rate hike for 2023, lifting the dollar a little
· Gold was seen oscillating in a narrow trading band through the first half of the European session.
· Expectations for less dovish Fed – amid rising inflationary pressure – so far, has capped the upside.
· A subdued USD demand, a downtick in the US bond yields, softer risk tone extended some support.
The US economic engine is firing on most cylinders, with inflation running hot and consumption far beyond pre-pandemic levels, but the problem child is the labor market. It's still some 7 million jobs away from its pre-crisis glory, adding credence to the view that this inflation shock will fade and making the Fed hesitant to take its foot off the money accelerator.
All this implies the Fed is unlikely to begin a discussion about exiting asset purchases at this meeting. Chairman Powell might indicate this conversation is moving closer but hasn't started yet, preparing the market for a proper shift in the autumn. Beyond that, investors will focus on the new dot plot, where the first rate hike might be brought forward to 2023 as the economy has exceeded expectations.
That would normally argue for a stronger dollar, but any reaction may be minor as markets have already priced in two rate hikes for 2023, meaning this wouldn't be a shocker. Overall, there's no reason for the Fed to rock the boat right now. Inflation expectations and yields are stable or declining, and markets expect taper talks to begin in late August – so why mess with that? Any real dollar strength might have to wait until then.
Gold lacked any firm directional bias and remained confined in a narrow trading band through the first half of the European session on Wednesday. Investors now seemed reluctant to place any aggressive bets, rather preferred to wait on the side lines ahead of the highly-anticipated FOMC monetary policy decision. Investors might have started pricing in the prospects for an earlier stimulus withdrawal amid worries about rising inflationary pressure. This, in turn, was seen as a key factor that capped the upside for the non-yielding yellow metal.
That said, a combination of factors acted as a tailwind for gold and helped limit any losses, at least for the time being. Nervousness ahead of the key event risk was evident from a modest pullback in the equity markets. The prevalent cautious mood was seen as a key factor that extended some support to traditional safe-haven assets, including gold. Adding to this, a subdued US dollar demand – amid a modest downtick in the US Treasury bond yields – further held traders from placing fresh bearish bets around the dollar-denominated commodity. Gold’s next directional move remains in the hands of Fed Chair Jerome Powell and his outlook on the economy, which will influence the American central bank’s next policy action. Patchy US labor market recovery could likely challenge Fed’s tapering expectations.
Gold prices extended the leg lower on 15 June, 2021. The downtick, however, was accompanied by declining open interest and volume, indicative that further retracements are not favoured and opening the door at the same time to a potential rebound in the very near term.
A sustained break below the rising trendline support at $1854 will validate the downside breakout, opening floors the 200-Daily Moving Average (DMA) at $1840. Next on the sellers’ radars will be the May 14 low of $1820.
Acceptance above the falling trendline resistance at $1866 will invalidate the bearish formation.
If the FOMC disappoints the hawks, gold price could rebound towards the previous daily support now resistance at $1879. Ahead of that barrier, the $1870 static resistance and bearish 21-Simple Moving Average (SMA) on the four-hour chart could challenge the bullish commitments.
SUMMARY: 1836 or 1880 zone TODAY.

Piyush Lalsingh Ratnu
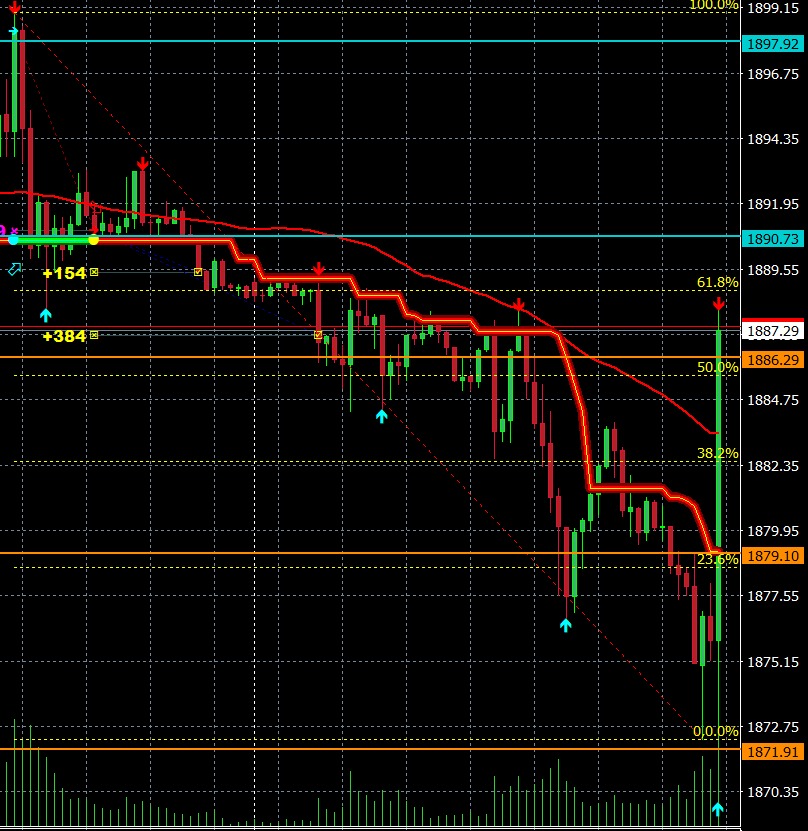
US CPI DATA: Performance of GOLD after + CPI data.
GOLD back to 1888 ONCE AGAIN. EXIT BUY. M15 61.8 | H1 SMA proved RESISTANCE.
US CPI. Strategy: BUY Today’s Lows. Exit at 25% reversal. Resistance: 1890. Support: 1866. Gold rallied from 1869 to 1888 in 10 minutes after + CPI data.
Accuracy proven once again.
#PiyushRatnu #Forex #Bullion #Gold #Analysis

Piyush Lalsingh Ratnu

US CPI DATA in 90 minutes: Possible Impact | TAPERING to guide
If the US CPI print comes in hotter than the consensus of a 0.4% rise in May, it will ramp up the Fed’s tapering expectation, which will render negative for the non-yielding gold. The ECB could also hint towards dialling back of the emergency bond-buying programme.
Sellers could target the immediate support at the horizontal trendline connecting previous lows at $1881. A breach of the latter could trigger a drop towards the June 4 low of $1856. Ahead of that, a demand area around $1865 could offer some reprieve to the bulls.
Any recovery attempt could face stiff resistance around the $1891-$1895 region, where the 21, 50 and 100-simple moving averages (SMA) collide. Further up, the triangle resistance at $1900 will challenge the bullish commitments. The previous month high at $1913 is the level to beat for the optimists.
Forecast from eight banks:
https://www.fxstreet.com/news/us-cpi-preview-forecasts-from-eight-major-banks-for-critical-may-inflation-202106100957
Expected crash: 1866 zone (+/-10) in SS1 1106
Expected rise: 1896/1907 zone
Fib Reversals:
M30 Possibility of heavy resistance at 50% and 61.8%
Resistance
1890-96/1900-1907 zone
H4: Possibility of reversals at 38.2% / 61.8%
Support
1866/1860 - 1836-1827 zone
H1: Possibility of reversals from 23.6% and 0.0% Support
1870/1866/1856 (4 June low)
SMA
M30 SMA
1888
H1SMA
1890
H4 SMA
1893
As per our algorithm:
BUY at DAILY LOWS | Exit in 25% reversal price zone.
M15 M30 H1 BUY Alerts AWAITED.
#PiyushRatnu #Forex #Bullion

Piyush Lalsingh Ratnu
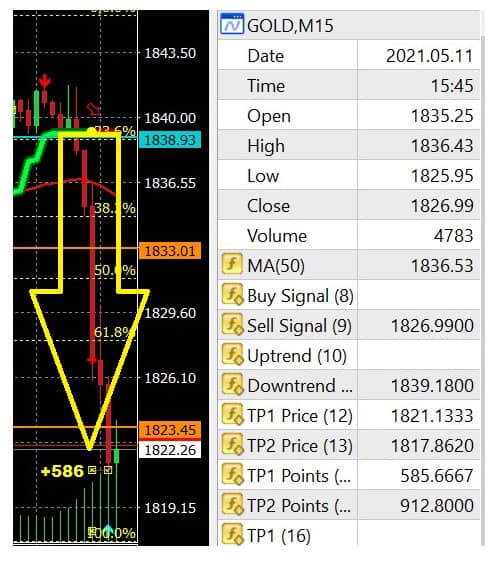
11.05.2021
SPOT GOLD | XAUUSD:
As broadcasted on 07 May 2021 Gold was in sell : market correction zone. Today Gold crashed from 1842/1836 sell zone/resistance zone to 1818.
SELL SIGNAL generated by our algorithm at 15.45 hours on 11.05.2021 | Target Price 1 and 2 achieved successfully.
To receive trading analysis and trading algorithm signals in advance, contact us for more details at info@piyushratnu.com
#PiyushRatnu #Bullion #Gold #Forex #Trading
Team,
Piyush Ratnu

Piyush Lalsingh Ratnu
In the aftermath of the Great Recession, the central banks adopted an aggressive monetary policy, slashing interest rates to almost zero and introducing quantitative easing. It has become a new norm since then.
According to the IMF’s Fiscal Monitor Update from January 2021, fiscal deficits amounted to 13.3 percent of GDP, on average, in advanced economies, in 2021, a spike from 3.3 percent seen in 2019. As a consequence, the gross global debt approached 98 percent in 2020 and it’s projected to reach 99.5 percent of the world’s GDP by the end of this year.
First, money flowing into the economy through nonfinancial institutions and people’s accounts may be more inflationary. This is because money doesn’t stay in the financial market where it mainly raises asset prices, but it’s more likely to be spent on consumer goods, boosting the CPI inflation rate. Higher officially reported inflation (and relatively lower asset prices) should support gold, which is seen by investors as an inflation hedge.
Second, the direct cash transfer to the people creates a dangerous precedent. From now, each time the economy falls into crisis, people will demand checks. It means that fiscal responses would have to be increasingly larger to meet the inflated expectations of the public. It also implies that we are approaching a universal basic income, with its mammoth fiscal costs and all related negative economic and social consequences.
Summing up, we live in revolutionary times. The old paradigm that “central banks are the only game in town” has been replaced by the idea that fiscal policy should be more aggressively used. Maintaining balanced budgets is also a dead concept – who would care about deficits when interest rates are so low?
However, assigning a greater role to fiscal policy in achieving macroeconomic goals increases the risk of higher inflation and macroeconomic instability, as politicians tend to be pro-cyclical and reckless. After all, the economic orthodoxy that monetary policy is better suited to achieve macroeconomic stability didn’t come out from nowhere, but from awful experiences of the fiscal follies of the past. I’m not a fan of central bankers, but they are at least less short-sighted than politicians who think mainly about how to win the next election and stay in power.
Hence, the growing acceptance of easy fiscal policy should be positive for gold prices, especially considering that it will be accompanied by an accommodative monetary policy. Such a policy mix should increase the public debt and inflation, which could support gold prices. The caveat is that investors have so far welcomed more stimulus flowing from both the Fed and the Treasury. But this “go big” approach of Powell and Yellen increases the longer-term risk for the economy, which could materialize – similar to the pandemic – sooner than anyone thought.
THIS WILL TRIGGER GOLD +++. Stay CAUTIOUS.
Summary: The growing acceptance of easy fiscal policy should be positive for gold prices.
XAUUSD | Spot GOLD Analysis 27.04.2021 | #PiyushRatnu

Piyush Lalsingh Ratnu
Downtrend traced at 1885 on 15 Jan 2021.
|
Alerted by us on 18.01.2021 and 28.01.2021
|
Target price 1800 and 1732 achieved successfully on 01 March, 02 March and 03 March 2021.
|
Total pips encashed: 10,000+
|
To receive trading analysis and trading algorithm signals in advance, contact us for more details.
#PiyushRatnu #Bullion #Gold #Forex #Trading
|
Alerted by us on 18.01.2021 and 28.01.2021
|
Target price 1800 and 1732 achieved successfully on 01 March, 02 March and 03 March 2021.
|
Total pips encashed: 10,000+
|
To receive trading analysis and trading algorithm signals in advance, contact us for more details.
#PiyushRatnu #Bullion #Gold #Forex #Trading
Piyush Lalsingh Ratnu
GOLD: M Scenario based on Yield and Debt
At a 1.1% yield on the 10-year note, the annual servicing payment would amount to roughly $370 billion. Right now, U.S. national debt is approaching $28 trillion, and total debt-to-GDP sits at a stunning 146%.
The U.S. federal budget deficit itself is already at $4.5 trillion or so, after adding the Trump administration’s $3 trillion plus COVID-19 stimulus for last year.
If the 10-year note’s yield rate stands at 2%, coupled with a $30 trillion national debt, annual servicing payments alone would amount to $660 billion roughly.
Annual deficits will continue to make the national debt stack ever higher.
And while the United States appears to be in the relatively early stages of a monetary expansion cycle, money supply could still increase substantially and set the country up for a return to the 2008/2009 financial crisis days.
With the dilution of the fiat monetary system, higher inflation is most certainly on the way. Historically, gold prices have a very strong correlation on a long-term basis with monetary base expansion.
#XAUUSD #GOLD #PiyushRatnu
Piyush Lalsingh Ratnu
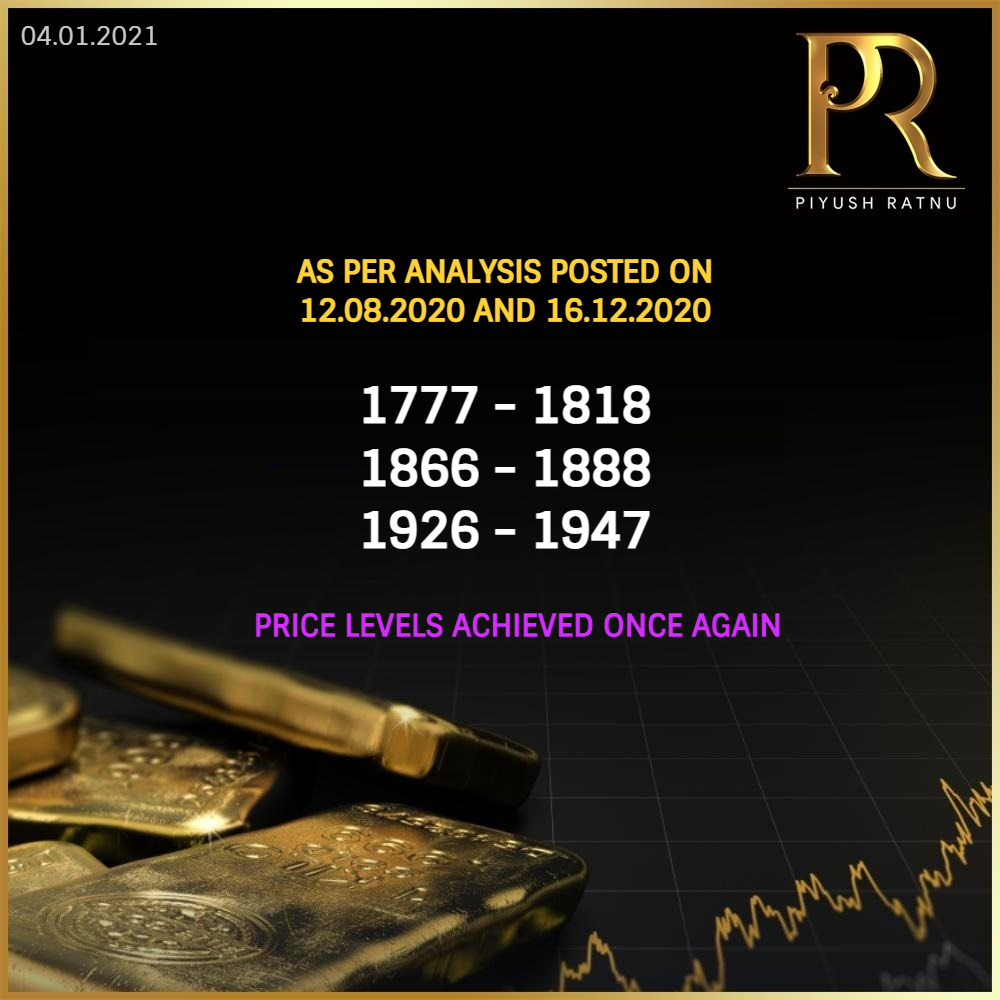
As per analysis dated 12.08.2020 and 16.12.2020, Gold touched the level of 1888, 1926 and 1947, after crashing till 1777.Accuracy of analysis in Gold proven once again. In the analysis dated 12.08.2020 crash till 1777 was well mentioned with crucial levels of 1926, 1888, 1866, 1818 and 1777.
On 16.12.2020 I had published my analysis mentioning the strong possibility of rise in Gold prices after 16.12.2020 as per past data, history, trend, dollar weakness and growing uncertainty + miner stocks, ETF volumes and volume - momentum based open contracts ratio.
I am sure, those who believed in me and in my analysis have made handsome profits today. The reversal from 1777 to CMP 1926 gives an opportunity to encash 108$ movement in the last 4 months + last 15 days repeatedly. On 1 lot it gives a profit of $10,800, 10 lot- $1,08,000 and on 100 lot: $ 1.8 Million on single trades, and the proof of the same can be seen in the video posted below.
Subscribe to our analysis and trading algorithms to trade Forex and Bullion markets with confidence and accuracy.
For more trading ideas, email at piyushratnu@gmail.com
#PiyushRatnu #Forex #Bullion #Gold

Piyush Lalsingh Ratnu
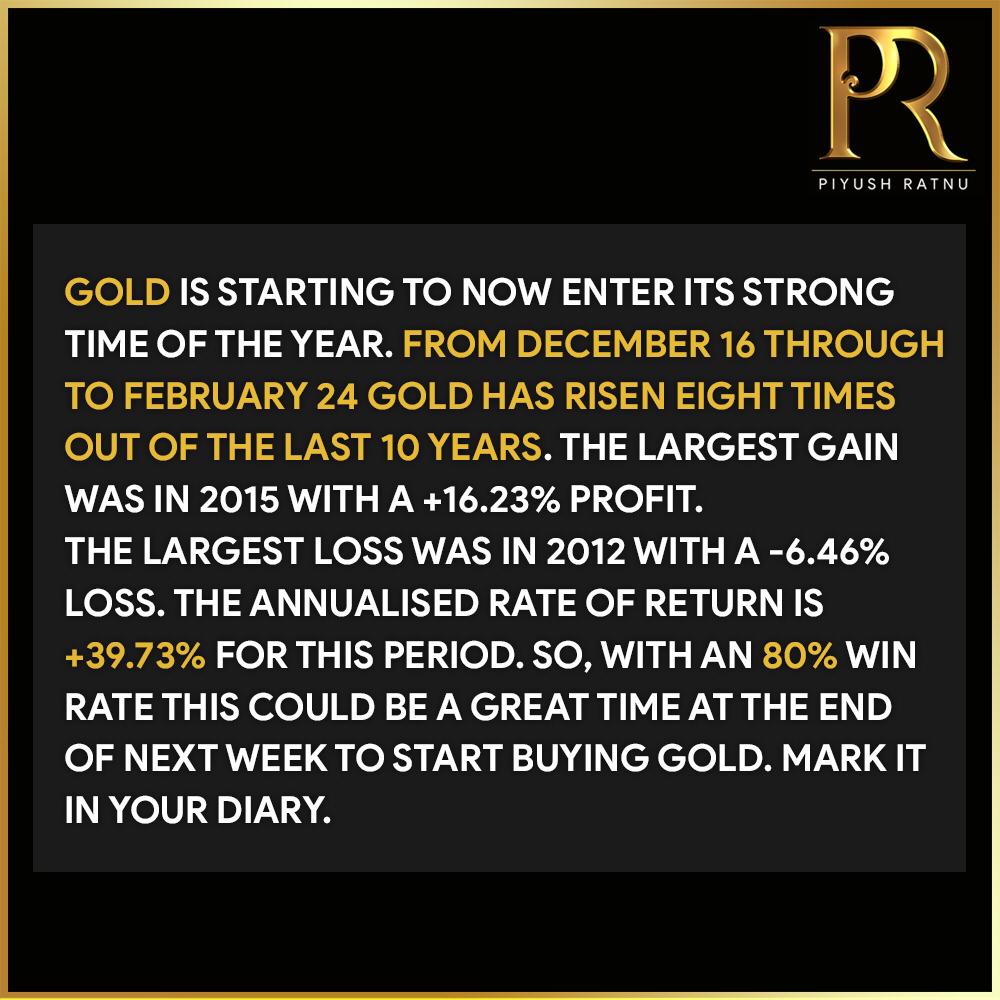
Gold is starting to now enter its strong time of the year. From December 16 through to February 24 gold has risen eight times out of the last 10 years. The largest gain was in 2015 with a +16.23% profit. The largest loss was in 2012 with a -6.46% loss. The annualised rate of return is +39.73% for this period.
So, with an 80% win rate this could be a great time at the end of next week to start buying gold. Mark it in your diary. Dollar strength and Lack of perceived action Federal Reserve can invalidate this outlook.
For more trading ideas, email at piyushratnu@gmail.com
#PiyushRatnu #BullionTrading #Forex #Analysis #FinancialMarkets

Piyush Lalsingh Ratnu
11.12.2020
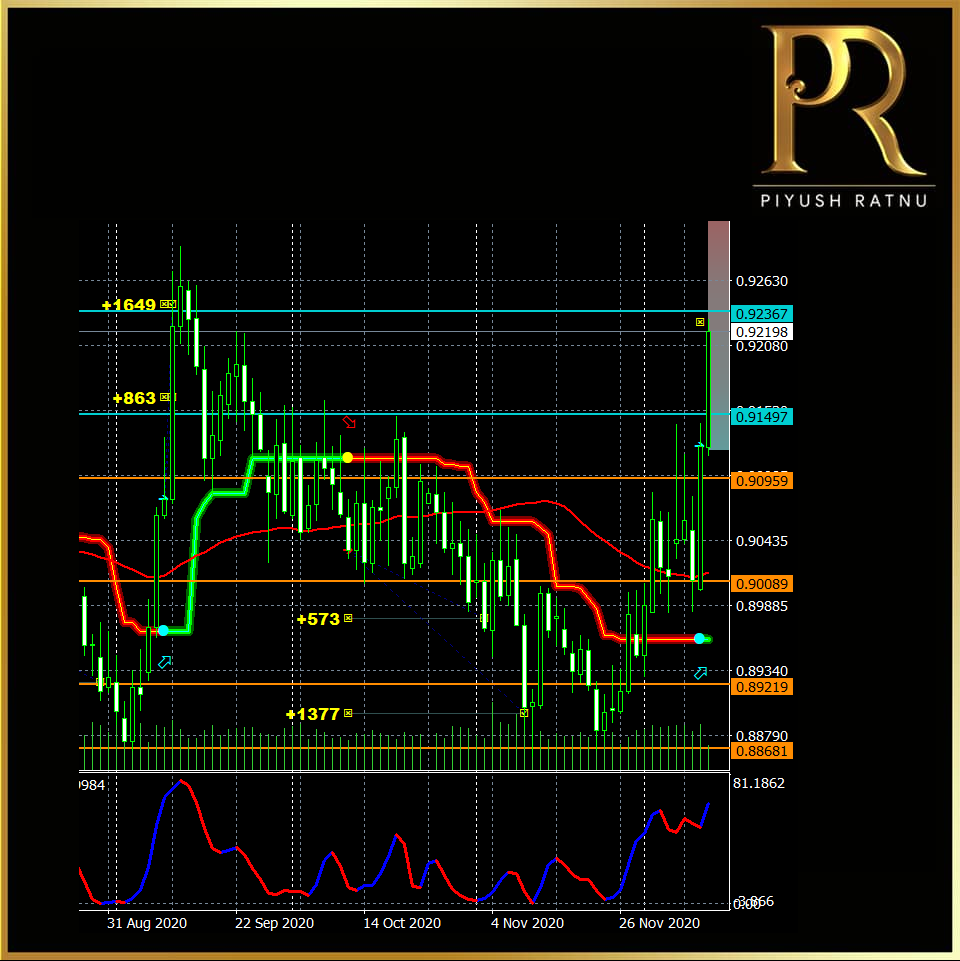
EURGBP | Trading Direction Alert by Algorithm | BUY from 0.89200 level
CMP: 0.92100 | Target Price achieved | For more trading ideas, email at piyushratnu@gmail.com
#PiyushRatnu #BullionTrading #Forex #Analysis #FinancialMarkets
EURGBP | Trading Direction Alert by Algorithm | BUY from 0.89200 level
CMP: 0.92100 | Target Price achieved | For more trading ideas, email at piyushratnu@gmail.com
#PiyushRatnu #BullionTrading #Forex #Analysis #FinancialMarkets

Piyush Lalsingh Ratnu
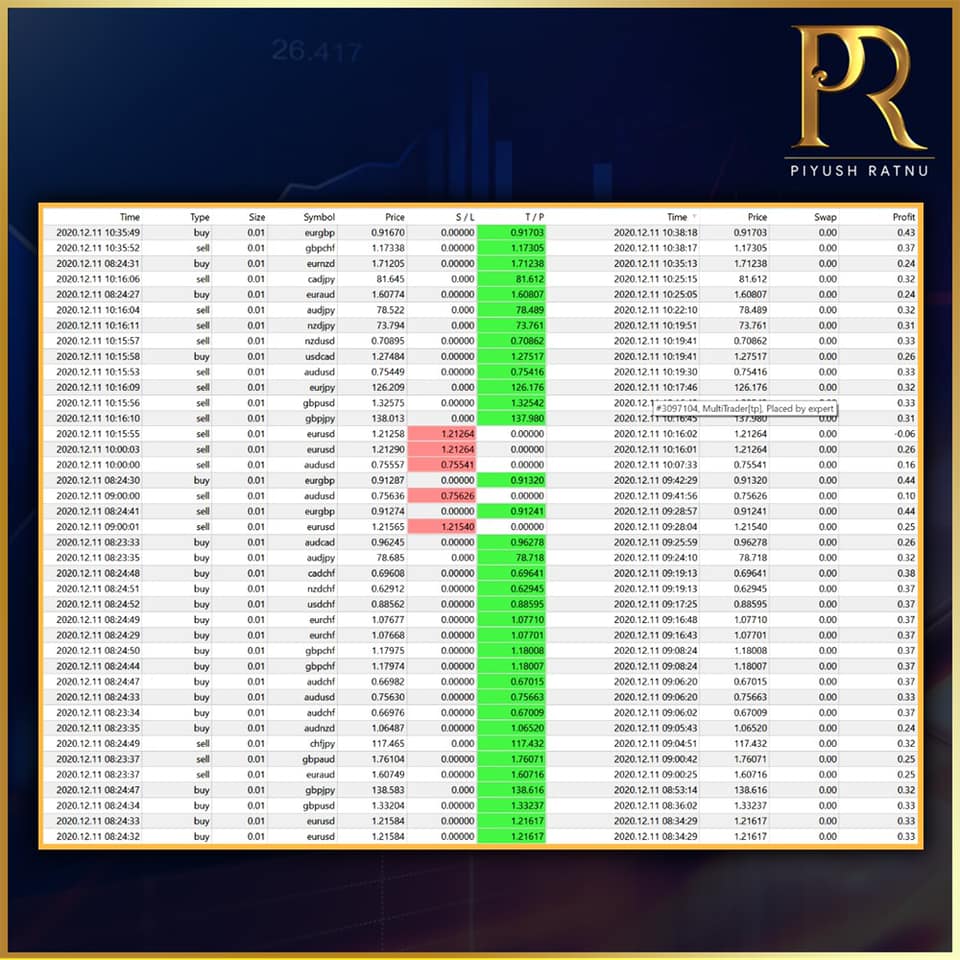
11.12.2020
27 currencies trades. 98% TP Hit.
Algorithm: $AMG
#PiyushRatnu #forextrading #bulliontrading
27 currencies trades. 98% TP Hit.
Algorithm: $AMG
#PiyushRatnu #forextrading #bulliontrading

Piyush Lalsingh Ratnu
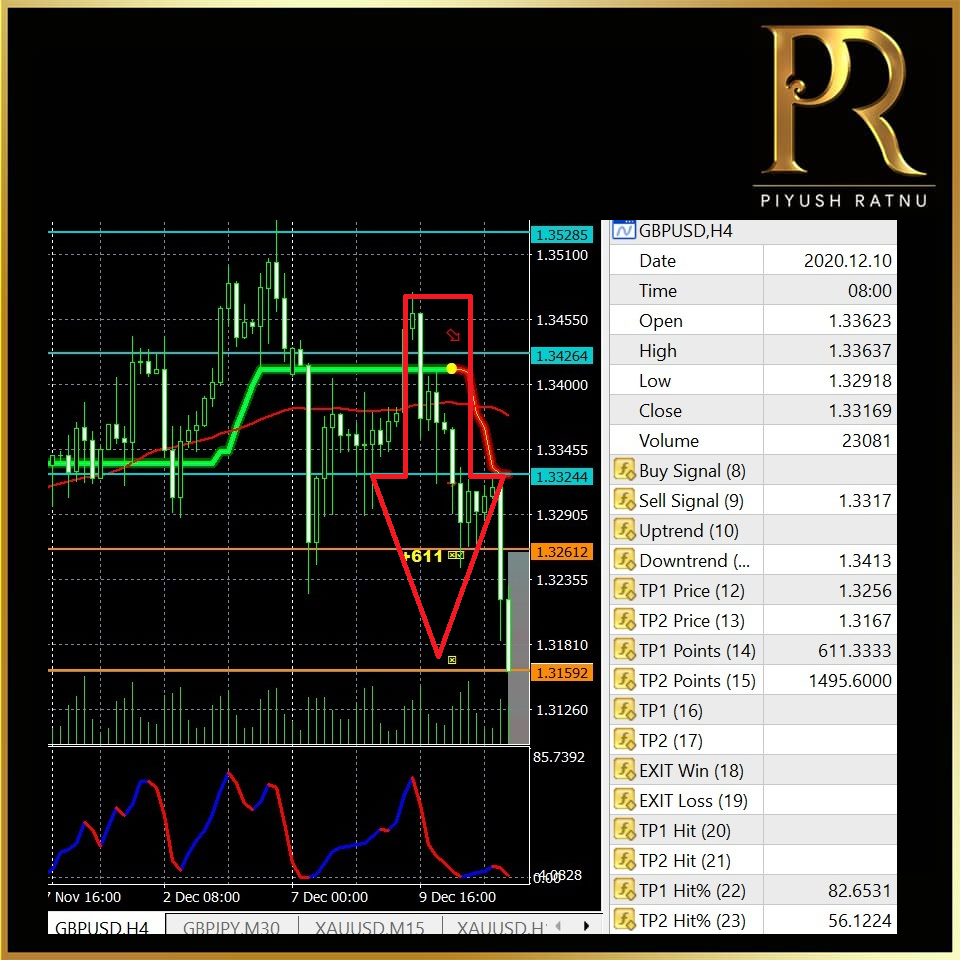
Date of analysis: 08 12 2020
Today GBPUSD has crashed to 1.31500 levels.
As per our trading algorithm $AMG, SELL signal on H4 chart, with target price of 1.31500 level was well declared on 08.12.2020
#Brexit #GBPUSD #forex #fx #PiyushRatnu
Today GBPUSD has crashed to 1.31500 levels.
As per our trading algorithm $AMG, SELL signal on H4 chart, with target price of 1.31500 level was well declared on 08.12.2020
#Brexit #GBPUSD #forex #fx #PiyushRatnu

Piyush Lalsingh Ratnu
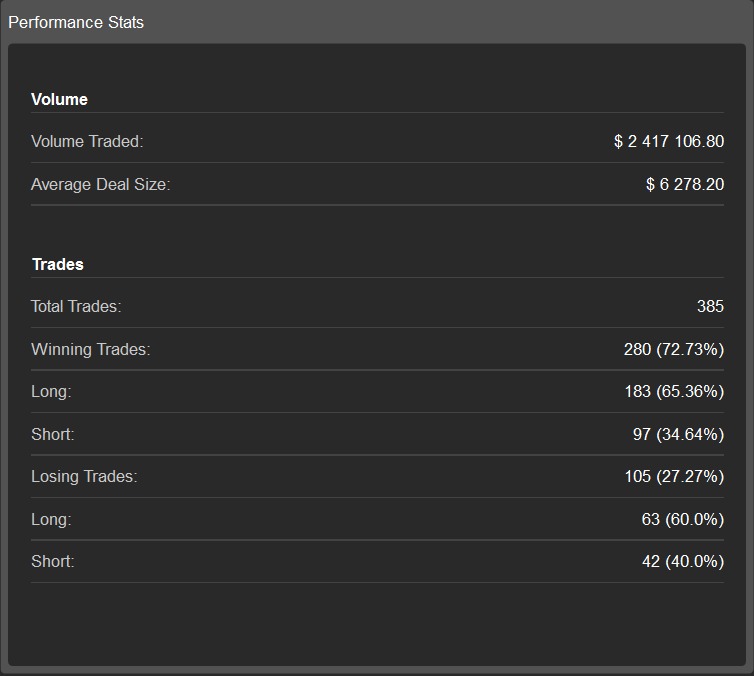
11.12.2020 | Trading: Financials Summary |Platform: Ctrader
Total Volume Traded: $ 2,417,106 | Average Deal size: $ 6,278 | Accuracy: 72.7%
To subscribe my analysis & signals: Email: piyushratnu@gmail.com
#PiyushRatnu #BullionTrading #Forex #Analysis #FinancialMarkets
Total Volume Traded: $ 2,417,106 | Average Deal size: $ 6,278 | Accuracy: 72.7%
To subscribe my analysis & signals: Email: piyushratnu@gmail.com
#PiyushRatnu #BullionTrading #Forex #Analysis #FinancialMarkets

Piyush Lalsingh Ratnu
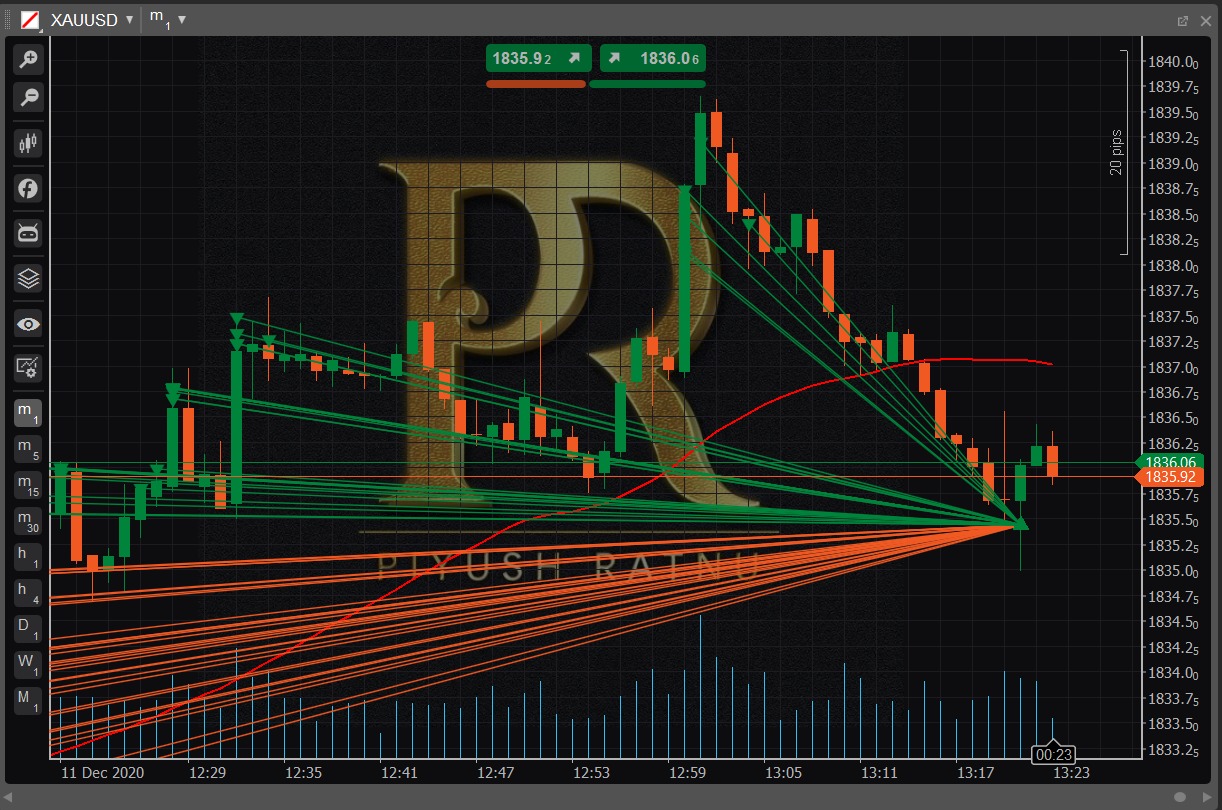
11.12.2020 | Trading Summary | XAUUSD | Platform: CTrader
Death CROSS Alert was posted by me on 19 Nov. 2020 on Whatsapp and T Channel.
Gold Crashed from 1877 to 1760.00 Price Range. Accuracy Proven Once Again.
#PiyushRatnu #Forex #Bullion #Gold
Death CROSS Alert was posted by me on 19 Nov. 2020 on Whatsapp and T Channel.
Gold Crashed from 1877 to 1760.00 Price Range. Accuracy Proven Once Again.
#PiyushRatnu #Forex #Bullion #Gold

Piyush Lalsingh Ratnu
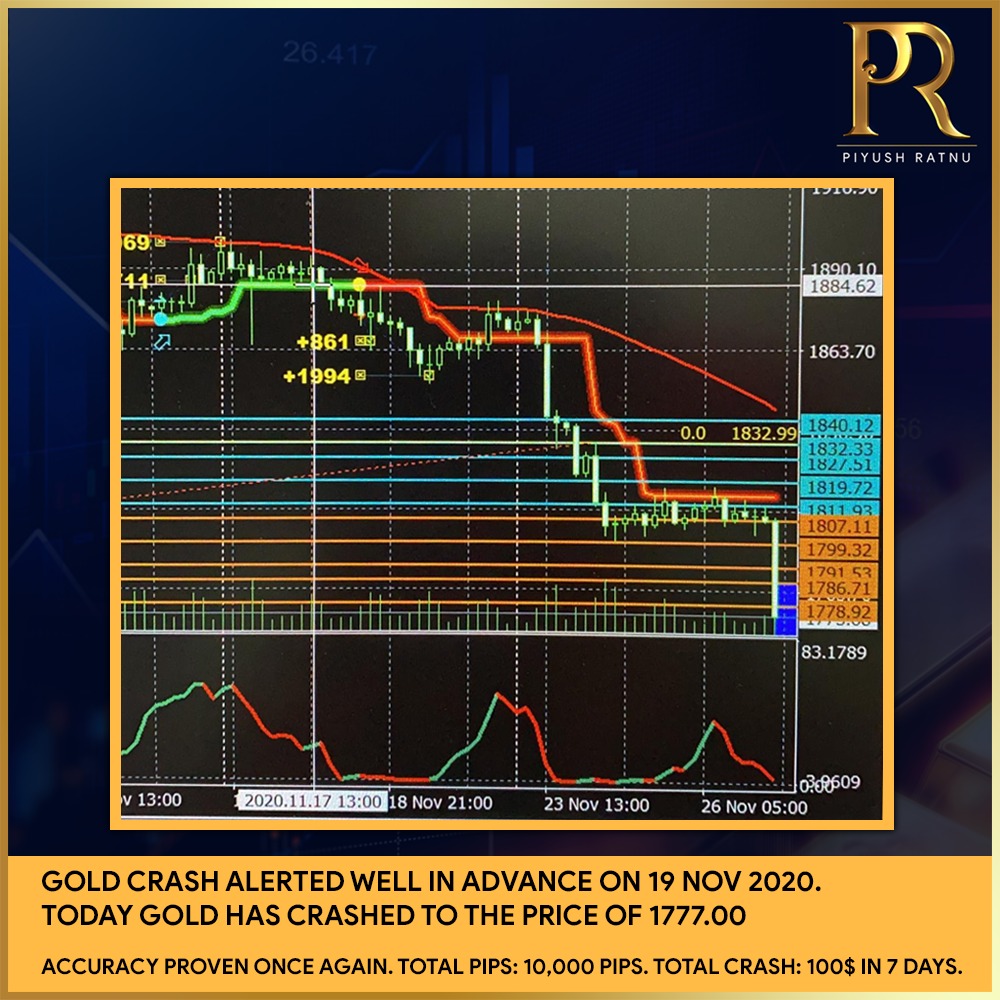
Accuracy at it's best! GOLD Crash Target 1777.0 achieved today.
Alert was posted by me on 19 Nov. 2020 on Whatsapp and T Channel.
#PiyushRatnu #Forex #Bullion #Gold
Alert was posted by me on 19 Nov. 2020 on Whatsapp and T Channel.
#PiyushRatnu #Forex #Bullion #Gold

Piyush Lalsingh Ratnu

Gold crash alerted well in advance on 19 Nov 2020.
Today Gold has crashed to the price of 1777.00
Accuracy proven once again.
Total pips: 10,000 pips. Total crash: 100$ in 7 days.
#PiyushRatnu #Gold #Bullion #ForexTrading
Today Gold has crashed to the price of 1777.00
Accuracy proven once again.
Total pips: 10,000 pips. Total crash: 100$ in 7 days.
#PiyushRatnu #Gold #Bullion #ForexTrading

Piyush Lalsingh Ratnu
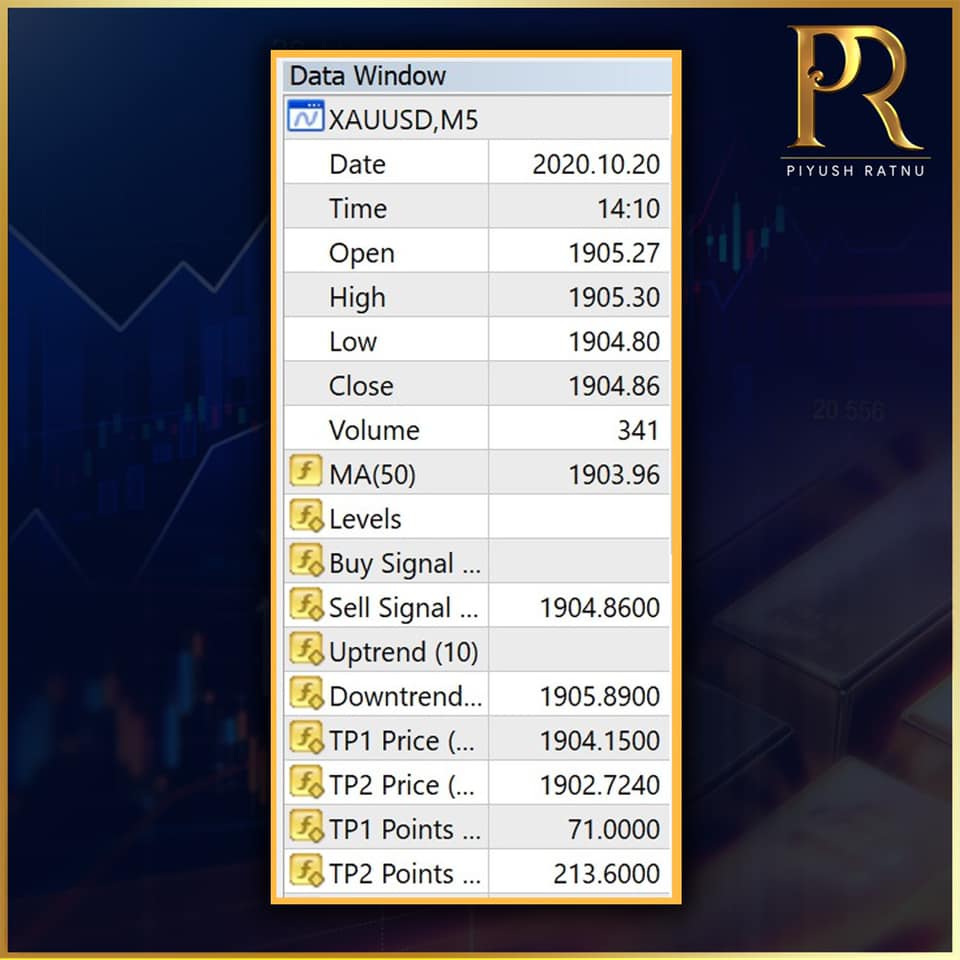
20.10.2020
Today’s 12 trade signals and analysis. Accuracy: 89%
#PiyushRatnu #Analysis #Trade #Forex #fx
Today’s 12 trade signals and analysis. Accuracy: 89%
#PiyushRatnu #Analysis #Trade #Forex #fx

:
