Aleksey Ivanov / プロファイル
- 情報
|
8+ 年
経験
|
32
製品
|
146
デモバージョン
|
|
0
ジョブ
|
0
シグナル
|
0
購読者
|
👑 理論物理学者、プログラマー、15年の経験を持つトレーダー。
----------------------------------------------------------------------
💰 生産された製品:
1) 🏆 市場ノイズの最適なフィルタリングを備えたインジケーター(開始位置と終了位置のポイントを選択するため)。
2) 🏆 統計的指標(世界的な傾向を決定するため)。
3) 🏆 市場調査指標(価格の微細構造を明確にし、チャネルを構築し、トレンドの逆転と引き戻しの違いを特定するため)。
---------------------------------------------------------------------
☛ ブログの詳細 https://www.mql5.com/en/blogs/post/741637
Aleksey Ivanov
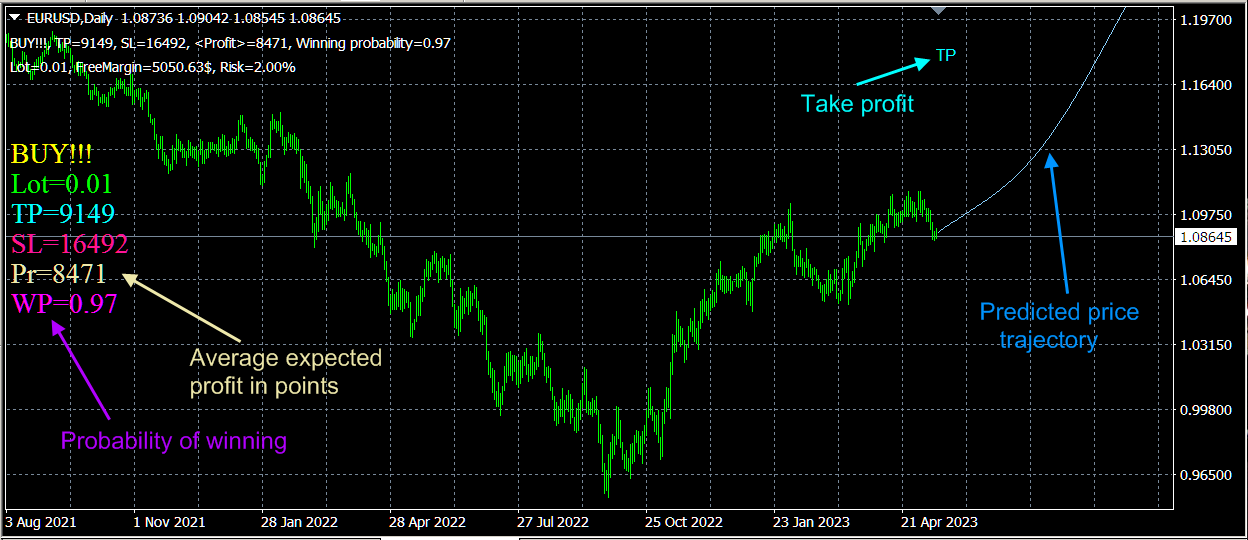
+ NEW!!! Extremely user-friendly indicator with the most advanced algorithms. Does all the work for the trader. Indicator with semi-automatic robot functions!!! Scientific trade https://www.mql5.com/en/market/product/98467

Aleksey Ivanov
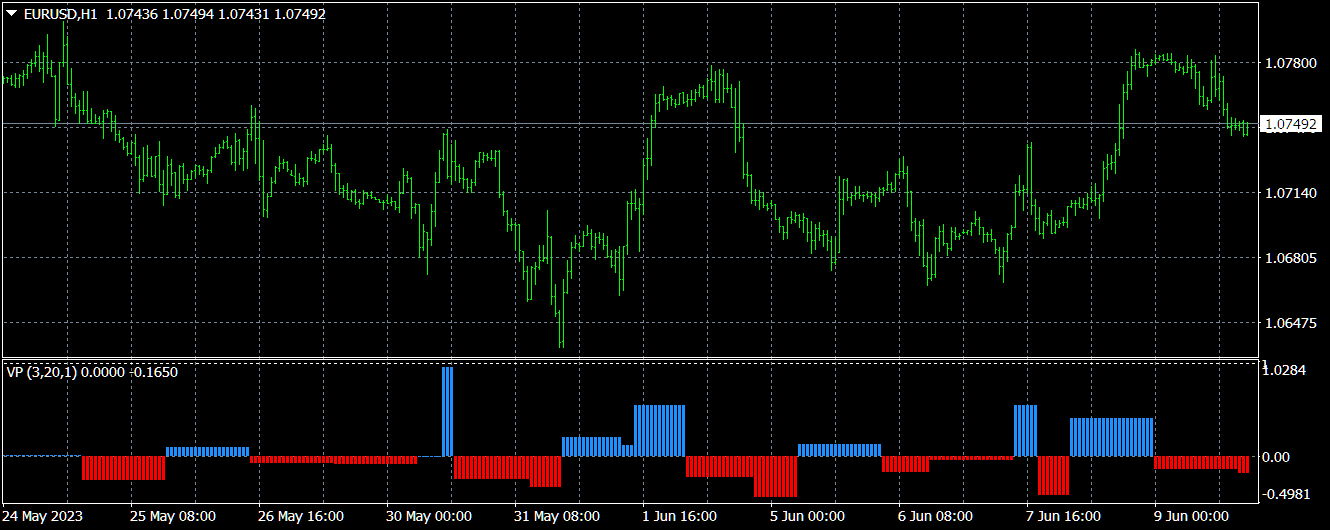
Velocity of price change https://www.mql5.com/en/market/product/62315
The Velocity of price change indicator shows the average rate of price change at those characteristic time intervals where this rate was approximately constant. The robust algorithm used in Velocity of price change to smooth out the price from its random jumps, ensures the reliability of the indicator reading, which does not react to simple price volatility and its insignificant movements.
✔️The algorithms of this indicator are unique and developed by their author
Author Aleksey Ivanov https://www.mql5.com/en/users/60000382

Aleksey Ivanov
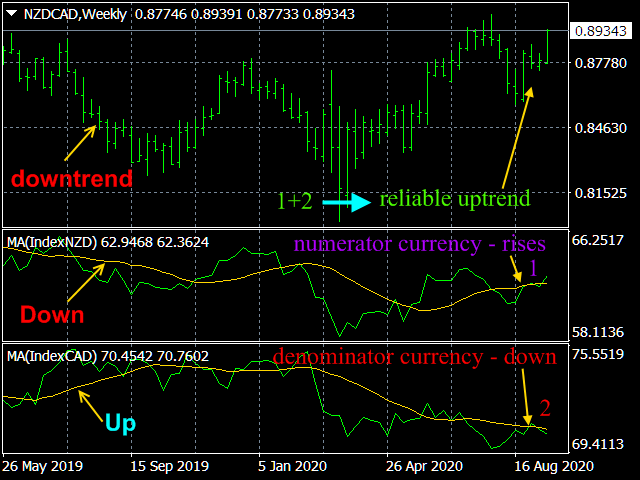
Absolute price https://www.mql5.com/en/market/product/54630
✔️ This indicator is intended for professionals assessing fundamental market trends. This indicator calculates the index of any instrument and analyzes it.
✔️ The indicator has modes for analyzing the indices themselves, namely: Moving Average; Relative Strength Index; Momentum; Commodity Channel Index; Bollinger Bands; Envelopes.
Author Aleksey Ivanov https://www.mql5.com/en/users/60000382

Aleksey Ivanov
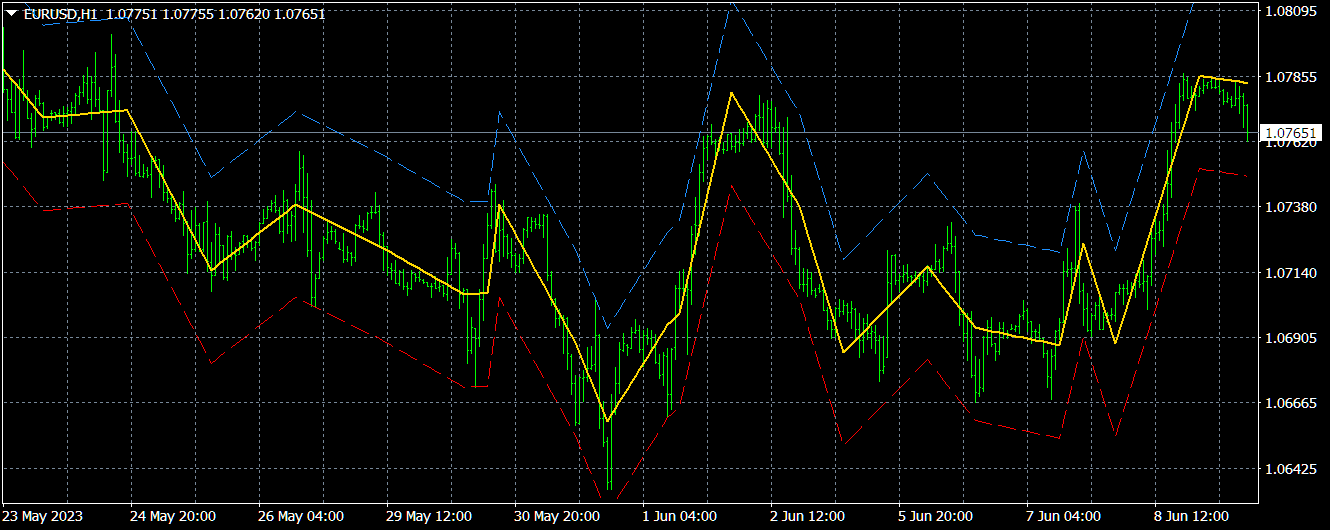
StatZigZag https://www.mql5.com/en/market/product/61091
✔️The algorithms of this indicator are unique and developed by their author
✔️ The StatZigZag indicator also builds a channel of maximum price fluctuations around the broken regression line, on the lower (red) line of which you can set StopLoss for buy orders, and on the upper (blue) line - StopLoss for sell orders.
Author Aleksey Ivanov https://www.mql5.com/en/users/60000382

Aleksey Ivanov

Identify Trend FREE https://www.mql5.com/en/market/product/36336
Identify Trend well-known popular indicator with optimal market noise filtering.
✔️The indicator has all kinds of alerts.
✔️The algorithms of this indicator are unique and developed by their author
Author Aleksey Ivanov https://www.mql5.com/en/users/60000382
Identify Trend well-known popular indicator with optimal market noise filtering.
✔️The indicator has all kinds of alerts.
✔️The algorithms of this indicator are unique and developed by their author
Author Aleksey Ivanov https://www.mql5.com/en/users/60000382

Aleksey Ivanov
Scientific trade https://www.mql5.com/en/market/product/98467
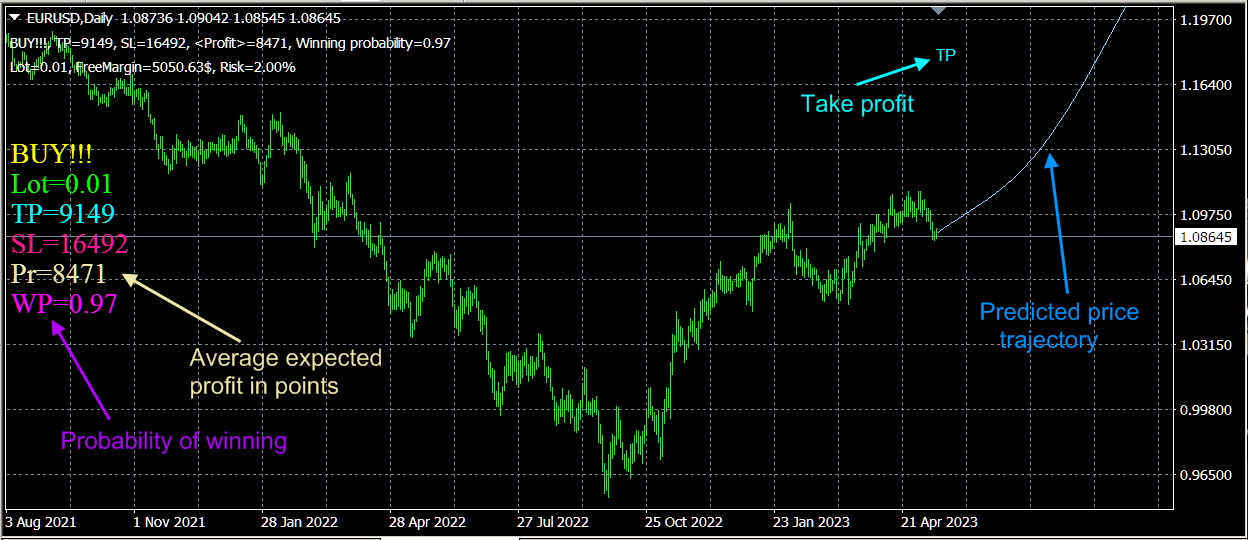
An extremely convenient indicator that truly makes the process of making money on the exchange easy. It is based on the scientifically rigorous theory of the market developed by the author, the beginning of which is presented https://www.mql5.com/en/articles/10955 .
The indicator calculates the most probable price movement trajectory and displays it on the chart. Based on the predicted price movement trajectory, the indicator calculates the direction of the position and the position of the take profit. Based on the statistically calculated uncertainty of the trajectory of the predicted price movement, the selected risk level and the size of the deposit, the indicator also calculates the lot size and stop loss position. The averaging period of the indicator is selected based on the maximum probability of winning, which is presented for each period on the main chart of the trading terminal.
It is better to use M1-M15 timeframes in the indicator; at the same time, it is recommended to play according to the global trend, determined on H4, D1, i.e. if the indicator gives a SELL signal, then this position is opened when the global trend is down; if the indicator signal is BUY, then the position is opened when the global trend is up.
After choosing a timeframe, you sort through the averaging values like 20, 30, 40, …, 200 and look at the trading terminal at what value the maximum probability of winning is achieved. This is the value you should use. Since the averaging period of the indicator must be selected manually in the process of moving along the price history, the indicator readings in the tester cannot reflect the full effectiveness of its work and may be incorrect.
The operation of the indicator is based on predicting the market's own trends, so it is not recommended to use it before and immediately after strong news, as well as in case of strong market volatility, especially if the volatility is the result of crisis processes. The indicator's forecast period, which is its averaging period, should not go beyond the future moment of strong news release.
Before opening a position, you should only assess the state of the market and take into account news factors.
Everything else - position direction, lot size and stop orders - will be automatically calculated by the indicator for you. After that, you open a position, and then turn off the computer and do things that are pleasant for you.

Aleksey Ivanov
Casual Channel https://www.mql5.com/en/market/product/71806
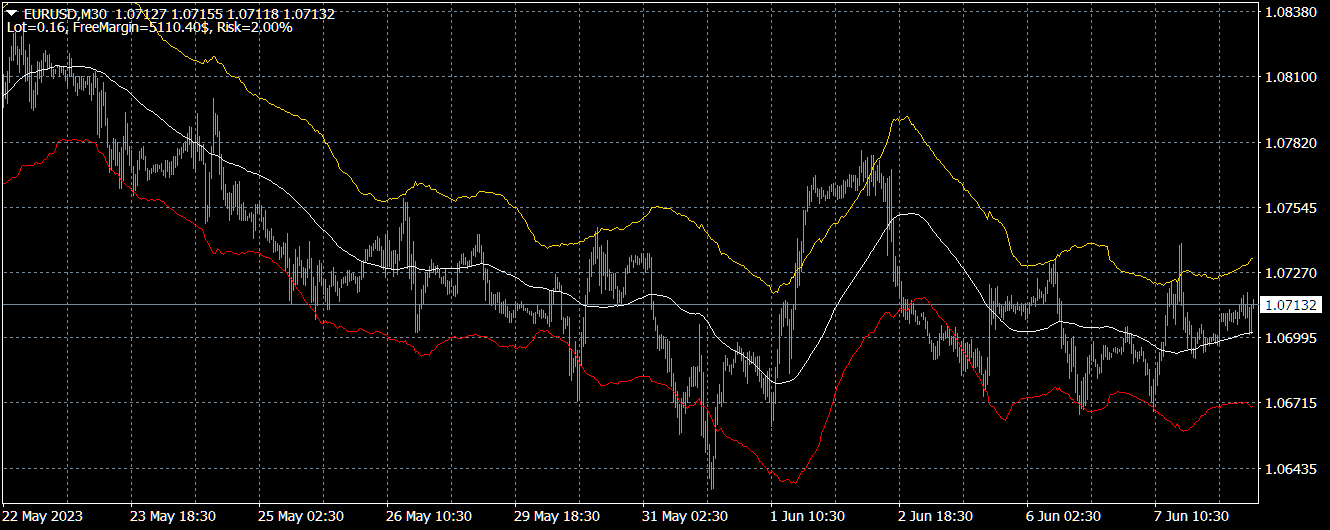
The trends that you see on the charts are not always trends or, more precisely, trends on which you can make money. The point is that there are two kinds of trends: 1) true trends that are caused by fundamental economic reasons that are stable and, therefore, can provide a reliable profit for the trader; 2) and there are false trend sections that only look like a trend and arise due to chains of random events - moving the price (mainly) in one direction. It is impossible to make money on false trends. («True and illusory currency market trends» https://www.mql5.com/en/blogs/post/740838 )
✔️Casual Channel indicator allows you to distinguish a true trend from a false one.
✔️The indicator has a built-in money management function.
✔️The algorithms of this indicator are unique and developed by their author
Author Aleksey Ivanov https://www.mql5.com/en/users/60000382

Aleksey Ivanov
MACD Extrapolator https://www.mql5.com/en/market/product/81589
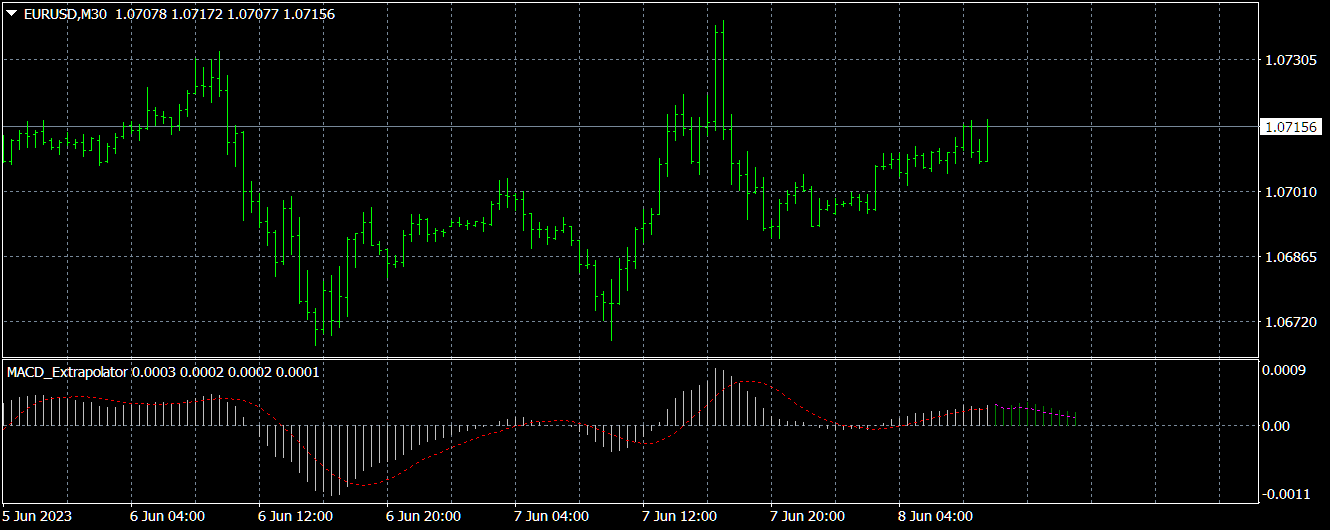
The indicator predicts the future values of the MACD indicator, which allows you to use this indicator much more efficiently.
The market has a very short memory; in any case, the information that formally describes it quickly becomes obsolete and loses its weight in the formation of the current price. Therefore, wavelet analysis is the most promising for predicting future market parameters. The author uses a number of wavelet functions (including the Morlet wavelet and a somewhat modified Gaussian function, which are shown in the last screenshot), the expansion by which, with a sufficient degree of reliability, allows extrapolating future values of oscillator indicators.
Author Aleksey Ivanov https://www.mql5.com/en/users/60000382

Aleksey Ivanov
The Multicurrency Trend Detector https://www.mql5.com/en/market/product/56194
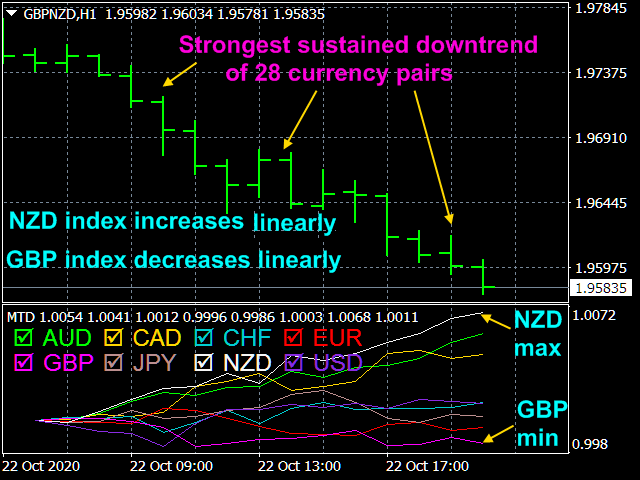
Multicurrency Trend Detector indicator allows you to immediately and on one chart on a selected time interval (extending from a zero bar to a bar set in the settings by the value horizon) determine the presence, direction and strength of trends in all major currencies, as well as assess the reliability of these trends.
Author Aleksey Ivanov https://www.mql5.com/en/users/60000382

Aleksey Ivanov
共有されたプロダクト
An extremely convenient indicator that truly makes the process of making money on the exchange easy. It is based on the scientifically rigorous theory of the market developed by the author, the beginning of which is presented here . The full algorithm of this indicator operation is presented in the article
Aleksey Ivanov
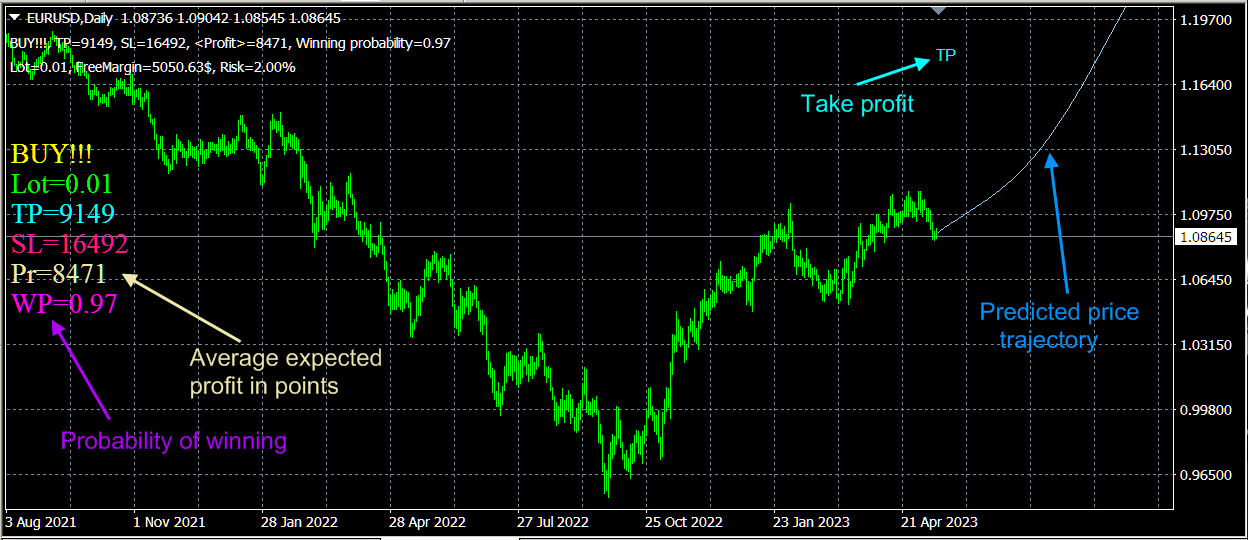
NEW!!! Extremely user-friendly indicator with the most advanced algorithms. Does all the work for the trader. Indicator with semi-automatic robot functions!!! Scientific trade https://www.mql5.com/en/market/product/98467

Aleksey Ivanov
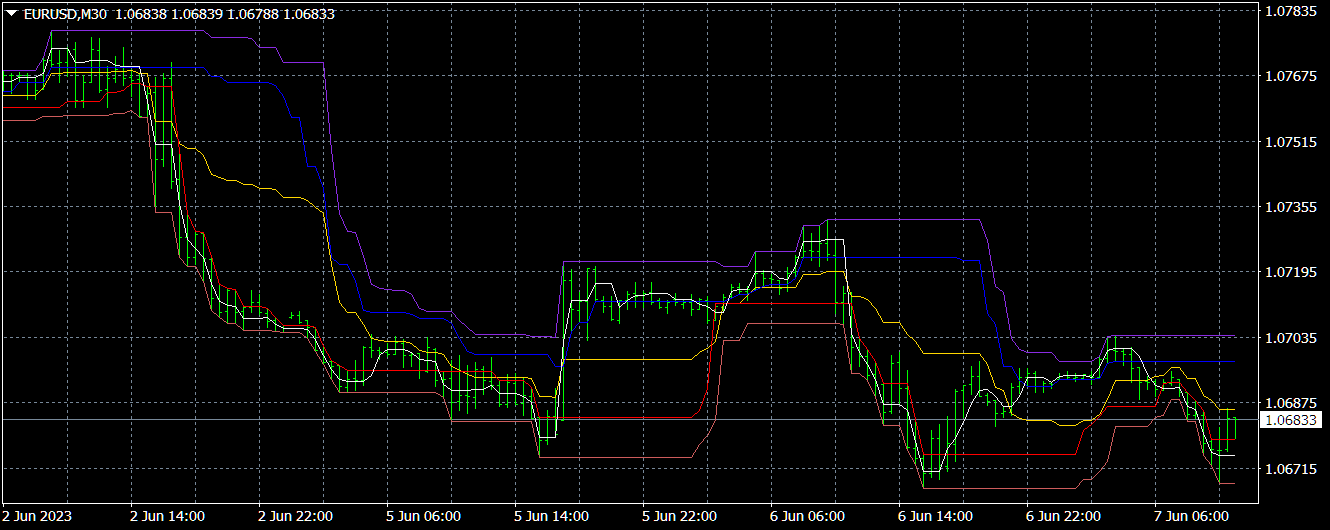
Profit Trade https://www.mql5.com/en/market/product/49806
Profit Trade is a deep development of the well-known Donchian channel indicator.
✔️ The indicator demonstrates the current state of the market in a clear and covering all characteristic price scales.
✔️The filtration used in Profit Trade is extremely robust; and this indicator does not redraw.
✔️The indicator settings are extremely simple.
✔️The algorithms of this indicator are unique and developed by their author
Author Aleksey Ivanov https://www.mql5.com/en/users/60000382

Aleksey Ivanov
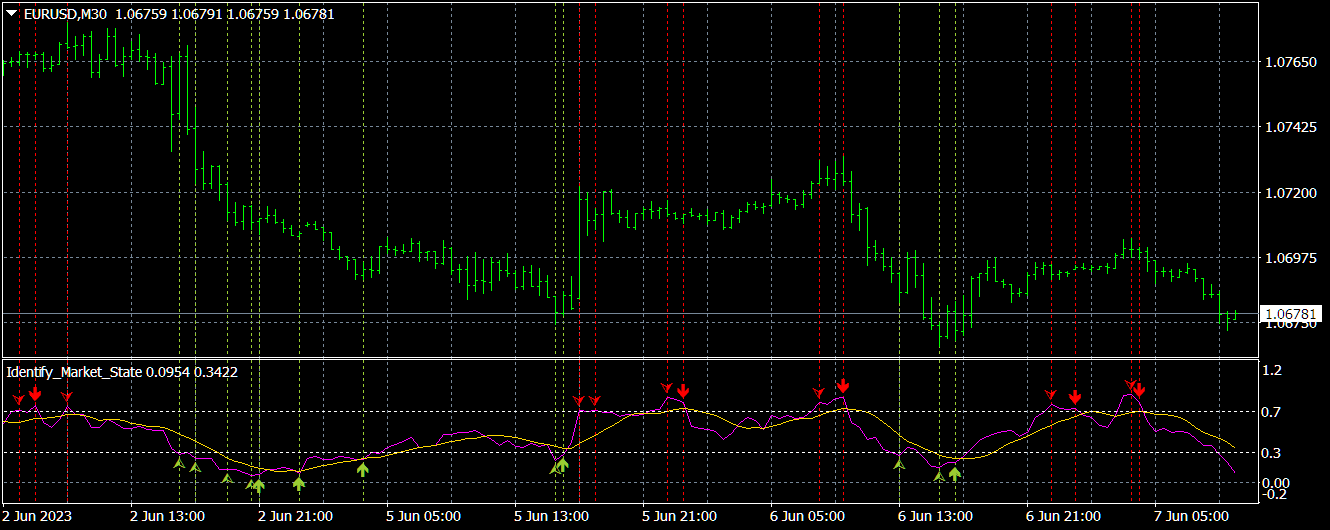
Identify Market State https://www.mql5.com/en/market/product/46028
The Identify Market State indicator allows you to set the beginning of a new trends and pullbacks on an existing trend. This indicator can be used both for trading on scalper strategies and for long-term trading strategies.
✔️ The indicator does not redraw.
✔️The indicator has all types of alerts.
✔️The algorithms of this indicator are unique and developed by their author
Author Aleksey Ivanov https://www.mql5.com/en/users/60000382

Aleksey Ivanov
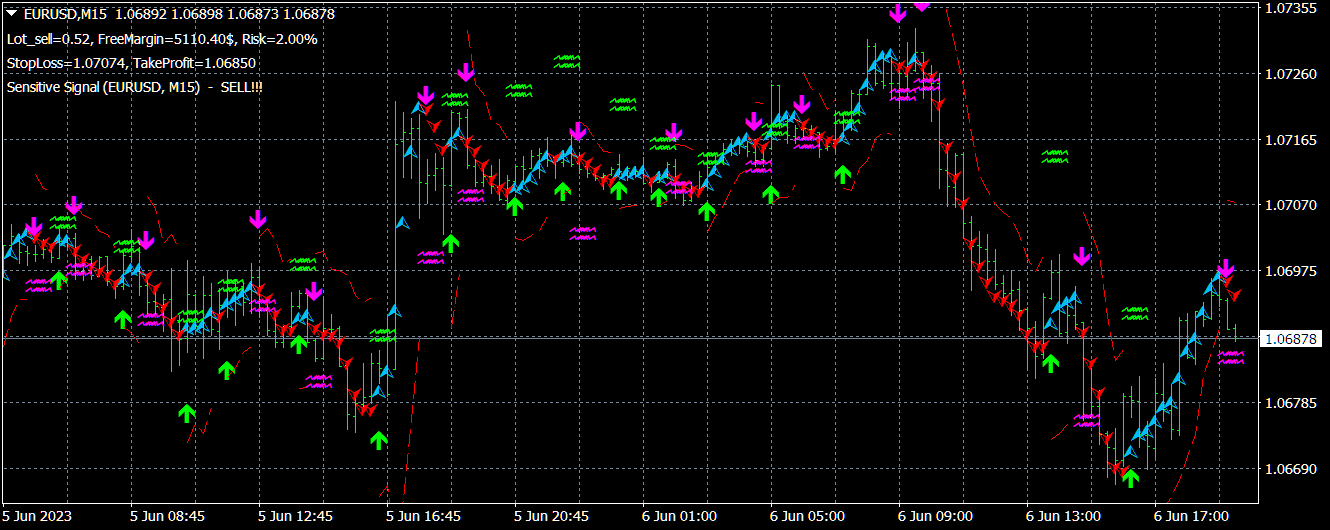
Sensitive Signal https://www.mql5.com/en/market/product/34171
✔️The most sensitive indicator with optimal market noise filtering.
✔️The best indicator for scalpers.
✔️Calculates stop loss and take profit positions.
✔️It has built-in management and all kinds of alerts.
✔️The algorithms of this indicator are unique and developed by their author
Author Aleksey Ivanov https://www.mql5.com/en/users/60000382
+ NEW!!! Extremely user-friendly indicator with the most advanced algorithms. Does all the work for the trader. Indicator with semi-automatic robot functions!!! Scientific trade https://www.mql5.com/en/market/product/98467

Aleksey Ivanov
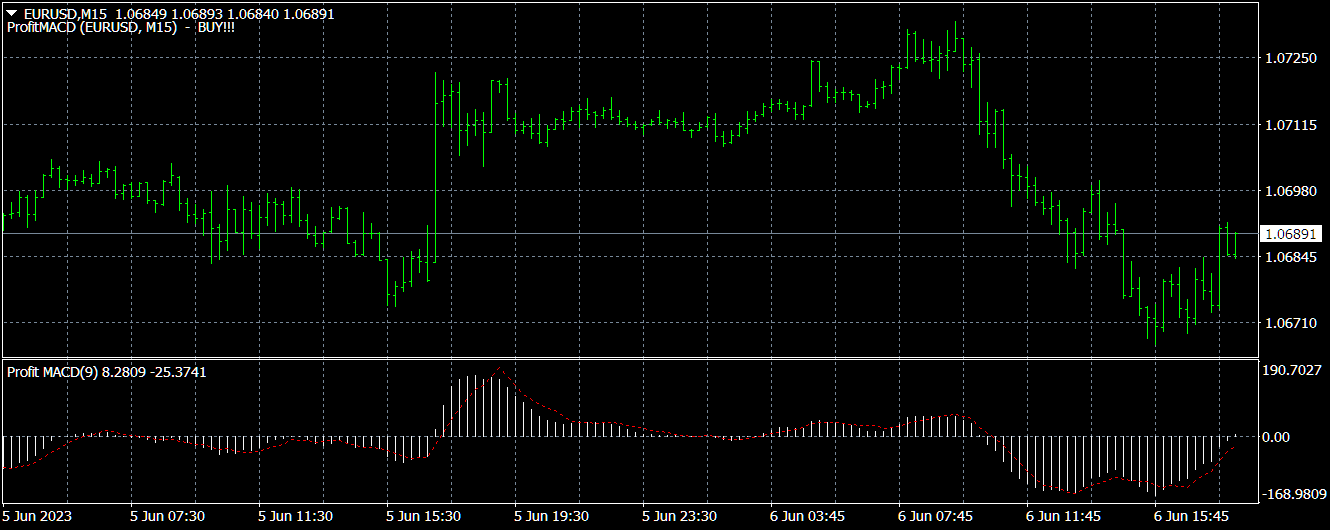
Profit MACD https://www.mql5.com/en/market/product/35659
✔️ One of my most profitable indicators with optimal filtering.
✔️The algorithms of this indicator are unique and developed by their author
✔️The indicator has all kinds of alerts.
✔️ The indicator does not redraw.
Author Aleksey Ivanov https://www.mql5.com/en/users/60000382
✔️ One of my most profitable indicators with optimal filtering.
✔️The algorithms of this indicator are unique and developed by their author
✔️The indicator has all kinds of alerts.
✔️ The indicator does not redraw.
Author Aleksey Ivanov https://www.mql5.com/en/users/60000382

Aleksey Ivanov
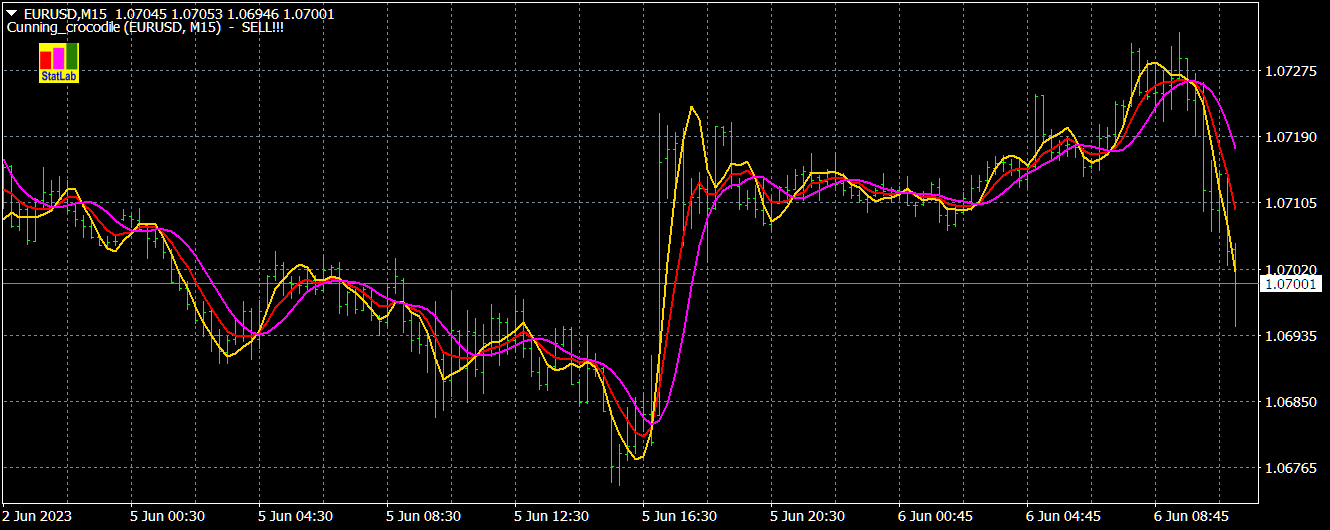
Cunning crocodile https://www.mql5.com/en/market/product/32028
✔️ One of the best indicators with optimal market noise filtering.
✔️The indicator has all kinds of alerts.
✔️ The indicator does not redraw.
✔️The algorithms of this indicator are unique and developed by their author
Author Aleksey Ivanov https://www.mql5.com/en/users/60000382
✔️ One of the best indicators with optimal market noise filtering.
✔️The indicator has all kinds of alerts.
✔️ The indicator does not redraw.
✔️The algorithms of this indicator are unique and developed by their author
Author Aleksey Ivanov https://www.mql5.com/en/users/60000382

Aleksey Ivanov
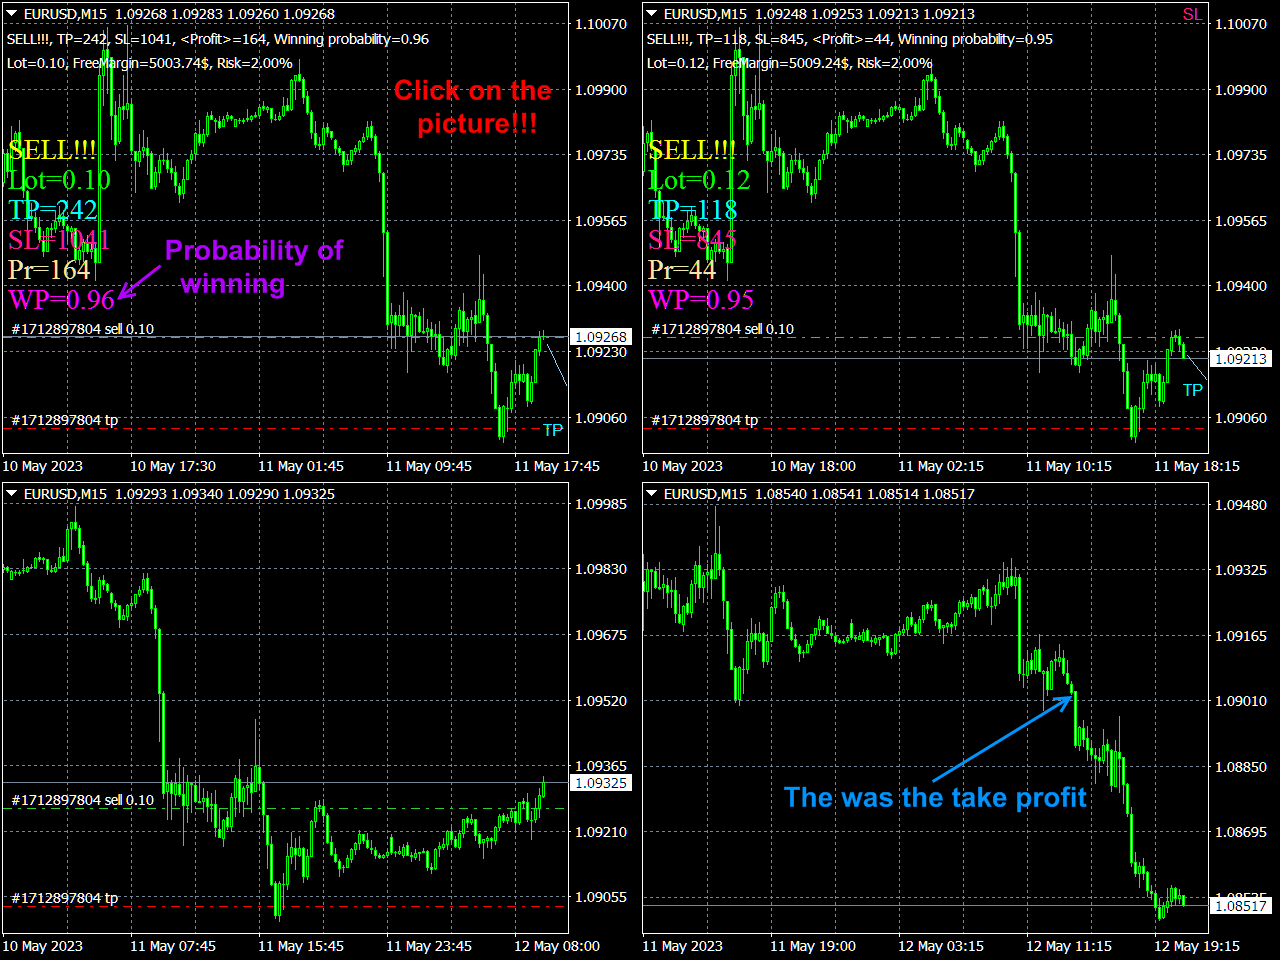
+ NEW!!! Extremely user-friendly indicator with the most advanced algorithms. Does all the work for the trader. Indicator with semi-automatic robot functions!!! Scientific trade https://www.mql5.com/en/market/product/98467

Aleksey Ivanov

StatChannel https://www.mql5.com/en/market/product/37619
StatChannel is a bolinger bands indicator with no lag.
✔️The algorithms of this indicator are unique and developed by their author
Author Aleksey Ivanov https://www.mql5.com/en/users/60000382
StatChannel is a bolinger bands indicator with no lag.
✔️The algorithms of this indicator are unique and developed by their author
Author Aleksey Ivanov https://www.mql5.com/en/users/60000382

Aleksey Ivanov
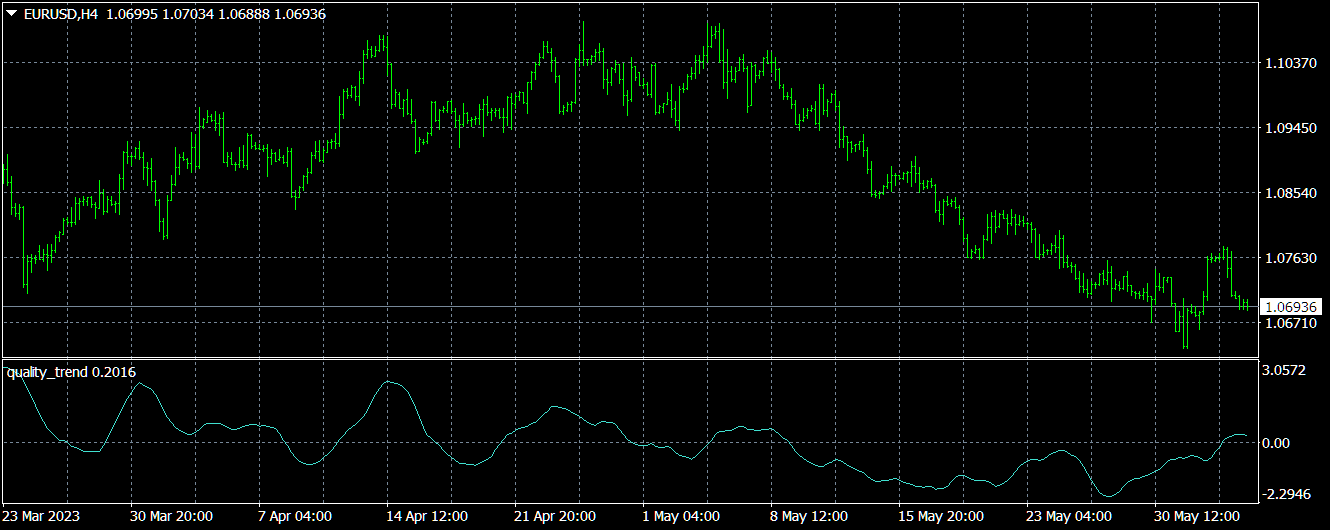
Quality trend https://www.mql5.com/en/market/product/79505
The Quality trend indicator expresses the ratio of the strength of a trend or the speed of its growth (fall) to the degree of its noisiness or a certain norm of amplitudes of chaotic fluctuations of a growing (falling) price. The position of the indicator line above zero shows an increasing trend, below zero - a falling trend, the fluctuation of the indicator line near zero shows a flat.
If the indicator line begins to fluctuate rapidly around zero and approach it, then this indicates the imminent beginning of a trend movement. Quite often, an increase in the noise of even a rapidly growing trend or an increase in volatility indicates upcoming changes in the market, in particular, the end of the corresponding trend movement. Consequently, if the readings of an indicator with a high quality factor value suddenly start to decrease, then this indicates the imminent end of the corresponding trend movement. Therefore, the indicator readings are often leading and show the near end of a trend movement with a transition to a flat or even a change in the direction of the trend movement.
✔️The indicator does not lag behind and does not redraw
✔️The algorithms of this indicator are unique and developed by their author.
Author Aleksey Ivanov https://www.mql5.com/en/users/60000382

Aleksey Ivanov
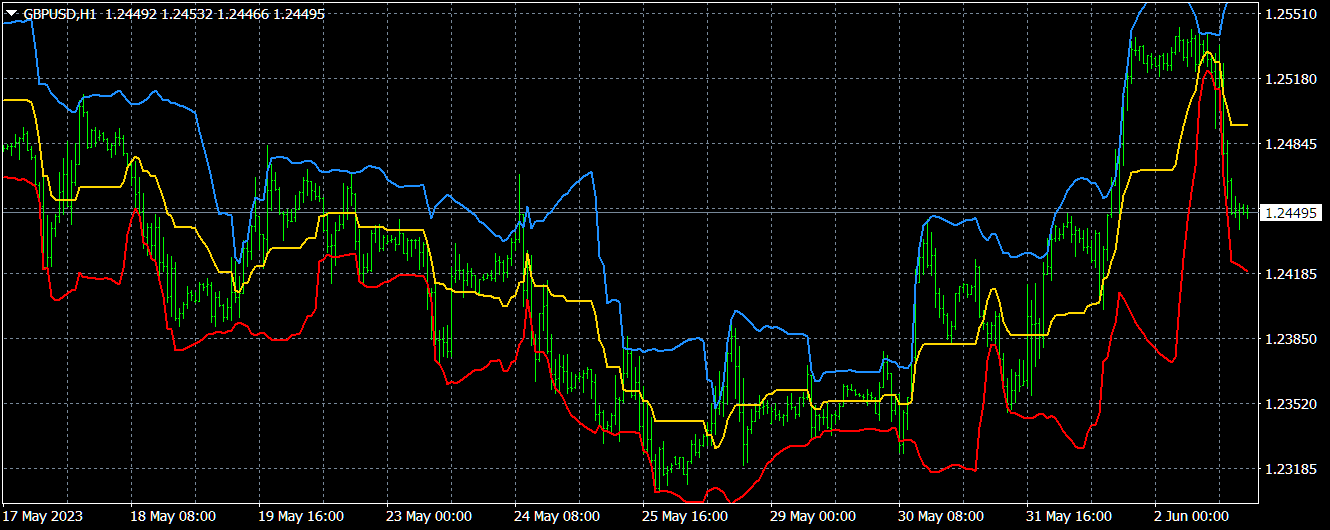
Channel Builder FREE https://www.mql5.com/en/market/product/34818
The Channel Builder (CB) or Ivanov Bands indicator is a broad generalization of the Bollinger Bands indicator. First, in CB, the mean line is calculated using various averaging algorithms. Secondly, the mean deviations calculated by Kolmogorov averaging are plotted on both sides of the middle line .
✔️The algorithms of this indicator are unique and developed by their author
Author Aleksey Ivanov https://www.mql5.com/en/users/60000382

:
