YouTubeにあるマーケットチュートリアルビデオをご覧ください
ロボットや指標を購入する
仮想ホスティングで
EAを実行
EAを実行
ロボットや指標を購入前にテストする
マーケットで収入を得る
販売のためにプロダクトをプレゼンテーションする方法
MetaTrader 5のためのエキスパートアドバイザーとインディケータ - 42

Bill's Williams Awesome Oscillator signal from his book "Trading chaos 2nd edition" on bars. Normally this signal is being used for 2nd entry after 1st entry by Divergent bar ----------------------------------------------------------------------------------------------------------- Please make shure that you understand Bill's Williams system before trade with real money using this indicator. Ideal entry setup is: 1) Divergence with zero line AO crossing 2) Divergent bar on top of the final 5th
FREE

Pivot Points are used by Forex traders to find support and resistance levels based on the previous day's price action. There are various ways to calculate pivot points, including averaging the open, high, low, and close of the previous day's chart price.
Forex Traders use a combination of pivot points with moving averages to find trading opportunities in the currency markets.
Pivot points are very useful tools that use the previous bars' highs, lows and closings to project support and re
FREE

金融指標 SolarTrade Suite: Mercury Market Indicator - 金融市場の世界で信頼できるガイドです! 私たちのFX取引プログラムには、リアルタイムで市場データを分析する強力な人工知能が搭載されています。価格変動を正確に予測し、トレーダーが情報に基づいた意思決定を行うのに役立ちます。高度なアルゴリズムを使用して、私たちのインジケーターは戦略を最適化し、リスクを最小限に抑えます。 これは、革新的で高度なアルゴリズムを使用して値を計算する移動平均であり、見た目にも美しいデザインです。
この指標の読み方を理解するのは非常に簡単です。青色 - 買い、赤色 - 売り。
色が明るいほど、シグナルが強くなります。
説明の下部にある他の SolarTrade Suite 製品をご覧ください。
投資と金融市場の世界を自信を持ってナビゲートしたいですか? SolarTrade Suite 金融指標: Mercury Market Indicator は、情報に基づいた投資決定を行い、利益を増やすのに役立つように設計された革新的なソフトウェアです。

To download MT4 version please click here . - This is vortex indicator. - It is used to detect trend strength and direction. - It consists of two line(buffers). ==> VIM and VIP - There are three types of signals related to this indicator: 1. crossing VIM and VIP 2. threshold on distance between VIP and VIM 3. VIP above VIM vice versa. - This is a non-repaint indicator with light processing.
FREE
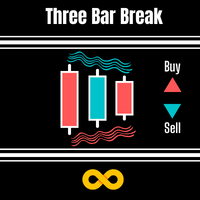
DESCRIPTION 3 Bar Break is based on one of Linda Bradford Raschke's trading methods that I have noticed is good at spotting potential future price volatility. It looks for when the previous bar's High is less than the 3rd bar's High as well as the previous bar's Low to be higher than the 3rd bar's Low. It then predicts the market might breakout to new levels within 2-3 of the next coming bars. Must also be traded during the active hours of the market you want to trade. EG EURUSD 7am - 5pm This
FREE

This script is designed for traders who need to quickly place trades across multiple currency pairs during critical news releases, where every second counts. With this tool, you can pre-select your desired currency pairs and assign independent volumes for each one. When a major news event hits, such as Non-Farm Payroll (NFP) or PMI data releases, the script allows you to execute all your trades instantly without the need to open each pair manually. Key Features: Customizable Pairs : Choose from
FREE

Normal Parabolic SAR with label of long or short state. Tells also "Parabolic long" and "short". Can be used in multitimeframe layouts together with Swiss HolyGrail indicator or in different timeframes. So, if all the indicators show "long" or "short" you can be sure that the risk of a wrong direction is small. The standard values for Parabolic SAR are 0.02 for step and 0.2 for maximum. You may experiment with changing the maximum to get smother curves. Note that changes in parabolic SAR are la
FREE

This is a trading EA on M1 Chart for currency pair GBPUSD. I don't recommend you to use in other charts or currency pairs. Backtests are performed at mt5 and my Broker is FxPro. "Works On M1 Chart"; // GBPUSD Strategy Properties Parameters are, LessOrderMoreProfitFactor_Flag = false; // Less Order More Profit Factor (trade is very rare but profit factor is high Entry_Amount = 0.01; // __Amount for a new position [lot] Take_Profit = 800; // __Take Profit [point] Stop_Loss = 650; // __Stop L
FREE

アドバイザーは、EURUSDおよびGBPUSDの2TF戦略に従って開発されました。
使用されるインジケータ:EMA(5)、EMA(10)、ADX(28)、MACD(5; 10; 4)。
購入注文のルール
EMA(高速)は、EMA(低速)を下から上に横切りました。
ADX + DI(青)上記の–DI(赤)。
MACDはゼロより上です。
売り注文のルール
EMA(高速)はEMA(低速)を上から下に横切りました。
ADX + DI(青)以下-DI(赤)。
MACDはゼロ未満です。
アドバイザーのパラメーターで、さまざまな戦略設定、インジケーター期間、サイズ、およびストップロス、損益分岐レベル、その他のパラメーターの設定方法を変更できます。
質問や提案に喜んでお答えします。
FREE

Технический индикатор Trend Moving Average позволяет определить глобальное направление рынка. Данный технический индикатор создан для того, чтобы определить «линию наименьшего сопротивления» рынка и понять в какую сторону направлен тренд. Помимо классического использования МА, индикатор позволяет понять направленность рынка на основе динамики его значений. Так, если значение индикатора демонстрируют переход с нисходящего значения в восходящее (и наоборот) - это является дополнительным торговым с
FREE

El indicador técnico conocido como Líneas de Tendencia Perfecta . Este indicador es una herramienta valiosa en el análisis técnico y se utiliza para mejorar la toma de decisiones en el trading. Aquí tienes una descripción paso a paso de cómo funciona y cómo puede ser utilizado por los traders: Identificación de Tendencias : Las líneas de tendencia perfecta se dibujan conectando dos o más puntos de precio en un gráfico, revelando así la dirección general del mercado. Una línea ascendente indica
FREE

The "YK-LOT-SIZE" is a custom indicator for MetaTrader 5 (MT5) that displays the total lot sizes and profits for both buy and sell positions on the current chart. Key features of the indicator: It calculates the total lot sizes for all open buy and sell positions of the current symbol. It calculates the total profits (including commissions and swaps) for all open buy and sell positions. The indicator displays the information on the chart using two lines of text: "BUY Lots: [total buy lots] | BUY
FREE

Indicator can be used for dxy correlation trading. it calculates the dollar index (USDX or DXY) using the EUR/USD, USD/JPY, GBP/USD, USD/CAD, USD/CHF and USD/SEK currency pairs. In order to trade them, you need to find a confirmed technical analysis pattern on the DXY chart and look for a correlated currency pair that has the same picture on its price chart.
The formula used for calculation is the following: USDX = 50.14348112 × EURUSD -0.576 × USDJPY 0.136 × GBPUSD -0.119 × USDCAD 0.09
FREE

インデックスボラティリティトレンドインジケーター。
主な特徴:
これは、同じであるBinaryまたはDerivブローカーの合成インデックスにのみ使用されます。 トレンドフィルターが付いています。 値下げの可能性を警告するサウンドアラートがあります。 あなたがそれをVPSに置くならば、それはあなたにモバイルアラートを送ることができます。 これは、効率を高めるように設計されたL566b12アルゴリズムで構成されています。
インジケーターの使い方
M1のテンポラリティで動作します。 トレンドは強いに違いありません。 シグナルキャンドルがトレンドとは異なる色で終了するのを待ちます。 次のローソク足の開始時にトレード権を入力するには、デリバティブクロックの57秒に入力します。 マルチンゲールは2つまでしか適用できません。
詳細についてはお問い合わせください:
WhatsApp: +5930962863284
購入後、このツールから最も可能性のあるメリットを得る方法について、ドライブで追加のガイドを送信

This indicator get all events/countries/values from metatrader terminal calendar and print veritical lines at chart, you can configure anything with inputs (string to filter names/url/code/countries/currencies), select period to filter, nws interval before and after current time (every information about time is seconds based), you can filter importance, type, sector, unit, multiplier, impact, timemode, frequency, forecast/previous % increase/decrease interval, actual/previous % increase/decrease
FREE

Combining the best of Price Action , Directional Movement , and Divergence / Convergence analysis, the Candle Color Trend is the easy and reliable way to identify the direction of the trend. The indicator automatically paints the candles according to the premise that the upward trend is defined by prices that form a series of ascending tops and bottoms. On the other hand, the downward trend is defined by prices that form a series of descending tops and bottoms.
Color Trend is certainly one
FREE

Lazy Scalper is fully automated, it is built based on the break-out strategy by calculate the signal from the ZigZag Indicator (strategy 01) or Fractal Indicator (strategy 02). This EA does not use any martingale or grid functions and follows a logical concept and it is suitable for both beginners and experienced people. The Backtests shown in the screenshots were done with default settings. It may not be the best or the worst. Please download the free demo to experience your own. su

This indicator provides common shapes as drawing object options. The shapes are rotatable, resizable, draggable, and will keep their proportions (according to their handle trendline) across different chart scales. Multiple drawings are supported.
Shapes: Square Rhombus
Triangle (quadrilateral & isosceles) Circle (grid, overlapped grid, flexi grid, rotatable grid, concentric circles) Features: rays (all object edges will be rays) show/hide each individual drawing type, or all delete last drawn
FREE

Visualize seu histórico de negociações de forma estruturada e detalhada, com taxas de acertos e lucro separados por dia, semana, mês e total, além de detalhes sobre o ativo, horário do servidor e posições/ordens em andamento. Este painel foi criado visando o uso em contas do tipo HEDGE, porém pode ser utilizado em contas do tipo NETTING sem nenhum problema. Na versão PREMIUM deste Painel você tem opção de utilizar uma micro boleta com botões para facilitar o tratamento e execução de ordens em an
FREE
Tick Chart Monitor with countdown tick volume and easy to change tick size without going back to main chart. This work with Tick Chart Generator , which are available for download from the MQL5 Market: Tick chart generator: https://www.mql5.com/en/market/product/79763 NOTE: Custom symbols on MT5 are not directly tradable. This is by Metatrader5 design. If you want to place trades directly on the custom symbol generated by this product, you will either need a trade panel that offers this functi
FREE

This indicator displays the spread with extra options Simple and easy to use and fully customisable: View as Pips or Pipettes Chart symbol can be hidden Text display can be changed Change colour and text styles Add or hide a decimal point Spacing options between inputs Default screen positions Screen position inputs
Pro version includes: Drag and drop box on the screen Add an alert when the spread is too high Alert colours for text and text box changeable
How to use 1. Simply use the defaul
FREE

SterlingSniperBot is an advanced trading algorithm meticulously designed for the GBP/USD currency pair, specifically tailored to operate on 4-hour bars and synchronize seamlessly with brokers in the UTC+2 time zone. This sophisticated bot stands out as a precision instrument in the world of forex trading. Key Features: Timeframe Optimization: Operating exclusively on 4-hour bars, SterlingSniperBot focuses on capturing strategic trading opportunities within this specific time frame, aligning with
FREE

A flexible BB indicator You're no longer limited to the built in default of using BB off a SMA method, now you can choose from: SMA - SMMA - EMA - LWMA - ADAPTIVE - FRACTAL ADAPTIVE - DEMA - TEMA - VARIABLE INDEX DYNAMIC
You now also have 2 standard deviation levels. A more featured version is available with 5 deviation levels, color gradients to lines and filling as well as candles, with full alerts too: Bollinger Bands Max MT5
Options: - MTF - 9 choices of MA to base the BB off
- 2 adjust
FREE

This is a utility panel to assist closing of open Deals. The panel has input filters to assist one select the right trades. The tool displays the number of trades to be closed as well as profits to be realized. One click close, Filter trades to be closed by: symbol, (Filter by a particular symbol in the trade terminal). magic number (If your orders are from particular EA with unique magic numbers). whether in profit, loss or All. (P/L=all trades, profiting = trades in profit, loosing = trades
FREE

Live Monitoring: https://www.mql5.com/en/signals/2252642 Quant ML US30 is a bot designed for Dow Jones index-related instruments, operating on the H1 timeframe. It supports: .US30Cash CFD YMMxx, YMUxx futures Any instrument with an underlying Dow Jones Industrial Average index (exact names may vary by broker). This bot is generated and validated by machine learning algorithms, focusing on strategy stability. It: Uses only market entries with fixed ATR-based SL and TP levels. Does not use tr
FREE

TickAll - Automated Trading Robot
Introduction: TickAll is an automated trading robot designed to assist both novice traders and professional traders in the Forex market. Utilizing advanced algorithms and up-to-date market analysis, TickAll helps you make the best trading decisions. Market Analysis: TickAll continuously monitors the market, analyzing various indicators, price movements, and patterns to identify potential trading opportunities. Trend Identification: Using so
FREE

Indicator that show candlestick bars with an different sampling method than time fixed. Real time data is sourced to the indicator and it may be used as substitute of the default graph. Each bar is formed when a predefined volume of assets was dealt, showing in the graph the OHLC of this clustering. The amount of bars is proportional to the amount of negotiations instead of a sample in a fixed amount of time. If the broker doesn't show the real volume of the trades, this indicator won't work. Th
FREE

This script allows performing a walk-forward analysis of trading experts based on the data collected by the WalkForwardLight MT5 library. The script builds a cluster walk forward report and rolling walk forward reports that refine it, in the form of a single HTML page. This script is optional, as the library automatically generates the report immediate after the optimization in the tester is complete. However, the script is convenient because it allows using the same collected data to rebuild th
FREE

高精度の取引と市場全体のために設計されたスリッページ分析 ライブ口座とデモ口座の両方で機能し、テイク プロフィットとストップ ロスを使用してすべてのポジションを分析できるため、ブローカーのスリッページを分析できます。
取引におけるスリッページとは? スリッページまたはスライディングは、取引注文が出された瞬間と市場での実際の実行との間に発生する可能性がある価格の差です。
これは、注文が取引プラットフォームで発注され、市場で実行されてから、価格が変動する可能性がある非常に短い期間があるためです。
この要求価格と最終的に得られる価格の間の値動きがスリッページです。
私の他の開発はここで見ることができます
テイクプロフィットとストップロスですべてのポジションを使用して、すべてを正確に識別できるようにすることをお勧めします
サポートが必要な場合は、購入後すぐに連絡してください
着信パラメータ -
3つの高度な構成があります -構成モード 1 時間分析 -構成モード 2 平均化モード -構成モード 3 スリッページの分析
多くの場合、スライドするオ
FREE

Donchian通道(唐奇安通道指标)是用于交易突破的最古老、最简单的技术指标之一。 一般来说,唐奇安通道的宽度越宽,市场波动就越大,而唐奇安通道越窄,市场波动性也就越小 。此外,价格走势可以穿过布林带,但你看不到唐奇安通道的这种特征,因为其波段正在测量特定时期的最高价和最低价。 交易实用必备工具指标 波浪自动计算指标,通道趋势交易 完美的趋势-波浪自动计算通道计算 , MT4版本 完美的趋势-波浪自动计算通道计算 , MT5版本 本地跟单复制交易 Easy And Fast Copy , MT4版本 Easy And Fast Copy , MT5版本 本地跟单复制交易 模拟试用 Easy And Fast Copy , MT4 模拟账号运行 Easy And Fast Copy , MT5 模拟账号运行 唐奇安通道指标计算: 唐奇安上阻力线 - 由过去N天的当日最高价的最大值形成。 唐奇安下支撑线 - 由过去N天的当日最低价的最小值形成。 中心线 - (上线 + 下线)/ 2 唐奇安通道信号 唐奇安通道常用作突破指标。它提供了两种主要类型的突破信号,一个是上阻力线或下支
FREE
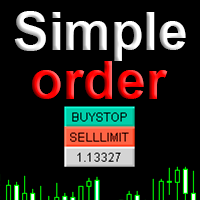
Simple order is designed to make placing pending orders as easy and fast as possible. Setting a pending order takes just two steps. 1. Double-click on the price of placing an order, after that a panel with buttons for order names appears. 2. Click on the button of the required order That's it, the pending order is set. If necessary, we adjust the order by dragging, as well as change the sizes of stop loss and take profit. Don't forget to pre-set the size of the stop loss and take profit in the S
FREE

For those who feel that regular RSI is too fast and too noisy to be used on regular trades or in EAs and want to have an alternative to meter the Momentum of the Price, here is a solution presented on the great article of the Technical Analysis of Stocks & Commodities magazine (April, 2015), by Vitali Apirine, called: Slow Relative Strenght Index . Its reading is almost the same as the regular RSI, but its levels of Overbought and Oversold are 80 and 20 instead. SRSI is very powerful to show div
FREE
Reverse TradeCopier for Followers can copy trades from an account that is running Reverse TradeCopier for Source . Features: Copies trades from one source (master) account to multiple following (slave) accounts. Allow investor (read only) password for source (master) account. There are no complicated settings and input parameters, everything is easy. Works with different brokers. Works with different quotes symbols (EURUSD_FX, eurusd_m, etc.). Can copy orders from 4-digit quotes platform to 5-
FREE

You probably heard about Candlesticks behaviors, which in most of the times could denote and trace Volume behaviors even if you are not watching Volume itself... Well, this indicator will do this. Naked traders love to rely solely on candlesticks patterns and with Candle Zones you can trap special patterns and DRAW THEM on your chart. As simple as that. There are several filters you can tweak in order to achieve the analysis you want. Just give it a try. After several months of testing, we think
FREE

The Expert Advisor tool has been developed for Nasdaq, based on Vortex and pending orders. The stop loss is based on fixed pips. It has been backtested on more than 10-year long M1 data with high quality of modeling. The enclosed screenshots demonstrate the complexity and coverage of the test by Monte Carlo analysis with 200 simulations. T he Expert Advisor passed via Cluster Analysis, Optimization profile, System parameter Permutation. There is no need to set up parameters - all settings are al
FREE

Investment Castle Volatility Index has the following features: 1. This indicator shows the volumes of the current symbol and the market volatility. 2. This indicator is built-in in the Investment Castle EA which works as volatility index for the EA dynamic distance and opposite start. 3. Parameters available for optimization for each pairs. 4. Works with any chart.
FREE

This is an indicator of trading sessions that can display all levels (Open-High-Low-Close) for four sessions . The indicator can also predict session levels. Sessions can be drawn with lines or rectangles (empty or filled), lines can be extended to the next session. You can easily hide/show each session by pressing hotkeys (by default '1', '2', '3', '4'). You can see ASR (Average Session Range) lines (default hotkey 'A'). This is similar to the ADR calculation, only it is calculated based on

Description The Profit and Loss Indicator by Creative Tech Solutions is a robust and comprehensive tool designed to help traders monitor their trading performance in real-time. This indicator provides detailed metrics on profits and drawdowns, ensuring traders are always informed about their trading activities and performance. With customisable alerts and display settings, this indicator is an essential tool for any serious trader. Features Real-Time Metrics : Monitor profit and drawdown percent
FREE

Free version. Only works on EURUSD Do you want to always know in a quick glance where price is going? Are you tired of looking back and forth between different timeframes to understand that? This indicator might just be what you were looking for. Trend Signal Multitimeframe shows you if the current price is higher or lower than N. candles ago, on the various timeframes. It also displays how many pips higher or lower current price is compared to N. candles ago. Number N. is customizable The data
FREE

Certainly. Here's the explanation in English: This program is a custom indicator that calculates the MACD (Moving Average Convergence Divergence) and shows the crossovers between the MACD and Signal lines. Here are the main functions of the program: MACD Calculation: Calculates the difference between the Fast EMA (Exponential Moving Average) and Slow EMA. This difference forms the MACD line. Signal Line Calculation: Creates the Signal line by taking a simple moving average (SMA) of the MACD valu

Помощник для торговой системы SystZ . Чертит трендовые линии по соседним экстремумам зигзага. Условие для линии сопротивления - правый должен быть ниже левого. Для линии поддержки - правый выше левого. Не допускается, чтобы между экстремумами, по которым проводится трендовая линии были другие. Экстремумы, удовлетворяющие этим условиям, отмечены символом фрактала. Закрытие свечи за линией - сигнал для открытия позиции.
FREE

The DD_PL Running MT5 indicator is a trading tool developed by the Dagangduit Core Team . This indicator is designed to display real-time running profit and loss (P/L), providing essential information about your trading account's performance. Key Features: Real-Time P/L Monitoring : Calculates and displays profit and loss in real-time. Visual Indicator : Uses labels and colors to provide a visual representation of profit and loss status. Customizable Display : Allows adjustment of text color, b
FREE

ПОСМОТРИТЕ НАШ НОВЫЙ СОВЕТНИК : : https://www.mql5.com/ru/market/product/95095?source=Unknown#description
Индикатор отображает свечи заданного старшего таймфрейма, на меньших таймфреймах TF_Bar - выбор старшего таймфрейма, на основе которого будут отображаться свечи на текущем; Number_of_Bars - предельное число баров, до которого будет производиться расчет индикатора; Color_Up - цветовое отображение бычьих свечей; Color_Down - цветовое отображение медвежьих свечей; Widht_lines - то
FREE

A script for closing positions If you need to quickly close several positions, this script will make all the routine for you! The script does not have any input parameters. Allow AutoTrading before running the script. Usage:
Run the script on a chart. If you need to specify the maximal deviation and the number of attempts to close positions, use the script with input parameters https://www.mql5.com/en/market/product/625 You can download MetaTrader 4 version here: https://www.mql5.com/en/market
FREE
Traders Club Clock for MT5 Readme
ローソク足のすぐ横にその時間足での 残り時間とスプレッドを表示します。 ※残り時間はサーバ時間から計算しています。 月足、週足、日足、4時間足、1時間足、30分足、15分足、5分足、1分足
で表示可能となっております。
※スプレッド値ポイント単位での表示になります。
※時間の更新はティック毎ではなく1秒 毎 に更新するようにしています。
一目で残り時間とスプレッドを確認できます。 機能: 使用しているフォント種類を変更できます。 使用しているフォントサイズを変更できます。 表示しているテキストの色を変更できます。 スプレッド表示を非表示にすることができます。 表示する位置を変更することが出来ます。
FREE

Tokyo Session Box Indicator : Draw a box of Tokyo session. Inputs tutorial: 1. Automatic: true/false. To calculate box automatic base GMT. 2. Broker time zone: if Automatic is False, you have to define broker time zone (ex: 2 ) 3. Button ON/OFF properties: x, y, corner, color, background fill, width, height, font name, font size. This button will toggle showing or hiding Tokyo session box.
FREE

Volume Cross Over is an indicator that measure positive and negative volume flow in a financial instrument, such as a stock, commodity, or index. It is base on the idea of On-Balance Volume developed by Joseph Granville. However instead of trending lines, this indicator shows volume cross over. When the closing price of an asset is higher than the previous closing price, then the Bull volume is greater than zero and Bear volume is negative. It suggests that buying volume is dominating, and
FREE

'Circle Rising Point' is an indicator based on the cycle theory. No matter whether your trading cycle is short or long, you can use this indicator to find the rise and fall points of different cycles and different bands. Therefore, the signals displayed to you on charts of different cycles are different, and applicable to left side transactions. This indicator is recommended to be used together with the multi cycle window for analysis. Indicator introduction Applicable products This indicator is
FREE

The Moving Averages On-Off let you control the indicator using the keyboard or a button . You can choose if you want the indicator always shown or always hided while switching among different time frames or financial instruments . ---> This indicator is part of Combo Indicator OnOff
It's possible to setup three Moving Averages : Short , Medium , Long
Input You can customize the price type used for calculation : close, open, high, low, median price, typical price, weighted It
FREE

Indicator that allows the maximum and minimum of days to be marked, with real time update, closing of the previous day and beginning of the day. It is possible to define which markings will be made and also the colors for each mark. The values of each tick are displayed in the upper left corner of the screen, below the trading panel within the chart. Maximum and Minimum of the Day and Closing of the Previous Day are marked with a horizontal line, while the beginning of the day with a
FREE

The indicator draws a normal chart by coloring it in colors based on prices calculated by the Heiken Ashi indicator algorithm.
That is, the shape of the candles does not change.
In fact, this is the same Heiken Ashi that does not distort the price chart.
Then there will be a drawing of a cat, because there is nothing more to write about the indicator. .
FREE

Manage your prop firm challenges with Raba Challenge Manager EA (FTMO, Rocket21, etc...). Functionalities: Close all positions when the goal profit is reached. Close all positions before reaching the daily drawdown limit. Close all positions before reaching the total drawdown limit. Notes: Auto enabling/disabling algo trading is disabled due to MQL Market policies.
I you have any doubt you can leave it in comments and I will anwer it asap. If you found this tool helpful for you, a comment a
FREE

Indicator Description: FVG Imbalance Zones The FVG Imbalance Zones indicator is a powerful tool designed to identify potential price imbalances on financial charts. Developed by Pierre-Alexis Blond, this innovative indicator marks regions where significant price shifts may occur, offering traders valuable insights into potential market turning points. Key Features: Imbalance Detection: FVG Imbalance Zones identifies potential price imbalances in the market, pinpointing areas where supply and d

(Google 翻訳) この指標は、 John Welles Wilder Jr. によって開発されたオリジナルの「 Average True Range (ATR) 」を実装しています。 テクニカル トレーディング システムにおける新しい コンセプト[1978] . 単純移動平均 (SMA) の代わりに、 平滑移動平均 (SMMA) とも呼ばれる ワイルダーの移動平均 を使用します。 MetaTrader の組み込み ATR インジケーターで使用されます。 彼の本の説明によると、適用されるデフォルトの期間は 14 ではなく 7 です。 (Original text) This indicator implements the original “ Average True Range (ATR) ” developed by John Welles Wilder Jr. , as described in his book— New Concepts in Technical Trading Systems [1978] . It uses Wilder’s moving avera
FREE

Live Monitoring: https://www.mql5.com/en/signals/2252642 Quant ML US100 is a bot designed for NASDAQ index-related instruments, operating on the H1 timeframe. It supports: .USTECHCash CFD NQMxx futures Any instrument with an underlying NASDAQ index (exact names may vary by broker). This bot is generated and validated by machine learning algorithms, focusing on strategy stability. It: Uses only market entries with fixed ATR-based SL and TP levels. Does not use trailing stops, breakevens, mar
FREE

The 4xtradingllc Panel allows you to enter sells and buys in a quick manner as well as close all trades at once. The panel also has a account protector that will close all trades once the protector has been hit.
You can attached this utility to most indicators and combine the two to have your indicator fully functioning as well as the panel to buy sell and close trades quickly and protect the account from losing X percentage.
MAKE SURE TO JOIN OUR DISCORD SERVER FOR FULL TRAININGS. DISCORD
FREE

There are thousands, if not millions, of strategies on the internet, but only less than 10% work and of those even less have stood the test of time. Very few strategies have successfully weathered the 2008-2009 financial crisis, 2020 covid effects on the markets and all other unforeseen events that have affected the market in the last 2 decades. That being said, the strategy I feature in this episode does just that, the epitome of stability as I’ll show in a 20 year back-test.
The source of
FREE
The Tick Flow Meter, also known as Tick Density Meter or Tick Counter, is an innovative indicator designed to provide deep insights into market dynamics down to the second.
It is a cutting-edge indicator crafted to measure the intensity and frequency of ticks within specific time intervals. By focusing on tick flow, this indicator offers traders a unique perspective on market liquidity, momentum, and volatility, empowering them to make informed trading decisions.
Key Features: Granular Tim
FREE

A countdown timer for the Volume bar chart generator and Tick chart generator products, which are available for download from the MQL5 Market: Tick chart generator: https://www.mql5.com/en/market/product/29215 Volume bar chart generator: https://www.mql5.com/en/market/product/47197
The counter conveniently displays the number of ticks or transactions (depending on the chart) that need to pass for a new bar to start printing.
The user can set the following indicator inputs.
Volume type
FREE

The DuettoFXTompson indicator is designed to work with two instruments that have a high level of correlation. the indicator can be used for pair trading on currencies, stocks, and other financial instruments. The indicator shows the moment when the instruments diverge and the sum of the two instruments (yellow line). additionally, the parameter of the Average MA value is calculated.
Recommended timeframe for M5 operation. Contacts for communication 777basil@mail.ru we will prepare an expert, a
FREE

This algorithm is based on the grid strategy and performs dynamic position management to make it work on netting accounts. Unlike other robots, this grid system bases its entries on profit over time of the asset instead of using pips. This parameter is the one that corresponds to "Average Distance".
You can trade all 28 major currencies simultaneously. Parameters: +------------------------------------------------------------------+ :-:-:-:-:-:-:-:EXPERT SETTINGS:-:-:-:-:-:-:-: +--------------

Multi-timeframe trend indicator based on the ADX / ADXWilder indicator with Fibonacci levels
The indicator shows trend areas using ADX or ADXWilder indicator data from multiple timeframes. The impulse mode of the indicator allows you to catch the beginning of a trend, and several "Screens" with different timeframes allow you to filter out market noise. Fibonacci levels are added to the price chart, which have flexible settings.
How the indicator works: if PDI is greater than NDI, then it`
FREE

SuperMax MT5 is a fully automated, intelligent expert advisor with advanced mechanisms, using a dynamic system to measure market volatility to be consistent with the timing of market entry and exit. The mechanism of this system is based on the principle of mean reversion and momentum of market price. Rely on scalping and recovery strategies with optimal trading frequency and can still work well in all market conditions, be it trend or sideways, can be traded full time in any condition. This EA

This indicator can identify more than 60 candlestick patterns on the chart, including their bullish and bearish variants. Just choose the pattern you want in the settings.
Available Patterns 2 Crows Gravestone Doji On Neck 3 Black Crows Hammer Piercing 3 Inside Hanging Man Rick Shawman 3 Line Strike Harami Rising and Falling Three Method 3 Outside Harami Cross Separating Lines 3 Stars in South High Wave Shooting Star 3 White Soldiers Hikkake Short Line Abandoned Baby Hikkake Modified Spinning

Expert using Moving Average (Configurable), RSI entry points and Bollinger Bands (not configurable [yet]).
You can decide if you want to use the Moving Average with or without Bollinger Bands and you can turn on/off the RSI also for entry/exit points.
You can also turn on/off the Double Hand Feature where every entry/exit the trade will be in double, which means, selling and buying at the same time.
FREE
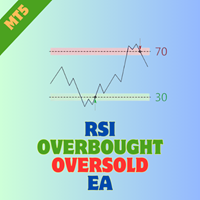
RSI Trader Expert Advisor for MetaTrader 5 Introduction: Welcome to the RSI Trader EA, an advanced tool designed exclusively for MetaTrader 5. This expert advisor streamlines trading activities by harnessing the power of the Relative Strength Index (RSI) indicator, automating trade entries and exits based on overbought and oversold conditions. The EA also facilitates reverse trading setups within these zones, offering a versatile approach to managing trades. You can find MT4 version here For det

金融指標 SolarTrade Suite: Pluto Market Indicator - 金融市場の世界で信頼できるガイド!
これは、特別な革新的で高度なアルゴリズムを使用して値を計算するボラティリティ オシレーターであり、見栄えの良いデザインも備えています。
このインジケーターの読み取り値を理解するのは非常に簡単です。緑色 - ボラティリティが低く、取引を開始するのに最適な時期、オレンジ色 - ボラティリティが高く、取引ポジションのクローズを検討する時期。
色が明るいほど、信号が強くなります。
利便性のために、このインジケーターのウィンドウをクリックして信号を反転することができます。
説明の下部にある他の SolarTrade Suite 製品をご覧ください。
投資と金融市場の世界を自信を持ってナビゲートしたいですか? SolarTrade Suite 金融指標: Pluto Market Indicator は、情報に基づいた投資決定を行い、利益を増やすのに役立つように設計された革新的なソフトウェアです。
SolarTrade Suite 金融指

このインジケーターは、同じチャート上で追跡したい他の時間枠のローソク足を効率的に追跡します。
1. 同じチャートにバーをロードするには、より高い時間枠を選択します
2.ローソク足の色とスタイルをカスタマイズする
3. ローソク足を描画するバーの数を選択します
4. 芯と本体とともにより高いタイムフレームの完全なキャンドルを追跡する
5. チャートを切り替えたくない人にとっては簡単で便利です。
このインジケーターは、同じチャート上で追跡したい他の時間枠のローソク足を効率的に追跡します。
1. 同じチャートにバーをロードするには、より高い時間枠を選択します
2.ローソク足の色とスタイルをカスタマイズする
3. ローソク足を描画するバーの数を選択します
4. 芯と本体とともにより高いタイムフレームの完全なキャンドルを追跡する
5. チャートを切り替えたくない人にとっては簡単で便利です。

Injikētā wa, torihiki būmu to kurasshu ni shiyō sa re, sūpātorendo tanteidesu. Ichiba ga jōshō torendo no toki wa tsuyoi shigunaru o shiyō shite supaiku o kyatchi shi, kakō torendo no toki wa tsūjō no shigunaru o shiyō shite yori ōku no supaiku o kyatchi shimasu. Indikēta wa, ikutsu ka no sūgaku-teki rojikku o sonaeta honshitsu-teki ni puraisu akushon bēsudesu. Supaiku o kyatchi suru tame dake ni shiyō sa remasu. Indikēta wa ika no shutsuryoku o motte imasu 1. Tsuyoi shingō 2. Tsūjō no shingō 3.

マルチタイムフレーム移動平均 OSW
(メタトレーダー5)
このインジケーターを使用すると、すべてのタイプの構成の移動平均を追加できますが、時間枠にいる場合は、より高いレベルの移動平均を追加できるという違いがあります。たとえば、5 分の時間枠にいる場合です。 15 分、1 時間、4 時間の一時性の 20 の移動平均指数を見たい場合は、インジケーター メニューで正しいパラメーターを構成するだけで、インジケーターの画像に示されているようにそれらを見ることができます。
マルチタイムフレーム移動平均 OSW
(メタトレーダー5)
このインジケーターを使用すると、すべてのタイプの構成の移動平均を追加できますが、時間枠にいる場合は、より高いレベルの移動平均を追加できるという違いがあります。たとえば、5 分の時間枠にいる場合です。 15 分、1 時間、4 時間の一時性の 20 の移動平均指数を見たい場合は、インジケーター メニューで正しいパラメーターを構成するだけで、インジケーターの画像に示されているようにそれらを見ることができます。
MetaTraderマーケットは自動売買ロボットとテクニカル指標を販売するための最もいい場所です。
魅力的なデザインと説明を備えたMetaTraderプラットフォーム用アプリを開発するだけでいいのです。マーケットでプロダクトをパブリッシュして何百万ものMetaTraderユーザーに提供する方法をご覧ください。
取引の機会を逃しています。
- 無料取引アプリ
- 8千を超えるシグナルをコピー
- 金融ニュースで金融マーケットを探索
新規登録
ログイン