Guarda i video tutorial del Market su YouTube
Come acquistare un Robot di Trading o un indicatore
Esegui il tuo EA
hosting virtuale
hosting virtuale
Prova un indicatore/robot di trading prima di acquistarlo
Vuoi guadagnare nel Market?
Come presentare un prodotto per venderlo con successo
Expert Advisors e Indicatori per MetaTrader 5 - 42

Key Features: Robust Algorithm: Based on John F. Ehlers’ renowned Fisher Transform formula, our indicator excels in pinpointing major price shifts, facilitating more informed trading decisions. Versatile Application: Works seamlessly with any asset, including forex, stocks, commodities, and indices, offering wide-ranging applicability for diverse trading strategies. Customizable Settings: Tailor the indicator to your trading style with adjustable parameters, including the transformation length,
FREE
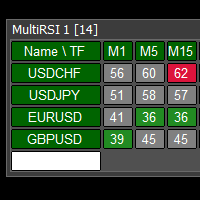
This tool monitors RSI indicators on all time frames in the selected markets. Displays a table with signals to open a BUY trade (green) or SELL trade (red). You can set the conditions for the signal. You can easily add or delete market names / symbols. If the conditions for opening a trade on multiple time frames are met, you can be notified by e-mail or phone message (according to the settings in MT5 menu Tools - Options…) You can also set the conditions for sending notifications. The list of s

This tool monitors MACD indicators on all time frames in the selected markets. Displays a table with signals to open a BUY trade (green) or SELL trade (red). You can set the conditions for the signal. You can easily add or delete market names / symbols. If the conditions for opening a trade on multiple time frames are met, you can be notified by e-mail or phone message (according to the settings in MT5 menu Tools - Options…) You can also set the conditions for sending notifications. The list of

Investment Castle Volatility Index has the following features: 1. This indicator shows the volumes of the current symbol and the market volatility. 2. This indicator is built-in in the Investment Castle EA which works as volatility index for the EA dynamic distance and opposite start. 3. Parameters available for optimization for each pairs. 4. Works with any chart.
FREE

A simple tick indicator of Bid and Ask prices. The period separator (1 minute) is displayed as a histogram. Parameters Show Bid Line - show/hide the Bid line; Show Ask Line - show/hide the Ask line; Show Labels - show/hide the last price values.
FREE

The DD_Profit_Monitor MT5 indicator is a trading tool developed by the Dagangduit Core Team . This indicator is designed to monitor profits in real-time with the following key features: All Time Profit : Displays the total profit earned since the beginning of the trading account's usage. This feature helps traders see the overall performance of their trading activities. Daily Profit : Displays daily profits, allowing traders to monitor their daily performance more specifically. Key Features: Al
FREE
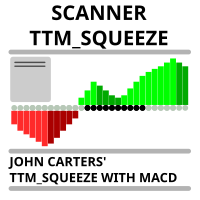
Market scanner based on the indicator published here Download the 'John Carters TTM Squeeze with MACD' Technical Indicator for MetaTrader 5 in MetaTrader Market (mql5.com) . Only the instruments that are in the Market Watch window are scanned. Maximum number of scanning tools up to 5000. The scan timeframe is selected from the timeframe panel of the terminal. To use it, open any chart and attach the Expert Advisor to the chart, the 'Search' button will appear in the upper left corner. When you
FREE
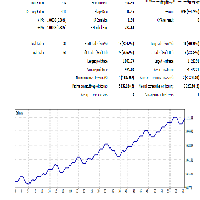
This Expert is developed to optimize parameters to trade intraday trending markets. Simply use optimization to find the proper inputs for specific symbol you are interested in. This is a light load EA from processing point of view. You can easily run this on several charts simultaneously. Make sure to set a different magic number for each. note: The screenshot shows a 12% profitability in EURUSD for a period of a year and 2% draw-down using optimization to find best inputs.
FREE

For those Price Action traders who love to trade strong Price points, like today's Opening Price (or even yesterday's Price), here is an indicator to ease the identification of those values, drawn directly on your chart! Opening Price will automatically draw a line showing you this point for you, AND, if you like any OPENing price in the past, not just today's price. A must-have in your Price Action toolbox!
SETTINGS
How many past days do you want to be drawn? Do you want to draw the current
FREE

SI Connect è un'utility che stabilisce la connessione ai nostri server per utilizzare FX Volume o i sistemi di trading SIEA.
Istruzioni tecniche per preparare il vostro terminale all'uso di SI Connect Consentire le richieste web e inserire https://stein.investments nell'elenco degli URL consentiti in Opzioni terminale -> Sottocategoria Expert Advisors . Hai bisogno di una sola istanza EA in esecuzione per ogni terminale, ma deve funzionare costantemente in background per prendere gli ultimi da
FREE

Blended Candle Strength (BCS)
Any trading strategy, whether it is a continuation, trend reversal or breakout requires, in addition to analyzing the context of the price movement, confirmation signals for both trading entry and exit. And for that, it is necessary to analyze the formats of the candlesticks and fit them in known patterns to assist decision making. In addition to the context and format, two other important information to determine the strength of candlesticks are the size of the ba
FREE

The initial balance (IB) is a range in which the price spent its first two OPT periods after the opening. In other words, the opening balance is a range of the first hour after the market opened. The opening balance arose from room trading, as room traders observed the various ranges after the market opened.
This indicator allows you to enter the starting and ending hours and minutes of a specific hourly time range so that the trader can set up different IBs according to the market.
Autom
FREE

Have you ever wondered which currency is the strongest at any particular time? Or which currency pair is trending the most. Well, the currency strength meter helps with just that. It compares USD , EUR , AUD , CHF , GBP , CAD and NZD depending on the timeline you have chosen in settings, and ranks them on the number of pips each has moved compared to the rest. N/B: All currency charts of the above pairs must have loaded. You can do this by highlighting all major and minor currencies in
FREE
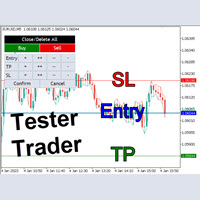
The Tester Trader EA is designed to simulate your manual trading strategy in the strategy tester. By default this is not possible and manual trading is completely disabled in the MT5 strategy tester. This tool helps you to open, manage and close orders and positions easily using action buttons in the chart. Forward testing your manual trading strategy can be a real pain. Time moves slow and it can take days or months to fully test a manual trading strategy. With this tool you can simulate forwar

Down load all the historic ticks data from a pair. Just load the EA to a graph, give it time to download all the data ticks and wait for the messages to appear as downloaded in the terminal. Once its downloaded, the data will appear in MQL5/Files folder as "ticks_data_XXXX.csv". where XXXX is the symbol from whom you just downloaded the data. You can use this data as input for a python file for ONNX or what ever you want or need. For big pairs, the data is Gb big.
FREE

Shows min and max of last M5 Candle. Can be used to trade breakouts of last M5 candle. The M5 Candle Breakout Strategy avoids to stay too long in a sindways phase. See documentation on @swisstrader3713, where you can follow my live trading. The only parameters are the color of the lines defining the M5 stretch. Best use the indicator in M1 timeframe. The M5 Breakout Strategy has helped me to reduce overtrading.
FREE

Indicatore finanziario SolarTrade Suite: Indicatore del mercato del mercurio: la tua guida affidabile nel mondo dei mercati finanziari!
È una media mobile che utilizza speciali algoritmi innovativi e avanzati per calcolarne il valore e ha anche un design gradevole alla vista.
È molto semplice comprendere le letture di questo indicatore: colore blu - acquista, colore rosso - vendi. Più luminoso è il colore, più forte è il segnale.
Dai un'occhiata agli altri nostri prodotti SolarTrade Suite

Forex Indicator Arrows is an arrow Indicator used as an assistant tool for your trading strategy. The indicator analyzes the standard deviation of bar close for a given period and generates a buy or sell signals if the deviation increases. It good to combo with Martingale EA to follow Trend and Sellect Buy Only/Sell Only for EA work Semi-Automatic. You can use this Indicator with any EAs in my Products.
FREE

Consecutive candles can give us an indication as to the strength of a trend. With this indicator, you can set the number of consecutive bull or bear candles you wish to be present before achieving a valid signal of RSI crossing into overbought or oversold. With this information, you can better judge if a continuation or reversal situation is about to present. RSI has two settable levels
Interesting settings: Number of consecutive candles needed before a valid signal Overbought level of RSI Ove
FREE

When prices breakout resistance levels are combined with momentum oscillator breaks out its historical resistance levels then probability emerges to record farther higher prices. It's strongly encouraged to confirm price breakout with oscillator breakout since they have comparable effects to price breaking support and resistance levels; certainly short trades will have the same perception. Concept is based on find swing levels which based on number of bars by each side to confirm peak or trough
FREE

SPREADEX e' un indicatore per MT4 e MT5 che indica la distanza dell'ASSET dal GP. il GP e' il prezzo del vero valore dell'ASSET sottostante ottenuto per stima. Il GP e' come una calamita, attira il prezzo dell'ASSET con alta probabilita' ed all'interno della stessa giornata di trading. Quindi SPREADEX indica quali sono gli asset piu distanti dal GP al momento in tempo reale. Fornendo un punto di vista al TRADER su quali asset concentrarsi e cercare eventuali segnali di inversione dei prezzi per
FREE

DiversiStrat Harmony Pro: Revolutionizing Trading with over 25 Strategies in one EA! Welcome to the future of trading with DiversiStrat Harmony Pro – your ultimate solution for navigating the complexities of the market with ease and precision. Harnessing the combined power a package of meticulously curated strategies, this Expert Advisor (EA) is engineered to excel in the dynamic landscape of Forex trading. At the heart of DiversiStrat Harmony Pro lies a commitment to innovation and reliability.
FREE
Use Day Trading Tracker to keep a record of your earnings across accounts. This indicator will show a dashboard in the Meta Trader chart to show for the profit or loss money in your account. It’s easy to see just how much money you’re making matched betting with the Forex Trading Profit Tracker. Key features: Track your profit over time Check out your stats. Track expected profits against actual profits. Export account history to Excel. MT4 version: https://www.mql5.com/en/market/product/39113
FREE

Технический индикатор Trend Moving Average позволяет определить глобальное направление рынка. Данный технический индикатор создан для того, чтобы определить «линию наименьшего сопротивления» рынка и понять в какую сторону направлен тренд. Помимо классического использования МА, индикатор позволяет понять направленность рынка на основе динамики его значений. Так, если значение индикатора демонстрируют переход с нисходящего значения в восходящее (и наоборот) - это является дополнительным торговым с
FREE

Introducing TRAD-E- LITE : Your Ultimate Trading Assistant! Are you tired of manually analysing the markets and executing trades? TRAD-E- LITE is here to assist you! Developed by Gold Lion XI, this expert adviser utilizes advanced algorithms to identify profitable trading opportunities and execute trades automatically, saving you time and effort. Key Features: Trading Time Management: Take control of your trading schedule. With TRAD-E- LITE , you can define specific trading hours based on your p
FREE

An analogue of the Stochastic oscillator based on algorithms of singular spectrum analysis (SSA) SSA is an effective method to handle non-stationary time series with unknown internal structure. It is used for determining the main components (trend, seasonal and wave fluctuations), smoothing and noise reduction. The method allows finding previously unknown series periods and make forecasts on the basis of the detected periodic patterns. Indicator signals are identical to signals of the original i
FREE

Indicatore di tendenza della volatilità dell'indice.
Caratteristiche principali:
Viene utilizzato solo per gli indici sintetici nel broker binario o derivato, che sono gli stessi. Ha un filtro di tendenza. Ha un avviso sonoro per avvisare di un possibile calo dei prezzi. Può inviarti avvisi mobili se lo metti su un VPS. È configurato con l'algoritmo L566b12 progettato per una migliore efficienza.
Come utilizzare l'indicatore
Funziona nella temporalità di M1. La tendenza

About This Indicator: RSI vs SMA Oscillator: A Comprehensive Technical Analysis Tool for Better View of Market Price
The RSI vs SMA Oscillator is a powerful technical analysis tool designed to understanding Market Price Fluctuation for buy or sell signals. This user-friendly Oscillator good for both novice and experienced traders, providing valuable insights into market trends and price movements. Key Features: - RSI Cross Alert: The indicator is based on the Relative Strength Index (RSI), a po
FREE

To download MT4 version please click here . - This is vortex indicator. - It is used to detect trend strength and direction. - It consists of two line(buffers). ==> VIM and VIP - There are three types of signals related to this indicator: 1. crossing VIM and VIP 2. threshold on distance between VIP and VIM 3. VIP above VIM vice versa. - This is a non-repaint indicator with light processing.
FREE

Lazy Scalper is fully automated, it is built based on the break-out strategy by calculate the signal from the ZigZag Indicator (strategy 01) or Fractal Indicator (strategy 02). This EA does not use any martingale or grid functions and follows a logical concept and it is suitable for both beginners and experienced people. The Backtests shown in the screenshots were done with default settings. It may not be the best or the worst. Please download the free demo to experience your own. su

Indicador Maestro del Trader
Características Principales: Spread del Mercado en Tiempo Real : Visualiza el diferencial entre el precio de compra y venta directamente en tu gráfico. Cuenta Regresiva del Cierre de Vela : No más sorpresas al final de la vela. El indicador muestra un cronómetro que te informa cuánto tiempo queda antes de que se cierre la vela actual. ¡Actúa con precisión en los momentos cruciales! Ganancias o Pérdidas en Tiempo Real : ¿Estás en verde o en rojo? El Indicador Maes
FREE

This indicator can help you clearly identify trend changes in both bullish and bearish markets. The indicator compares the closing price of the last candle with the closing price of the candle "X" periods ago (input parameter). In an uptrend, an initial number '1' is plotted if a candle closes higher than the closing of a candle "X" periods ago. In a downtrend, an initial number '1' is plotted if a candle closes below the closing of a candle "X" periods ago. Subsequent numbers are plotted when e
FREE

White Crow Indicator
by VArmadA A simple yet powerful candle analysis based indicator using the White Soldiers & Crow patterns.
Works with timeframes 1H and higher and tested on all major pairs. Pay attention to the signal: An arrow indicating a long or short entry.
How It Works:
Arrows indicate a ongoing trend. After multiple bullish or bearish candles in a row the chances for another candle towards that trend is higher.
Instructions: - Crow Count: Set the number of candles that ne
FREE
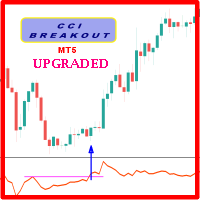
Probability emerges to record higher prices when CCi oscillator breaks out oscillator historical resistance level when exhibit overbought values. Since, oscillator breakout of support and resistance have similar effect as price breaks support and resistance levels, therefore, its highly advised to confirm price breakout with oscillator breakout; certainly, will have the same output in short trades. Concept is based on find swing levels which based on number of bars by each side of peak or troug
FREE

The key to success is always good optimisation.
The system has a number of variables and in this case its simplicity is the key to its success. The system looks for the different "Gaps" as market entry failures and then debugs them through a stochastic analysis, i.e. the analysis of two moving averages to see if the price is overvalued or undervalued, and once this is done, the expert advisor will decide whether to perform an action or refrain from performing it. It is a very simple but power
FREE

Highly configurable Average True Range (ATR) indicator.
Features: Highly customizable alert functions (at levels, crosses, direction changes via email, push, sound, popup) Multi timeframe ability Color customization (at levels, crosses, direction changes) Linear interpolation and histogram mode options Works on strategy tester in multi timeframe mode (at weekend without ticks also) Adjustable Levels Parameters:
ATR Timeframe: You can set the lower/higher timeframes for ATR. ATR Bar Shift: y
FREE

This simple indicator paints with a darker color on the volume bar when the quantity traded is above the average of select number of periods of the volume itself, highlighting the moments when there was a large volume of deals above the average. It is also possible to use a configuration of four colors where the color tone shows a candle volume strength. The indicator defaults to the simple average of 20 periods, but it is possible to change to other types of averages and periods. If you like
FREE
O Produto RFOC Variação Diária apresenta a função de indicar no gráfico a variação, em porcentagem, do preço em relação ao preço de fechamento do dia anterior.
O indicador permite configurar 100% da coloração para variações de alta, baixa e neutra (0.00%).
O painel com a apresentação da variação diária do preço fica fixada na parte superior do gráfico, e se ajusta automaticamente no centro da janela.
FREE
Special Trailing Sl is a automatic trailing stop_loss. first It will try to free risk your trade then save the profits. first step is to move the SL 50 points below current price for long trades , and 50 points above current price for short trades.First step will happen when the trade get to minimum profit per point. second step : SL will follow the current price with a dynamic distance. This trailing stoploss has been used in my products.
FREE

Unlock the Power of Scalping with this Essential Indicator for Any Currency Pair! Experience Crystal-Clear Buy/Sell Signals and Activate Instant Alerts for Maximum Precision.
Introducing the Ultimate Scalping Companion: Your Key to Precision Profits! Transform Your Trading Strategy with an Indicator that Stands the Test of Time! In the ever-evolving world of trading, consistent success hinges on smart risk management . While no tool can be the holy grail, our non-repainting indicator
FREE

The VPS Sentinel Expert Advisor will be your ally to protect your trading capital and keep you updated of the status of your trading terminal (MT5) running on your remote VPS (Virtual Private Server). With the VPS Sentinel running on your terminal, you will have a first line of defence against any problem that could occur. You will also be able to: Define a Global Stop level (Stop-Out), decide if you want to receive notifications and also enable an automatic closing of working positions an
FREE

https://t.me/mql5_neuroExt actual version Signal https://www.mql5.com/ru/signals/1511461
You can use any tool. The bases will be automatically created at the start of the Learn. If you need to start learning from 0 - just delete the base files. Initial deposit - from 200 ye. Options:
DO NOT ATTEMPT TO TEST WITHOUT NEURAL NETWORK TRAINING!
it is enough for the balance graph after training to be horizontal.
generating a training base is extremely simple.
there is a ready-made training
FREE

This bot uses two CCI indicators one slow and the other fast. Then there is a moving average to determine the trend (if price is above moving average then its an up trend ). If a signal is to be produced in the opposite direction of the current open trade then it closes and reverses the type of trade. An ATR indicator is used for better stop loss and take profit placement. There is a trailing stop function. This robot can be used in the H1 timeframe , other time frames should work though you wil
FREE

The SpreadTracer and TimeLeft indicator is a powerful yet straightforward tool designed for traders who want to keep a close eye on market conditions directly on their chart. This custom indicator provides essential real-time information about the spread and candle time, making it easier to make informed trading decisions. Key Features: Current Spread Monitoring : The indicator constantly displays the current spread of the trading pair, helping you assess the cost of entering or exiting a positi
FREE

This is an indicator of trading sessions that can display all levels (Open-High-Low-Close) for four sessions . The indicator can also predict session levels. Sessions can be drawn with lines or rectangles (empty or filled), lines can be extended to the next session. You can easily hide/show each session by pressing hotkeys (by default '1', '2', '3', '4'). You can see ASR (Average Session Range) lines (default hotkey 'A'). This is similar to the ADR calculation, only it is calculated based on

Maximize your trading efficiency with this Breakeven and Trailing Stop Manager, an Expert Advisor (EA) for MetaTrader 5 designed to enhance your risk management by automating breakeven and trailing stop strategies. This EA ensures that you lock in profits and minimize potential losses without constant manual input, giving you more time to focus on market analysis and decision-making.
### Key Features:
- **Automatic Breakeven Adjustment:** The EA automatically moves the Stop Loss to the b
FREE

Certainly. Here's the explanation in English: This program is a custom indicator that calculates the MACD (Moving Average Convergence Divergence) and shows the crossovers between the MACD and Signal lines. Here are the main functions of the program: MACD Calculation: Calculates the difference between the Fast EMA (Exponential Moving Average) and Slow EMA. This difference forms the MACD line. Signal Line Calculation: Creates the Signal line by taking a simple moving average (SMA) of the MACD valu

Main: Not martingale, not a grid; Working on all symbols;
Signals: There is a good rational algorithm. Work of two indicators: Stochastic and OsMA (you can set a separate Timeframe for each indicator)
Stop Loss/Take Profit: There is a good money management system (there are several type for trailing stop loss); There is virtual levels of Stop Loss / Take Profit; There is smart lot (percent by risk) or fix lot
Important: EA can work on closed candles, and on current candles; Quickly o
FREE

Bill Williams' divergent bar with angulation. The angle between the green line and the top/bottom of the bar is used as an angle, which basically corresponds to the updated recommendations from Justin Williams Angulation for the Wiseman Bullish and Bearish Divergent Signal Bar - YouTube . The default settings of the angle of 85 and 21 bar from the moment of crossing the lip line of the Alligator work quite well. If you use this indicator in real trading, I highly recommend not to engage in day
FREE

Hyper DM, Moving Distance from Moving Averages is an indicator that allows you to define the distance in points of the upper and lower bands in relation to the moving average in the middle.
Its operation is simple, it has configuration parameters of the moving average of the middle and based on it and the defined distance parameters of the upper and lower bands, it is plotted in the graph.
FREE

Cybertrade Double Bollinger Bands - MT5 The Bollinger Bands indicator shows the levels of different highs and lows that a security price has reached in a given duration and also their relative strength, where the highs are close to the upper line and the lows are close to the lower line. Our differential is to present this indicator in a double form, with the availability of its values to simplify automation.
It works on periods longer than the period visible on the chart. All values are
FREE
As traders, we all know that risk management is the most important aspect of profitable trading. So, we need to determine the lot size, every time we need to open a new trade. The FX lot size calculator is a simple tool that will help you to determine your lot size easily without using any third-party service but you will be able to do that by your MetaTrader terminal. LIMITED TIME OFFER: 30$ FOR 10 ACTIVATION.
Inputs:
Maximum_Risk_Prc: To determine your preferred risk%. For example, if your r
FREE

The ColorLine indicator shows the line of the price moving average on the chart. The line has diffrent colors (100 bars have the same color). The color settings of the line is changing every 5 ticks, there are 3 color schemes. Indicator for demonstrating the DRAW_COLOR_LINE style. Draws a line at Close prices in colored pieces of 20 bars. The thickness, style and color of the line sections are changed randomly. The indicator code is published in the MQL5 Documentation in the section Indicator S
FREE

A free deals history results panel.
Its working principle is to calculate the income of each month by consulting the historical trading records, and show it in the form of a table. At the same time, it also statistics all the trading results of the current account, so that traders can adjust their trading strategies according to the historical records.
If you have more needs, please contact the author!
FREE

The Supertrend indicator is a very versatile and and accurate trend detection system. It can also be used an an reversal indicator. Therefor you can use it either as entry or as an exit signal. Depending on your settings it is also good for trend confirmation. This version is slightly enhanced from the original version from mladen. The Supertrend of Averages Histogram Version contains: 11 different price options Averaging period
18 different averaging types ATR period and ATR multiplier Shows r
FREE

Genaral: Not martingale, not a grid; Use on EURUSD Use on M5
Signals: There is a good rational algorithm. Work of two indicators: 2 DeMarker (from 2 timeframes) (you can set a separate Timeframe for each indicator)
Stop Loss/Take Profit: There is a good money management system (there are several type for trailing stop loss); There is virtual levels of Stop Loss / Take Profit; There is smart lot (percent by risk) or fix lot
Important: EA can work on closed candles, and on current candl
FREE

Do you already know the Start Midas indicator?
What about the Vwap Standard Deviation indicator?
And I need to speak again in the book MIDAS Technical Analysis ...
The Start Midas SD Channel indicator combines the two in one, bringing the practicality and efficiency of Midas with the statistical calculation of the standard deviation.
All of this with the practicality of the White Trader Start indicators, where you can plot the indicator and move them on the screen using keyboard s

This algorithm is based on the grid strategy and performs dynamic position management to make it work on netting accounts. Unlike other robots, this grid system bases its entries on profit over time of the asset instead of using pips. This parameter is the one that corresponds to "Average Distance".
You can trade all 28 major currencies simultaneously. Parameters: +------------------------------------------------------------------+ :-:-:-:-:-:-:-:EXPERT SETTINGS:-:-:-:-:-:-:-: +--------------

SuperMax MT5 is a fully automated, intelligent expert advisor with advanced mechanisms, using a dynamic system to measure market volatility to be consistent with the timing of market entry and exit. The mechanism of this system is based on the principle of mean reversion and momentum of market price. Rely on scalping and recovery strategies with optimal trading frequency and can still work well in all market conditions, be it trend or sideways, can be traded full time in any condition. This EA

This indicator can identify more than 60 candlestick patterns on the chart, including their bullish and bearish variants. Just choose the pattern you want in the settings.
Available Patterns 2 Crows Gravestone Doji On Neck 3 Black Crows Hammer Piercing 3 Inside Hanging Man Rick Shawman 3 Line Strike Harami Rising and Falling Three Method 3 Outside Harami Cross Separating Lines 3 Stars in South High Wave Shooting Star 3 White Soldiers Hikkake Short Line Abandoned Baby Hikkake Modified Spinning
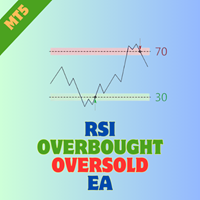
RSI Trader Expert Advisor for MetaTrader 5 Introduction: Welcome to the RSI Trader EA, an advanced tool designed exclusively for MetaTrader 5. This expert advisor streamlines trading activities by harnessing the power of the Relative Strength Index (RSI) indicator, automating trade entries and exits based on overbought and oversold conditions. The EA also facilitates reverse trading setups within these zones, offering a versatile approach to managing trades. You can find MT4 version here For det

Indicatore finanziario SolarTrade Suite: Indicatore di mercato di Plutone: la tua guida affidabile nel mondo dei mercati finanziari!
È un oscillatore di volatilità che utilizza speciali algoritmi innovativi e avanzati per calcolarne il valore e ha anche un design gradevole.
È molto semplice comprendere le letture di questo indicatore: colore verde - bassa volatilità e momento migliore per aprire un'operazione commerciale, colore arancione - alta volatilità e tempo per pensare a chiudere una

Questo indicatore traccia in modo efficiente qualsiasi altra candela temporale che desideri monitorare sullo stesso grafico
1. Seleziona un intervallo di tempo superiore per caricare le barre sullo stesso grafico
2. Personalizza i colori e lo stile dei candelieri
3. Scegli il numero di barre per disegnare candelieri
4. Tieni traccia delle candele complete con un intervallo di tempo più lungo insieme allo stoppino e al corpo
5. Facile e conveniente per coloro che non vogliono cambi

Questo è un indicatore progettato meccanicamente basato sull'azione del prezzo del candeliere. Funziona su qualsiasi strumento di trading producendo avvisi ogni volta che viene generato un impulso di acquisto o vendita, tuttavia sono disponibili un video e documenti esplicativi per la convalida dei segnali che forniscono anche tecniche di entrata e uscita. Cerca su YouTube Benjc Trade Advisor e individua i video esplicativi su questo prodotto.
L'ultima versione presenta vincoli di trend e osc

COPIATRICE COMMERCIALE - PASSWORD INVESTITORE - COPY TRADE - PIATTAFORMA CROSS MT4 x MT5
Nota: sono necessari sia "Mirror Copier Master" sull'account master che sarà seguito dall'account cliente sia "Mirror Copier Client" sull'account cliente che seguirà l'account master
Blog: https://www.mql5.com/en/blogs/post/756897
COME FUNZIONA :
https://www.youtube.com/watch?v=V7FNpuzrg5M
Versione MT4
Maestro: https://www.mql5.com/en/market/product/114774
Cliente: https://www.mql5.com/en/

(Grafici di criptovaluta)
Salva tutti i simboli di Binance Future in simboli personalizzati.
Aggiunge il prefisso "F" ai simboli in Binance Future.
Crea l'infrastruttura in cui è possibile seguire i simboli in Binance Future.
Dovresti consentire WebRequest dal menu Strumenti >> Opzioni >> Consulenti esperti e aggiungere l'URL: https://fapi.binance.com
basta fare doppio clic sullo script.
Hai l'intera lista in pochi secondi.
vedere il prodotto nel link https://www.mql5.com/en/m
FREE

Cet indicateur innovant de mesure de la force des devises de INFINITY est une aide indispensable pour les scalpers et les commerçants qui négocient à long terme. Le système d'analyse De la force/faiblesse des devises est connu depuis longtemps et utilisé sur le marché par les principaux traders du monde. Tout commerce d'arbitrage n'est pas complet sans cette analyse. Notre indicateur détermine facilement la force des devises sous-jacentes les unes par rapport aux autres. Il affiche des graphiqu
Ciao ragazzi
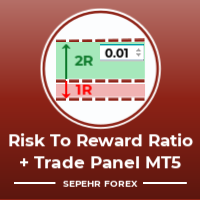
"Trader Assistant Mini" è uno strumento utile per calcolare il rischio per operazione con un pannello R:R fluente.
Rapporto rischio/rendimento più Trade Panel:
È utile per ogni trader calcolare l'entità della perdita in relazione all'entità del profitto e anche gestire il rischio per trader in modo che possa giudicare se si tratta di un buon trade o meno. Inoltre, mostra la perdita e il profitto in pip e percentuali e la perdita e il profitto. How to install the demo version

Dati tick in tempo reale sulle criptovalute, offerte, richieste e profondità di prenotazione per EA
Scambio disponibile:
1. Binance Spot (supporta la profondità del book degli ordini sulla finestra del grafico attiva) e Futures (supporta la profondità del book degli ordini multipli)
2. Kucoin Spot e Futures, supporta la profondità del book degli ordini sulla finestra del grafico attiva
3. Bybit Futures e Inverse Futures Tick Data Bid Ask Last
Prossimo scambio: OKX, MEXC e altro an
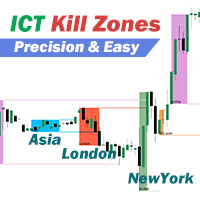
Identificate i 5 timeframe delle ICT killzones con colori diversi e seguite il tracciamento per contrassegnare l'area di prezzo all'interno del timeframe, le linee di riferimento del punto di pivot alto e basso si estenderanno automaticamente fino a quando il prezzo del punto di pivot non verrà rotto o il timeframe di trading non terminerà. Questo indicatore aiuta a trovare i punti di breakout per operare con la tendenza. Le ICT killzones sono periodi specifici del mercato in cui il volume e la
Il MetaTrader Market è il posto migliore per vendere robot di trading e indicatori tecnici.
Basta solo sviluppare un'applicazione per la piattaforma MetaTrader con un design accattivante e una buona descrizione. Ti spiegheremo come pubblicare il tuo prodotto sul Market per metterlo a disposizione di milioni di utenti MetaTrader.
Ti stai perdendo delle opportunità di trading:
- App di trading gratuite
- Oltre 8.000 segnali per il copy trading
- Notizie economiche per esplorare i mercati finanziari
Registrazione
Accedi
Se non hai un account, registrati
Consenti l'uso dei cookie per accedere al sito MQL5.com.
Abilita le impostazioni necessarie nel browser, altrimenti non sarà possibile accedere.