Guarda i video tutorial del Market su YouTube
Come acquistare un Robot di Trading o un indicatore
Esegui il tuo EA
hosting virtuale
hosting virtuale
Prova un indicatore/robot di trading prima di acquistarlo
Vuoi guadagnare nel Market?
Come presentare un prodotto per venderlo con successo
Expert Advisors e Indicatori per MetaTrader 4 - 62

you can plan you exit in terms of money/floating with this tool Once the negative or positive floating value reached this tool will close all opened positions
How to deal with big negative floating profit?
It will be very difficult to overcome this phase you can prevent with this phase with a exit strategy
It can be stop loss or close all orders if account has reached this much floating
FREE

The Sentiment Ratio indicator gauges current Market Sentiment between -100% and 100%, where lower than -40% is considered Bearish and higher than 40% is Bullish. The channel between the two is considered Neutral. The indicator has been a very useful filter tool for signals within a trading system.
Example call function: int SentimentIndicator(double triggerLevel)//Return sentiment if trigger level is activated { double sentimentRatio=iCustom(NULL,0,"Sentiment Ratio",0,0,0); if(sentimentRa
FREE

Lucky EA Random Outputs Test the EA first in a Demo Account. This EA RUN on a Random Strategie and open Trades per coincidence Strategie. Recommend Broker "IC Market, FTMO”. 1000$/€ 1-5 Lot in first Week, Timeframe M1. DE40 with this Settings only for other Indizes or Pairs please change the Settings appropriately to the actual Spread. You musst for DE40 nothing Change Set the EA to your MT4 Desktop and START. Worktime is from 09:01-18:00 Servertime. Unlimited Default Settings you can Change the
FREE
DStochastic is an improved version of the classic Stochastic oscillator with an added moving average. The indicator dampens the market noise, determines the direction of the market and reduces the number of false signals. We have also added a function of multicolor signal line display of increase and decrease by means of dots. The blue dots indicate the development of an ascending trend, the red dots - descending. Similar to all standard oscillators, DStochastic can be combined with all trend in
FREE

Moving Average Rainbow Stack: Free: Single Currency & Single Timeframe MA Stack Very useful for finding current and higher timeframe trends. Best suited for long term trend based trading. Use fewer MAs for quick scalping. And not suitable during low volatility. Only use during high volatility and steady trending markets. Use this to enhance your existing Trend based strategies to find best trends.
Read detailed description https://abiroid.com/product/abiroid-ma-stack Available MTF and Scanner
FREE

KFX SMA: Symbol Changer + Moving Average (3x) + ATR + RSI + Candle Timer.
This indicator allows you to create a Symbol list and change between symbols of the current chart or Timeframe by selecting the appropriate button. On Chart there are three(3) multi timeframe Moving Averages shown (selected by you), ATR Value MTF ( selected by you - helps with setting SL and TP), RSI Value MTF (selected by you) and a Candle Timer. Features: - Symbol Changer : Change Symbol and Timeframe of Chart. (
FREE

BeST_Chande RAVI (Range Action Verification Index) is an MT4 Indicator that is based on the corresponding indicator developed by Tushar Chande which is mainly based on market momentum while focuses on identifying ranging and trending markets.
By default RAVI is defined by the formula: RAVI = Absolute value (100 x (SMA(7) – SMA(65)). Also by default there is an arbitrary reference level of 3% that means a market is ranging if the RAVI is less than 3%, or trending strongly if it is is greater t
FREE

The VR Orders History script is designed to upload a trade report to a csv file. This format is intended for additional analysis of trading history in programs such as EXCEL, Openoffice, and Libreoffice. Thanks to the script, it is now much easier for a trader to analyze their trading history. The program facilitates the analysis of the trading history for the MetaTrader 5 terminal. The trader sees structured trading. The entire report is based on the following principle: Position > Order on the
FREE

The RSI Arrows MTF indicator is based on the RSI indicator. Represents input signals in the form of arrows. It has 6 types of calculation. All signals are generated on the current bar of the selected period.
Signals do not redraw in the first 4 modes! But it is possible to redraw in cases of a sharp change in market movement.
All signals in MTF mode correspond to signals of the period specified in MTF. It is maximally simplified to use both for trading with only one indicator and for using
FREE

The Trendline Trade Panel was created to make it easier to train forex trading skills in backtester and at the same time make it easier to live trade using trendlines with the push of a button. This ea is perfect for beginners who want to learn to trade manually because all of its features are equipped with basic tools for trading forex. Other uses for Trendline Trade Panel: + Can be used to perform recovering loss positions made by other EA or positions that open manually. Fill in magic number

This EA trading by a combination of specific MACD Divergence pattern and indicators signals. Designed to work on EURUSD 1H market. Minimum trading deposit 100 $ . All trades have fixed Stop Loss and Take Profit . No Grid. No Martingale. Works with high spread This EA operates only once per bar opening. Fast methods of strategy testing and optimization are valid. User can test / optimize by model: (control point) / (open prices only) developed and tested from 2005 to release
FREE

The GJ_H1_220100009_S_HD_CF_SQX_SL20 is an algorithmic trading strategy for MetaTrader, tested on GBPJPY using the H1 timeframe from April 1, 2004, to April 24, 2024. There is no need to set up parameters, all settings are already optimized and fine-tuned.
Recommended broker RoboForex because of EET timezone.
You can find the strategy source code for StrategyQuant at the link: http://quantmonitor.net/listing/gbpjpy-macd-trader/
Key details are:
Parameters
MagicNumber: 220100009
M
FREE

Great smart dashboard for market analytics.
Using this dashboard you can: find signals from different indicators from all timeframes ; find signals from the Moving Average from all symbols ;
Include: 9 indicators (10 in Mt5 version); 27 signals (29 in Mt5 version); "Total" page.
Indicators and signals: MOVING AVERAGE MA cross Price - MA crosses Price; MA more/less Price - MA higher/lower Price; BOLLINGER BANDS BB crosses Price (in) - Price crosses Bollinger (upper/lower line) in

A complete NNFX algorithm in one indicator.
NEW: Inbuilt backtester shows historical trade stats on the chart to show which pairs are most profitable. Don't be fooled. It's not enough to simply match a strong and weak currency to trade successfully with a strength meter, you need to know the intimate details of the relationship between two currencies. This is exactly what we've done with NNFX Strength, giving you all the information you need to make solid trading decisions. Years in the makin

MetaTrader 5 version available here : https://www.mql5.com/en/market/product/24882 FFx Basket Scanner is a global tool scanning all pairs and all timeframes over up to five indicators among the 16 available. You will clearly see which currencies to avoid trading and which ones to focus on.
Once a currency goes into an extreme zone (e.g. 20/80%), you can trade the whole basket with great confidence. Another way to use it is to look at two currencies (weak vs strong) to find the best single pair

FX News Trading EA is a news Expert Advisor trading by the economic calendar. It features the following working modes: Manual – trader sets the news time on its own Automatic – the EA takes the news release time and its importance from the news website Several modes of customizable parameters allow the EA to conveniently adjust the EA to your trading strategy. The trading robot automatically determines the time zone, the news importance, the currency affected by the news release, displaying the

ATTENZIONE: l'applicazione non può funzionare nello Strategy Tester, se desideri provare la versione demo gratuitamente per una settimana, o hai delle domande, scrivimi una mail! Trovi il mio indirizzo sul mio profilo utente. TrendLine Auto Executor è un software capace di individuare le trendline che hai tracciato sul grafico ed aprire gli ordini non appena queste vengono toccate o superate. Il software permette di gestire due ordini alla volta per ogni chart tramite il tracciamento di due gr

BOROT Assistant : Trading Assistant for Manual Traders
Description:
The Trading Assistant is a user-friendly tool designed for manual traders to improve their trading performance and enhance their decision-making process. It offers a comprehensive range of features that help traders effectively manage risk and reward, execute orders, and identify potential trading opportunities. The Assistant's key features include:
Risk and Reward Box : Clients can easily draw a risk and reward box on the
FREE

Indicator Description This is a one-of-a-kind indicator. It predicts future bars using the theory of cyclical behavior of prices and certain market stationarity. This indicator will help you predict 1 or more future bars, thus providing a picture of the possible development of the market situation. It is based on 5 prediction methods. The first method is the Fourier transform, while the other ones are represented by different variations of linear prediction methods. You can select which method w
FREE

A ready-made trading system based on automatic construction and maintenance of Fibonacci levels for selling and buying for use on any instrument (symbol) and on any period of the chart. Features Detection of trend direction (14 indicators) Construction of horizontal levels, support and resistance lines, channels Selection of a variant for calculating Fibonacci levels (six different methods) Alert system (on screen, E-Mail, Push notifications) Buttons Color scheme switching button. Arrow buttons.

The Breaker Blocks with Signals indicator aims to highlight a complete methodology based on breaker blocks. Breakout signals between the price and breaker blocks are highlighted and premium/discount swing levels are included to provide potential take profit/stop loss levels.
This script also includes alerts for each signal highlighted.
SETTINGS
Breaker Blocks
Length: Sensitivity of the detected swings used to construct breaker blocks. Higher values will return longer te
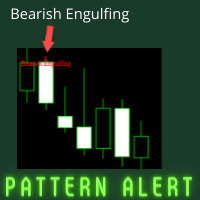
Welcome to pattern alert indicator page. This indicator designed for alerting purpose of Bullish and Bearish engulfing pattern alert. This stuff is suitable for 1 hour, 4 hour and 1 day time frame. high winning ratio is tested. Buy Alert: when the bullish engulfing pattern alert is noticed. Sell Alert: when the bearish engulfing pattern alert is noticed. See the attached screenshots for more clarity. Happy trading !!! Open Account (Get $15 cash back for each and every 1 lot trades has done) : ht
FREE

Candle Timer displays the time remaining until closing the current Bar, and a new bar forms.
Feature simple to use . no lag or delay . customize position, color & font Size . server time not local time.
Inputs
- position * Beside Active Candle ( Default ) * Right Upper * Lift Upper * Right Bottom * Lift Bottom - font size * 14 (Default) - color * SpringGreen (Default)
FREE

Buy and sell signals using the MACD histogram. The interface is simple and easy to understand. You can perzonalize the indicator in several ways according to its visual style or even more importantly, its setting of parameters to detect market signals. Using the Multiplier option in the menu you can increase the indicator period although it is recommended to use the default settings.
FREE

The indicator analyzes the change in the minimum and maximum prices of the previous bars fixing the entrance of the big players. If the change (delta) increases, a signal is displayed on the graph in the form of an arrow. At the same time, virtual trade on history is carried out. In the free version, virtual trade is performed without refills in case of a repeat of the signal. The results of virtual trading in the form of losses / losses, profitability, drawdown and transaction lines are display
FREE

Divergence Reader - индикатор который поможет Вам идентифицировать на графике дивергенцию и конвергенцию.
Настройки Type - выбор типа сигнала (дивергенция, конвергенция, оба сигнала); Minimum length of divergence (Candle) - минимальная длинна сигнала (в свечах); MACD SETTINGS - настройки индикатора МАСD; Важно! Индикатор не рисует графику на истории! Для визуальной проверки индикатора рекоммендую использовать тестер.
FREE

The Dynamic Fibonacci Grid Dashboard ( DFG-360 ) is a multi functional trading app designed for work primarily in the Forex market. The app combines several modules and tools into one complete trading system. The unique interface of the app is optimized for active day trading, scalping, news trading, short term trend following as well as counter trend and grid trading.
Main features Advanced Multi Time Frame and Multi Market analysis. Quick and efficient position management. Semi-Automated tra
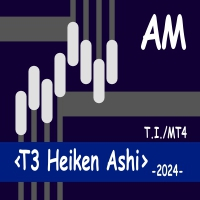
Implementation of the classic Heiken Ashi indicator using the T3 smoothing method. The indicator allows you to select the smoothing depth and the smoothing shift relative to the current price. The indicator also allows you to select the price at which the data will be smoothed, as well as the control price with which comparison is made. The proposed approach allows you to visualize the trend and simplify trading decisions.
FREE

Just a panel for drawing levels. Minimal but very useful thing. This is a reimagining of Color Levels Pro. ---- 4 types of customized levels. support for rectangle and line levels. The indicator parameters are very simple and are divided into blocks. For any update idea please contact me here. ---- don't suffer don't suffer ---- Enjoy your work!!!!!!!! ----
FREE

Buy Sell Zones Simple indicator for BUY / Sell Zones moving Buy and Sell zones : Closest zone is wide and clear : Red for Sell zone , Green for Buy zone >>> old far zones are in bold lines :::BUY Zones (GREEN) appear only in UP Trend and disappear in DOWN Trend :::SELL Zones (RED) appear only in DOWN Trend and disappear in UP Trend input parameters ::: index bars : bars range for zone calculation levels : number of zones Up move/Down move arrows mail and message Alerts !! used on any symbol u
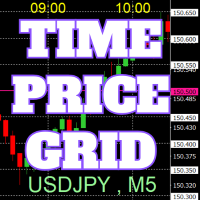
Sul grafico vengono disegnate griglie di prezzi e tempo su numeri interi per facilitare il riferimento.
Dal "Input dei Parametri", è possibile impostare gli intervalli di prezzo per ogni periodo. Le linee della griglia per i numeri significativi (numeri rotondi) sono più spesse e più evidenti rispetto alle altre linee, rendendole facilmente distinguibili. La griglia per i numeri significativi (numeri rotondi) può essere impostata con un colore diverso rispetto alle altre linee. I colori in va
FREE
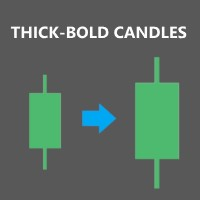
Description: Expand the width of your candles horizontally in MT4 to improve visibility when zooming in or out of the chart. Once attached to the chart, the indicator will automatically double the size of the candles compared to their normal value. Main indicator inputs: Body: size of the candle body Wick: size of the candle wick Additionally, you have the option to change the color of the candle body. We hope you find this free and useful indicator enjoyable!
FREE

What is a tool ? Used for monitoring profit summary in your portfolio, by setting profit target. The tool will automatically close all open orders. When the profits meet the target set. How to use Place the tool on any currency pair, any timeframe and set profit target. Easy... Currency Pair : Any Timeframe : Any Input Parameter Summary profit for auto close all orders ($) Meaning : Input your profit target here. Visit my products Target Profit Magic Target Profit All The Profit Tracker Currenc
FREE

Trade Entry Journal is your ultimate solution for streamlining trade entries and journaling. Designed specifically for forex traders, this powerful tool automates the tedious tasks of calculating lot sizes, placing trades, and documenting your trading activities. Say goodbye to manual entries and focus on making smarter trading decisions. Key Advantages: Automated Lot Size Calculation : Calculate the perfect lot size based on your stop loss level and risk amount. The lot size will be adjusted t
FREE

FXC iCorrelatioN MT4 Indicator (Specialized for DAX - Dow Jones)
The indicator shows the correlation soefficient between two assets. Correlations are useful because they can indicate a predictive relationship that can be exploited in practice. The correlation coefficient shows the relationship between the two symbols. When the correlation is near 1.0, the symbols are moving togerhet in the same direction. When the correlation is near -1.0, the symbols are moving in opposite direction. Important
The indicator shows the High and Low levels of candles for timeframes selected in the settings. It is recommended to use it on smaller timeframes to determine the levels of higher timeframes.
Parameters TYPE_LINE - type of the line (short based on the bar time, or long for the entire chart) ============= TF 1 ============= block of lines for the first timeframe TF_1 - timeframe of the first block of lines Bars_1_from=1 - Bar of the beginning of the line of the corresponding Timeframe. Bars_1
FREE

FREE FOR A LIMITED TIME ONLY!!! The Ultimate Indicator For Trading Trend This indicator clearly shows you the strength of the market in one direction or the other, which means that you can trade knowing you are either with or against the market. When used in conjunction with the +3R principles you are sure to have some serious results. The +3R Principles Routine - This is when you trade and how often Rules - This is the rule you follow Risk:Reward - This is the percentage amount of your accoun
FREE

The Oscillators histogram indicator is designed to show the histogram of some oscillator indicators. These oscillators are RSI, Momentum, ATR and CCI indications. Our Popular Products Super Oscillator HC Cross Signal Super Cross Trend Strong Trend Super Signal Parameters Oscillators - indicator name. Period - indicator period. Level indicator - indicator level. MAPrice - applied price for Momentum, CCI or RSI. Alerts - enable/disable alerts. Email Notification - enable/disable Email notifica
FREE

This is an Expert Adviser use for manual trading as a background EA or combine with external EA to open orders. Loss Recovery Trading is one of your options to handle the lose positions instead of using stop loss by setting a zone recovery area and target to exit the turn rounds sequence.
How It Work? If the market goes against your first positions direction at the specific of losing points, the EA will open an opposite direction position with calculated larger lot size and also keep the first
FREE

I make this indicator to help you for setting effective stoploss and getting more signals from following trends. This indicator helps to tell the trends and sideway, when 2 lines stand above of blue cloud, it means uptrend. When 2 lines stand above red cloud, it means down trend, the other else, it means sideway market. For taking order, you have to wait the arrows. You also need to see the cloud position, if the cloud's res, you have to wait the yellow arrow for selling order. If the cloud's bl
FREE
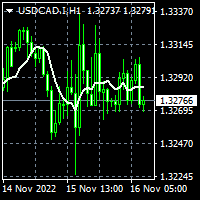
To download MT5 version please click here . Metatrader users are limited to few moving average types. Therefor I decided to create a package consisting of all MAs I knew. This package suggests 12 different types: { SMA, EMA, DEMA, TEMA, WMA, VWMA, SMMA(RMA), HullMA, LSMA, ALMA, SSMA, TMA } You can configure them via input tab. This is a non-repaint indicator with light load. To implement them I referred to standard libraries of pine script.
FREE

The indicator displays information about:
the name of the currency pair and timeframe. current price bid. time before the close of the candle. the current difference between the ask and bid (spread). Trading volume stats can also be displayed.
Displayed data
Name, account number, and account currency. A deposit in the account currency. Balance at the current time and a percentage of the balance. Current profit and its percentage. Current transaction and the percentage of the total deposit.
FREE

The block of bars is collected under condition of divergence . If the divergence conditions are not met, the block is deleted. More precisely, the condition is the transition of the block of bars from the state of divergence to the state of convergence . Blocks are formed selectively with gaps. Gaps are characterized by the state of convergence of bars. Before removing the block, we find the extreme bars inside the block (min, max). The line connects the extreme bars. The line is drawn only
FREE
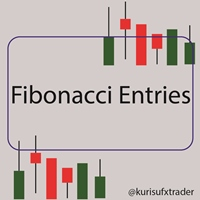
Objective: To automatically show the Fibonacci entries from last candle. Inputs: 1. Show/Hide the Fibonacci entries 2. Set where the Fibonacci will draw, 0 = current, 1 = last bar … (Default = 1) 3. Set the Fibonacci color 4. Set the line style 5. Set the minimum candle size automatically/manually in which the fib levels will appear 6. Set the candle size based on ADR/X Fibonacci levels: 23.6, 38.2, 50 Other Tools: https://www.mql5.com/en/market/product
FREE

Check out other great products from https://www.mql5.com/en/users/augustinekamatu/seller
This indicator finds the entry points based on divergences of common indicators and does not repaint . The principles used ensure that it can be used on CFDs, Commodities and Stock with incredibly great results. With proper money management and portfolio balancing the Indicator can be applied to any trading strategy to generate consistent profits. A Winning Trading Strategy This article describes the co
FREE

It's a simple but useful tool for creating a grid based on Bollinger Bands .
Only 2 parameters can be set: 1) "Period" - the period of all visible Bollinger Bands (i.e. 4) and 1 Moving Average (axis of all Bollinger Bands), 2) "Deviations Distance" - the distance between Bollinger Bands.
Naturally, the colors of all 9 lines can be changed as desired. It works with everything that is available in your Market Watch.
Good luck!
FREE

This indicator provides trading signals based on the polarity of the dynamical parameters of two digital signals. The dynamical parameters (momentum-acceleration) are derived by applying a high quality momentum oscillator, MTEMA LPD ( see Top Gun Oscillators ) to two digital signals. The MTEMA momentum oscillator is first applied to the price itself. Then, a rectification procedure is applied to the price based on the signals from the momentum oscillator yielding a rectified price signal. This s
FREE

FXDragunov.MyThemes. Forex Chart Color Themes.
Chart templates are responsible for chart layout and for contents of technical indicators applied to them.
Chart templates are used: When customizing an opened chart window. When customizing settings of a new chart window. When customizing a chart opened via the “New chart” window.
Original code by FXDragunov Indonesia
FREE

THIS FREE INDICATOR ALLOWS YOU TO SET THE TIMEFRAME OF THE MA YOU WANT ON YOUR CHART For example, it's very useful if you want to trade the H4 200 SMA using a lower timeframe chart, to identify price reactions such as reversals, Wyckoff schematics, etc. ***Please comment, rate and share it to your friends if you like it*** ------------------------------------------------------------------------- Moving averages are popular technical indicators used to identify trends, support and resistance leve
FREE

FuturePriceM15 - один из немногих индикаторов, который делает прогноз цены прямо на ценовом графике. Алгоритм расчета индикатора основан на быстром преобразовании Фурье. Имея колебательное поведение цены, функция Фурье прогнозирует ее поведение в дальнейшем. Индикатор устанавливается обычным образом на график с торговым инструментом указанным в переменной symbol с периодом M15 , данный временной период является самым оптимальным для работы с любыми торговыми символами. После установки, индикато
FREE
STANCO DI DOVER CALCOLARE IL LOTTO OGNI VOLTA? Questo indicatore lo farà per conto tuo, QUALSIASI SIA L'ASSET CHE SCEGLI, e tutto in circa 10 SECONDI !!!
ISTRUZIONI I passaggi da seguire sono rispettivamente: Mettere l'indicatore sul grafico dell'asset su cui si vuole operare.
Andare su "Valori di input ".
Inserire lo stop loss .
Scegliere il rischio in $ .
Potrai inoltre scegliere se calcolarlo in percentuale rispetto al denaro sul tuo account, o con un quantitativo fisso i denaro
FREE

Basket Stage Profit EA ΜΤ4 è il modo più avanzato per gestire un gruppo di ordini aperti in 3 diverse fasi (periodi di tempo) di profitto del paniere e infine per chiuderli tutti a qualsiasi profitto o perdita all'ora di fine desiderata.
Installazione del Prodotto | Basket Stage Profit EA MT4 Impostazioni/Guida agli Input | Aggiornamento di un Prodotto Acquistato
Caratteristiche Non vengono utilizzate Martingale, Grid, Averaging o altre tecniche pericolose Basket Tak
FREE

Support and Resistance Levels Arrow Indicator please leave 5 stars to me A support level is a level where the price tends to find support as it falls. This means that the price is more likely to "bounce" off this level rather than break through it. However, once the price has breached this level, by an amount exceeding some noise, it is likely to continue falling until meeting another support level. A resistance level is the opposite of a support level. It is where the price tends to find re
FREE

This Dashboard is free to download but is dependent on you owning the Advanced Trend Breaker . Get the indicator here: https://www.mql5.com/en/market/product/66335
The Dashboard will show you on a single chart all the timeframes (M1 to Monthly) with their own status for the indicator: Advanced Trend Breaker
all time frame and all symbol: smart algorithm detects the trend,Support and resistance, filters out market noise and find breaker of entry signals!!!
!!!
How to unders
FREE
!! FLASH SALE !! Over 80% off !! For ONE week only. Now only $47 - normally $297! >>> Ends on 30 June 2023 - Don't miss it!
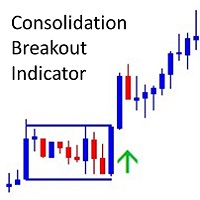
The Consolidation Breakout Alerts Indicator will revolutionize your trading strategy. Our innovative indicator offers unique buy and sell arrows when price breaks out from consolidation, allowing you to get in at the most optimal entry with minimal risk and maximum reward potential. Never again will you miss out on the lucrative trading opportunities available

Having more expert advisors running on the same account , eventually leads us to the question , which one of them are winners , or which are dragging down the account ? With this in mind I created this simple utility for displaying profits or losses taken by each expert advisor over time . This utility can be run as an expert advisor and can display up to 10 magic number results . If the inputs are left to zero , the results displayed are from the manually placed orders . It also displays depos
FREE

We stopped creatin small tools for MT4. Our focus are on MT5. Only very useful tools maybe we will develop to MT5. New Candle Alert is a simple indicator that notify you when a new candle is formed.
You can modify the notification message that will appear for you. The alarm sound is default by meta trader program.
MT5 version: https://www.mql5.com/pt/market/product/37986
Hope you enjoy it. Any doubt or suggestions please notify on private or by comments.
See ya.
FREE

Triple Exponential Moving Average Technical Indicator (TEMA) was developed by Patrick Mulloy and published in the "Technical Analysis of Stocks & Commodities" magazine. It works as the same as EMA. However, it provides smaller lags, even compared to Double EMA. Input Description: period: MA's period. Must be higher than 1. applied_price: Define the price to be applied. Use 1 of these integers. 0 -> applied_price is Close price 1 Open price 2 High price 3 Low price 4 Median price 5 Typical price
FREE

Indicator support for only: Entry Point to Trend Pro Link indicator support : https://www.mql5.com/en/market/product/70867
Supports all currency pairs declared in the definition. Help investors do not need to open many charts. Notice the DEAL: multiple time frames confluence M15, H1, H4.
Entry Point to Trend Pro The indicator helps investors to identify the earliest and perfect reversal point. Easy to make decision to trade with the trend Price action trading. support resistance
FREE

This indicator includes various types of moving averages. The indicator contains the following set of moving averages: CA (Cumulative Moving Average) MIN (Minimum for the period) MAX (Maximum for the period) SMA (Simple Moving Average) EMA (Exponential Moving Average) DMA (Double exponential moving average) TMA (Triple exponential moving average) LWMA (Linear Weighted Moving Average) SMM (Simple Moving Median) SMMA (Smoothed Moving Average) HMA (Hull Moving Average) NoLagMa The list of moving av
FREE

Salut!
Je suis Tatsuron, un investisseur individuel japonais. J'opérais plus d'un milliard de yens sur le Forex. Alors, permettez-moi de vous présenter un indicateur très utile que j'utilise.
Indicateur de type de confirmation environnementale. Nous avons réduit les pivots connus du marché mondial à deux, quotidiens et mensuels. Quotidien est un guide pour le trading quotidien, et mensuel est un matériau pour les cassures ou les renversements sur les marchés à rupture rapide.
Il est uti
FREE

Advisor "Cobra Throw" - designed to quickly accelerate your deposit in the Forex market. The advisor draws support and resistance levels based on data from one of the selected indicators - Moving Average, Bollinger_Band or Envelopes, and waits for the price to break through one of the lines. Then, after breaking through, the robot places a pending order with the expectation of a price rebound from a strong price level. If the price rebounds (this happens in most cases), the pending order is trig

This is a reduced version, demo if you like, of the published Elliott Wave Tool 7Pasos . The limitations for this tool vs Elliott Wave Tool 7pasos are the following: Only one account possible, the original tool has 1 principal and 4 alternative accounts. Only one degree (Primary) is available, in the original tool 12 different degrees (6 in micro) are at your disposition. As only one degree is available, the functions to upgrade and downgrade the degree of the selected wave are disabled. Fixed c
FREE

KF Trix V1.00 The triple exponential average (TRIX) indicator is an oscillator used to identify oversold and overbought markets and is also a momentum indicator. The triple smoothing of moving averages is designed to filter out price movements that are considered insignificant or unimportant. About Software details and MQL login link Copyright 2022, Forex KRAL
FREE

A simple and convenient utility for closing orders. It can close both all orders together as well as buy, sell or pending orders separately. Has an intuitive graphical interface. MT5 version of the utility - https://www.mql5.com/en/market/product/78599 If you like this utility, take a look at my other products - https://www.mql5.com/en/users/nina_yermolenko/seller
FREE

The Trend Finding Channels indicator was developed to help you determine the trend direction by drawing channels on the graphical screen. It draws all channels that can be trending autonomously. It helps you determine the direction of your trend. This indicator makes it easy for you to implement your strategies. The indicator has Down trend lines and Up trend lines. You can determine the price direction according to the multiplicity of the trend lines. For example , if the Down trend lines s
FREE

TopSecret TopSecret - automated adviser for professional work in the foreign exchange market. The decision-making algorithm is based on my own method. Statistical methods for a certain time interval is calculated the price level to which the current market price of the trading instrument is always likely to return. The adviser works on any time period, but I recommend working on H1, H4, D1 . The Expert Advisor is installed in the usual way and is immediately ready for operation.
Advisor Benefi
FREE

The indicator draws two simple moving averages using High and Low prices. The MA_High line is displayed when the moving average is directed downwards. It can be used for setting a stop order for a sell position. The MA_Low line is displayed when the moving average is directed upwards. It can be used for setting a stop order for a buy position. The indicator is used in the TrailingStop Expert Advisor. Parameters Period - period of calculation of the moving average. Deviation - rate of convergence
FREE
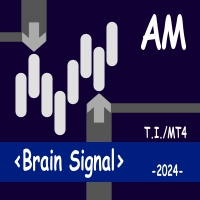
A popular signal indicator marking buy/sell points. Recommended for use in conjunction with a trend indicator to filter signals. The indicator has only one adjustable parameter that determines its sensitivity, which greatly simplifies setting the indicator to the current market and the user's trading style. The indicator can be used to trade any market. Its basic parameters perform well in most situations. At the same time, before starting trading, you should choose the most effective indicator
FREE

Expert Advisor designed for news trading. The news are downloaded from the Forex Factory, Investing.com, myfxbook.com websites. Make sure to add the URL to the terminal settings. The EA should be attached to each currency chart. In the Symbol News field, set the currency symbol for searching news in the calendar. Example: if the EA is attached to the AUDUSD chart, set Symbol News to AUD; if USDCAD, Symbol News - CAD, XAUUSD Symbol News - USD, and so on. Change the magic number for each chart, an
Sai perché MetaTrader Market è il posto migliore per vendere strategie di trading e indicatori tecnici? Non c'è bisogno di pubblicità o di protezione del software, nessun problema di pagamento. Tutto ciò è fornito da MetaTrader Market.
Ti stai perdendo delle opportunità di trading:
- App di trading gratuite
- Oltre 8.000 segnali per il copy trading
- Notizie economiche per esplorare i mercati finanziari
Registrazione
Accedi
Se non hai un account, registrati
Consenti l'uso dei cookie per accedere al sito MQL5.com.
Abilita le impostazioni necessarie nel browser, altrimenti non sarà possibile accedere.