YouTubeにあるマーケットチュートリアルビデオをご覧ください
ロボットや指標を購入する
仮想ホスティングで
EAを実行
EAを実行
ロボットや指標を購入前にテストする
マーケットで収入を得る
販売のためにプロダクトをプレゼンテーションする方法
MetaTrader 4のための新しいエキスパートアドバイザーとインディケータ - 278

EW Oscillator PRO is an indicator for MetaTrader 4 based on mathematical calculations on the price chart. This is one of the most common and useful indicators for finding the trend reversal points. EW Oscillator PRO is equipped with multiple types of notification (push notifications, emails, alerts), which allows opening trades in time. A panel for displaying the information on the indicator signals from different timeframes is located in the top left corner (see screenshot #2).
Distinctive fea
The EA identifies divergences in two correlated currency pairs and trades in the direction where they converge back. Working timeframe: M30
Input parameters MagicNumber - identification number for the EA. OrdersComment - comment to order, automatic if an empty value is set. Lots - lot size. DepoPer001Lot - automatic lot calculation (specify the balance per 0.01 lot) (if 0, the value from 'Lots' parameter is used). TimeFrame - working timeframe. Symbol #2 - correlated currency. Symbol #2 reverse
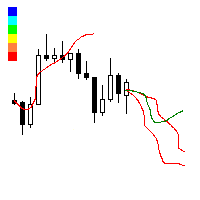
This utility searches the history for price patterns, which are similar to those present in the intervals selected by trader (there are several intervals, see the screenshot). The length of the pattern and selected intervals is the same and is given by the number of bars. The similarity is estimated by comparing the colors of bar bodies, sizes of bars' bodies and wicks. For all identified patterns, further movement of the price is visualized as lines. The color of lines determines the degree of
The presented indicator implements the idea embedded in the classic technical analysis indicators - "Bulls" / "Bears" at a new level. The "Bulls or Bears AM" indicator displays the difference between the maximum and minimum prices for the current period of time and the values of the channel built on the maximum and minimum prices for a longer period. The growth of the indicator values above zero indicates that the maximum price for the current period is greater than the average value of maxi

The Magneto Volume Trigger indicator is designed for determining the volume confirmed by the candlestick pattern and predicting the trend tendency.
Indicator setup and use The calculation of values is affected by two parameters - Period and Gate . The lower the value of Gate , the higher the sensitivity of the indicator. Period allows making a sample of data for the specified number of candles. The lower the value of Period , the more the indicator is adapted to the current market conditions. I

This utility is designed for testing the signal indicators (arrow or trend based). This utility allows quickly evaluating the efficiency of an indicator. To use this utility correctly, enter the exact name of your indicator in name_indicators. Then set filter 1 or 2, depending on the bar, where the order should be opened. Next, set the number of the buffer for buying and selling, set take profit and stop loss. The indicator is ready to be tested. This utility can be used in live trading as well.

As it is known, one of the winning parameters in Forex market is Money Management, which is more crucial than a good strategy. So it is good to know that there is a hidden fact in the market, so called pip's value. Most traders pay no attention to this fact. Here comes an example to brighten up. If you have an EUR account, pip's value for each 0.1 lots on EURGBP is around 1.10380 (it depends on the current rate) and on EURUSD is around 0.85050, it means if you take a trade on each of these curre

London Trader EA uses a breakout strategy that can be set to London Session, Tokyo Session, New York Session and Sydney Session.
Recommendations Time frame: H1 Pairs: EURJPY, EURCAD, EURAUD, CADCHF, USDCHF and other pairs can be used. Minimum Leverage: 1:100.
Benefit No martingale or No grid. Can be optimised to any markets time Session. Equity protection by Stop Loss application. EA has a safe mode option. Multicurrency EA.
Input parameters London Trade Time Start : London session opening ti
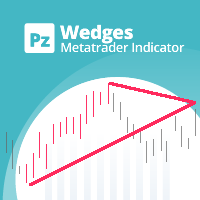
このインディケーターは ウェッジを 見つけます。 ウェッジ は、価格統合期間を囲む収束トレンドラインによって識別される継続パターンです。フォーメーションブレイクアウトと一緒にドンチャンブレイクアウトを使用してトレードを通知します。 [ インストールガイド | 更新ガイド | トラブルシューティング | よくある質問 | すべての製品 ] 使いやすい カスタマイズ可能な色とサイズ ブレイクアウト信号を実装します あらゆる種類のアラートを実装します
最適な使用法 オーバーラップする可能性があるすべてのサイズのウェッジを表示するには、異なるサイズ(6、12、18、24など)でインジケーターをチャートに数回ロードします。
入力パラメータ サイズ:検出されるパターンのサイズ。代替ポイント間のバーとして表されます ブレイクアウト期間:取引を通知するドンチャン期間
最大履歴バー:チャートで調べる過去のバーの量 強気パターンの色:このパラメーターは一目瞭然です 弱気パターンの色:このパラメーターは一目瞭然です 切れ目のないパターンの色:このパラメーターは一目瞭然です 線幅:パターン線のサイズ 強

The indicator shows and highlights the chart candles, which are formed as a result of large players entering the market in large volumes. Such candles can also be formed after achieving a certainty on the market, when most of the participants hold positions in the same direction. The movement is likely to continue in that direction after such candles. The indicator highlights the significant candles from the existing ones on the chart; The indicator allows identifying the trends based on candles

The HeLL_Cat Lite Expert Advisor is a powerful trading tool, suitable both for professionals and beginners. Its arsenal includes various strategies - the semi-automatic HeLL_Cat mode, the Safe mode and the News mode. The semi-automatic HeLL_Cat mode uses the adaptive trading strategy based on a neural network consisting of 4 interconnected logical cores. Unlike the other versions, HeLL_Cat Lite does not open the first order, it only manages the orders opened by user. A distinctive feature of thi

RSI Currency Strength Meter uses RSI (Relative Strength Index) to monitor how strong a currency is, or in other words, if it's being bought or sold by the majority compared to the other currencies. It displays the strength-lines of the currencies of the pair (base and counter currency of the chart) with changeable solid lines. Also, you can add up to five additional currencies to the "comparison pool". If you want to look and compare, for example, EUR, USD and JPY, it will only look at the EURUS

The HeLL_Cat PRO Expert Advisor is a powerful trading tool, suitable both for professionals and beginners. Its arsenal includes various strategies - the HeLL_Cat mode, the Safe mode and the News mode. The PRO version differs from the standard version in the added functionality of settings. The complete list of differences can be found in the documentation for the EA. The HeLL_Cat mode uses the adaptive trading strategy based on a neural network consisting of 4 interconnected logical cores. A dis

First RSI level indicator analyzes and displays the level, at which the first crossing of the standard RSI maximum or minimum value took place for the subsequent definition of strong trends. The indicator allows you to track the beginning of a trend that does not follow the signals of the standard RSI trading strategy, for example, when the price rushes downwards after reaching an oversold level instead of reversing. In this case, we have to conclude that a strong trend is underway and the next
FREE

This multicurrency strategy simultaneously determines the strength of the trends, entry points and the take profit levels for each trade. The indicator can determine entry points on any trading period from M1 to D1. For the convenience of users, the indicator renders the entry point (in the form of an arrow), recommended take profit levels (TP1, TP2, TP3) and the recommended stop loss level (SL1, SL2). The options for using the strategy are described below. Full description of the indicator Cosm

GOAL TIME is an expert advisor based on the notion of time, it studies the change of price according to time, and it finally detects the best time to execute a good order. The EA is based on an indicator that draws a price curve in relation to time, this curve is deduced by an algorithm that analyzes old data. Then, the EA exploits the generated curve and executes the correct order. In case of incorrect choice, the EA has the mission to limit the losses. After a thorough study of this strategy o
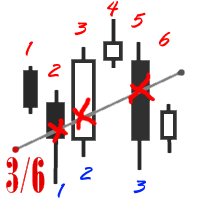
The utility simplifies the search for maximum bars accumulation levels. These levels can be used both for technical analysis and trading actions, like setting a stop loss or pending orders. Additional analytical methods are recommended for levels confirmation.
How it works Сounter mode (enabled by default). In the Сounter mode, draw a trend line on the chart and the utility will specify its length in bars as well as the number of bars the line crosses. When moving a trend line, the utility re-c
FREE

This indicator was modified according to the 'Way Of The Turtle'. The ATR indicator can be used as a reference to set stop-loss or take-profit, and also can be used to confirm the daily price range (also applicable to other cycles).
Calculation The true range value is calculated as follows: TR = MAX(H-L, H-PDC, PDC-L) Among them: H = Highest price of the current bar L = Lowest price of the current bar PDC = Close price of the previous bar The average true range in 'Way Of The Turtle' is calcula
FREE
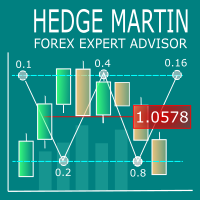
Hedge Martin Expert Advisor restores loss-making positions making them profitable by opening an opposite position with an increased lot.
Trading strategy The EA works on a trend market selecting the appropriate curency pairs. The robot trades depending on the previous candle direction. The first order is set according to the following rules: If the previous candle is bullish, the EA opens a buy order; If the previous candle is bearish, the EA opens a sell order; If the price goes in unfavorable
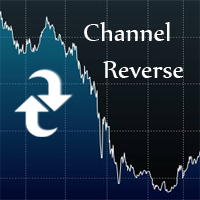
Channel hybrid of the Moving Average, Bollinger Bands, RSI and CCI indicators. Unique filtering of signals without redrawing the indicator allows making various trades - both medium-term and short-term. The indicator operation principle lies in searching for the market reversal patterns. The trend reversal detection method uses the channel Triangular Moving Average, which plots equidistant non-redrawing channels with a Deviation period specified in the settings. Comparison of TMA and Bollinger B
The main purpose of the QQ-Deep Binary indicator is to determine the direction of the sail marked for Binary Options. It works for any currency pair, presenting better result in volatile instruments. The indicator is designed to simplify market analysis, and is based on price pattern detection strategies combined with multi-currency econometric velocity. The development team is constantly improving the functionality of the indicator.
Indicator Advantages No repaint. Works on all currencies. Mus

The Magneto Reverse Signal indicator is based on the candlestick analysis. It identifies the reversal points.
Indicator setup and use Adjustment of the indicator is reduced to selection of parameters Period (left window of the panel) and Gate (right window of the panel). It is more convenient to adjust the settings using the control panel directly on the chart. In this case, you can immediately see which optimal parameters can be used in the current market. This method is shown in the video in

eaVeryActive is an Expert Advisor (Robot) for any financial instrument on the MT4 platform. All input parameters were optimized and used on EURUSD, M15 . Of course you are able to optimized those parameters for any currency pairs and time frames. The main input parameters are a, b, c, d, e, f, g and h , which can be any numbers in the range from 1 to 9 - input parameters (weight coefficients) of the one layer neural network. This robot will open as many position as you want by input parameter ma
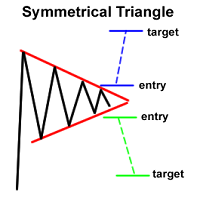
WARNING: due to the calculations used by this indicator, it may take time to load and running it may slow down the user's terminal
Description & Summary Dashboard to detect Higher-Low/Lower-High breakouts and Triangle Patterns on 28 currency pairs and up to 8 timeframes at once. Numbers on the left are the normalized values of distance between price and last Lower-High and Higher-Low if one has formed (displays "--" if none). Text will turn Red upon a Higher-Low Breakout and Green upon a Lower-

Chaos Trader Lite attempts to use aspects of chaos theory to place trades in the marketplace. This Expert Advisor, in particular, draws upon theories made by Bill Williams. Every version of MetaTrader contains the Bill Williams indicators. I wondered why was he deemed so important as to have his own set of indicators added to MetaTrader with name attribution. Conducting research I found that Bill Williams wrote a book using chaos theory to trade the markets. The Bill Williams indicators are usef
FREE

AR Canada is a fully automated trading robot optimized for USDCAD H1. This free version trades only a fixed lot with minimum volumes. No hedging, no martingale, no grid, no arbitrage, etc. The EA applies the trading algorithm based on crossing the moving averages. Take Profit and Stop Loss values are fixed and have a ratio of 1:4. Positions are closed by the EA when Take Profit or Stop Loss level is reached.
Parameters MagicNumber = 3 - unique EA magic number.
FREE
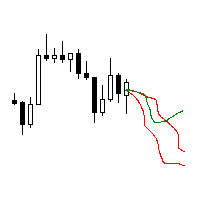
The utility searches the price history looking for the pattern similar to the one within a specified interval. The length of a pattern and a specified interval is the same and set in bars. Similarity is estimated by comparing the bars' body colors, size and shadows. The subsequent price movement is displayed as lines for all detected patterns. The color of the lines defines the degree of similarity. The movement length is set as a number of bars. Search for patterns and visualization are perform
FREE

This will be EA support trading. What is a 'Trailing Stop' A stop order that can be set at a defined percentage away from a security's current market price. A trailing stop for a long position would be set below the security’s current market price; for a short position, it would be set above the current price. A trailing stop is designed to protect gains by enabling a trade to remain open and continue to profit as long as the price is moving in the right direction, but closing the trade if the p

Proton EA is a Trend - Momentum Forex strategy that uses indicators to enter and exit orders. Proton EA allows you to change all parameters of the indicators selected for best results. This EA gives you the choice of whether to trade on Friday or not. The EA has a safe mode option which break even at stop loss to reduce losses. It has the ability to use trailing stops and is fully optimized for your needs. This EA has a customizable volume filter to protect you from unexpected volatility. It is

The Project Genesis Expert Advisor opens positions when the American session closes and the Asian session opens, and the price rolls back from the price channel boundaries. The buy orders are opened when the price is below the lower boundary of the Bollindger Bands channel, sell orders are opened when the price is below the lower boundary. The positions are closed based on multiple algorithms (when the price approaches the opposite boundary of the Bollinger Bands channel, when the maximum positi
This program does not open orders on its own, but instead monitors the active orders of the currency pair it is attached to. The EA sets the Take Profit (TP) or Trailing Stop (TS) levels for active market trades. If pending orders are triggered, the program recalculates the levels and modifies the previously placed trades. The program monitors SELL and BUY orders separately. For example, the program can close SELL trades using TS, and set TP for BUY trades.
Settings profit_Ord___BUY = 15 - prof
This indicator is based of the well-known Bollinger Bands indicator and provides for an easier operation with BB. It allows drawing up to 3 Bollinger channels and thus simplifies navigation in the list of indicators. Also it allows plotting Bollinger Bands of different timeframes, for example: draw BB on M5 timeframe with parameters: Period = 100, Timeframe = H1.
Inputs Value Mode - choosing different modes of working with the indicator StaticTimeFrame - the indicator draws Bollinger Bands from
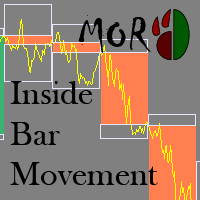
This indicator allows analyzing the movement of prices inside a bar. The indicator draws the contours of the bars of higher timeframes on the current chart.
Inputs Value TimeFrame - the timeframe to display bars NumberOfDays - the number of days the indicator calculates Bull_Body - the body color of the bullish bar Bear_Body - the body color of the bearish bar ShadowUp - the color of the upper shadow of the bar ShadowLow - the color of the lower shadow of the bar Selectable - enable/disable the
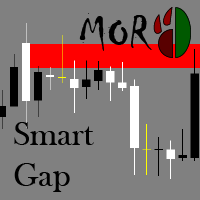
The indicator finds and visualizes price gaps, which often can be used as support and resistance levels. It can display levels from different timeframes on one chart.
Inputs Value Label - show/hide the timeframe of constructed levels TimeFrame - select timeframe to draw levels from DrawRangeDay - the length of the level in days DrawRangeHour - the length of the level in hours GapSizeForDrawing - a level will be drawn if gap is equal to or larger than this level in points CountDays - the number

IlanisNeuro is a modification of Ilanis . The EA uses averaging. Neural network is used for opening positions. The network has been trained on seven major currency pairs (EURUSD, GBPUSD, AUDUSD, NZDUSD, USDJPY, USDCHF, USDCAD) for the period 2004-2017. Real account monitoring: https://www.mql5.com/en/signals/author/fastinvestments The free version of the Expert Advisor: https://www.mql5.com/ru/market/product/25165
Ilanis Expert Advisor Does not require setting the parameters. Ready to work on E

The Magneto Precision Trend indicator is based on candlestick analysis. It determines the trend change on the previous candle, signal is not redrawn.
Indicator setup and use Increasing the Period parameter decreases the indicator sensitivity, resulting in less frequent changes in color but filtering the market noise. However, the trend change signals will arrive visually with a delay. And, conversely, decreasing the value of Period provides more accurate but more frequently changing signals. Th

This indicator helps to define the dominant trend. The Blue line and Red line changes at incrementations of the trends.
Parameters ki: factor of the delay. per: Displays the indicator period. Trend: Displays the Trend movements. Trend true.(false) X: moves the trend left and right. Y: moves the trend up and down. How to understand the status: If the arrow is blue, trend is up. If the arrow is red, trend is down.

The RiseTrading is a unique High quality and easy to use and affordable trading tool because we have incorporated a number of proprietary features and PowerSignal and MACD and Stochastic indicators. The main advantages of the trend trading strategy used by the Expert Advisor are opening positions only in the direction of a trend, ability for the long-term retention of profitable positions allowing users to achieve good combinations of profit/loss distributions. That can work on a real account at

This Expert Advisor implements elements of the Martingale system. Orders are opened at a specified distance from the moving average. The Parabolic SAR indicator and certain technical details are used to ensure the most accurate entries. The EA is highly customizable. It is recommended for simultaneous use on 4 currency pairs: EURUSD M15; GBPUSD M15; USDJPY M15; USDCAD M15. Despite good stability, it is advisable to disable the EA operation during the days rich in news releases.
Configurations P
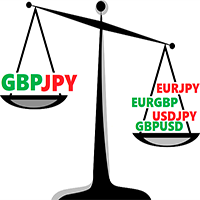
The Currency Strength Index Oscillator multicurrency trend oscillator shows the interaction of the indices of the current symbol's currencies calculated on the basis of the cross-rates of Majors.
Features Calculations are based on complete bars, therefore, it does not redraw. It works on any symbols that include the Majors (AUDJPY, AUDUSD, CHFJPY, EURAUD, EURCAD, EURCHF, EURGBP, EURJPY, EURUSD, GBPAUD, GBPCAD, GBPJPY, GBPCHF, GBPUSD, NZDJPY, NZDUSD, NZDCAD, USDCAD, USDCHF, USDJPY). It works on

TickStorm is the result of a 6 months team research and integrates a new approach in the art of ticks analysis. The EA operation algorithm uses retracements velocity to decide if there is a trading opportunity or not. These retracements are spotted by analyzing several ticks matrices on different periods of time and confronting them together in order to gain an edge over the market. We developed new tools to efficiently detect any unusual activity and we created an original and adaptive closing

Fix M15 mod is a fully automated short-term trading robot. The Expert Advisor does not use hedging, martingale, grid, arbitrage etc. Fix M15 mod opens a trade during the Asian session in a narrow channel defined by several last M15 bars. The EA opens only one trade in one direction that can be closed by a certain TP, SL or after a certain time (if the function is enabled in the settings). Basic EA settings are configured for trading USDCHF М15. The EA also shows positive dynamics on EURCHF, USDC

FXアドバイザー VR Locker は、ポジティブロックを利用したグリッドトレードに基づく自動売買戦略です。 ポジティブロックとは、取引口座において、売りポジションが買いポジションの上にあり、両方のポジションが同じロットで開設されている状態のことをいいます。 ファイルのセット、指示、素晴らしいボーナス 私に書いてください
アドバイザーの仕事の監視は 著者のプロフィールで見つけることができます Expert AdvisorはEURUSD通貨ペアのために開発されましたが、他の通貨や金融商品にも使用することができます。EAがどのように機能するかを理解するには、ストラテジーテスターまたはデモ口座でEAを実行するだけです。 VRロッカー は、同じ数量の2つの相反するポジションを開きます。価格の動向に応じて、アドバイザーは開始位置を「延長」し、正のロックを作成します。 ポジション間の距離が設定した距離以上になると、EAは新しいロックを作成するために進行します。 ロックで作業することで、トレーダーは「安全なクッション」として使用できる未確定利益の量を蓄積することができます。 アドバイザーと協働す
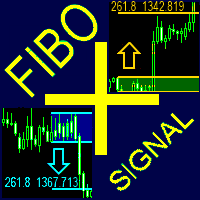
The FiboPlusSignal Expert Advisor. Automatic and manual trading on any instrument (symbol) and on any chart period. The operation algorithm is based on: Fibonacci retracement (5 different methods); calculation of trend direction using 14 indicators; support and resistance lines; horizontal support/resistance levels. Additional features: locking of orders (instead of setting stop loss); trailing stop based on Fibonacci retracement; alert system; visual panel for opening orders in manual trading –
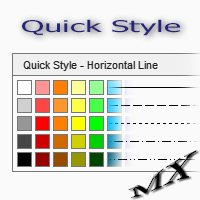
The Quick Style utility is designed for facilitation and acceleration of working with the properties of graphical objects. Left-click a graphical object while holding the Shift key to open the quick access window for configuring the object properties. In the window, you can change the color, style and line width with one click, including those of other graphical objects. All changes are displayed immediately. To close the Quick Style , simply click the free space on the chart. The utility is eas
FREE

Think of the rarest pair you can think of. And I assure you that this indicator can compute it's strength. This Currency Meter will literally calculate any currency pairs, either it is the Major Pairs, Metals, CFD's, Commodities, Crypto Currency like Bitcoin/BTC or Ethereum/ETH and even stocks. Just name it and you will get it! There is no currency pair this Currency Meter can solve. No matter how rare or exotic is that currency, it will always be solved by this Currency meter which on a real-ti
The Expert Advisor strategy is based on the moving average channel breakthrough. VSP is required for flawless operation, the recommended minimum deposit is 1000 units of the base currency. The EA is to be used on M5-H1 of highly liquid currency pairs with a small spread/commission (for example, EURUSD, GBPUSD, AUDUSD, USDJPY, USDCHF, USDCAD, NZDUSD, EURJPY, EURGBP and EURCHF). Features The EA features a predictive algorithm based on price patterns, as well as stop loss and take profit levels; Cu

Project Future is a professional arrow indicator with notification functions (alert, email, mobile). Advantages of the indicator Suitable for scalping and intraday trading. Simple and easy indicator configuration. Works on all timeframes. Does not redraw. It can be used in any financial markets: FOREX, CFD, binary options, stocks. It can be used as a stand-alone tool or in conjunction with other indicators. Sending signals to email and mobile devices.
Recommended symbols USDCAD, USDJPY, GBPUSD,

This Expert Advisor is a combination of different Forex strategies. Hedging - The use of this strategy is two-fold. First, it used to minimized drawdown of losing trades. Second, it is used to lock-in profit of winning trades. Scale-in - This method is implemented to increase profit of winning direction. Averaging - This method is implemented to factor in both winning and losing trades and to make sure if all trades are closed with positive profit.
Environment Broker : The EA can work with ECN,

Risepanel helps you open positions, close positions and analyze currencies. It works any time frame. For calculations to be correct, your account currency must be USD, EUR or GBP.
Features Market information. Orders and Pending Orders (Stop & Limit). 8 kinds of Pending by trend line. Specifications and Margin Calculation Required by Buy or Sell. Calculate and determine Stop Loss by pip, currency pair price, monetary value and percentage of risk. Calculate and determine the take profit by pip, t
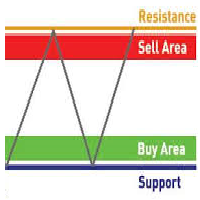
This is a Multiple Time Frames and Multiple Currency Pairs Indicator ( Score Board ) that shows Support and Resistance Levels from all TFs for 15 currency pairs by your choice. Support terminology refers to prices on a chart that tend to act as a floor by preventing the price of an asset from being pushed downward and can be a good buying opportunity because this is generally the area where market participants see good value and start to push prices higher again. Resistance terminology refers to
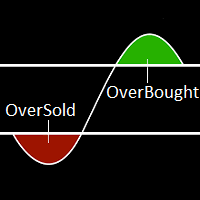
The term Overbought describes a period of time where there has been a significant and consistent upward move in price over a period of time without much pullback. The term Oversold describes a period of time where there has been a significant and consistent downward move in price over a period of time without much pullback. Because price cannot move in one direction forever, price will turn around at some point. This indicator will show a Magenta arrow in case of Overbought condition and Aqua ar
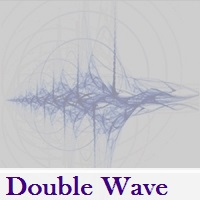
Double Wave applies standard indicators, volatility, volume and a number of custom approaches allowing for efficient combination of all mentioned tools. The indicator allows you to define possible price reversal points both in the direction of a trend (preferable) and against it. Also the indicator assists in determining the trend and visualizes it by displaying a histogram. The indicator works with any symbol provided that you have sufficient history data for a timeframe the indicator is launch

Volume Analysis Trader looks at volume using a fixed average of volume. This averaging helps spot when volume is rising or declining. Also I have added volume spikes which are when volume suddenly is above the average. These help spot market reversals. This will hep a trader look for the following in their trading: Rising volume during a rally shows trend is strong. Falling volume on a rally shows trend is weakening. As a rule of thumb on daily charts if current volume is higher than yesterday's
FREE

MA And Oscillation simple system that overcomes all the market confusion by simply looking at the moving average and stochastic oscillator and signalling when the moving average and stochastic or heading in same direction. The moving average is arguably the simplest but most effective tool when trading larger timeframes. We use this and the Oscillator to time our market entry. Features :
A method of simplifying a sometimes confusing market. Choose if you want to signal only when moving average
FREE

This indicator is designed for calculating the value of points for the specified lot sizes. The MT5 version is here https://www.mql5.com/en/market/product/29230 Description by lines Line 1 - deposit currency. Line 2 - lot size (10 input parameters) . All further values are calculated into columns below each lot size. Line 3 - calculation of value for one point. Line 4 - calculation of value for spread. All subsequent lines - calculation of value for points (20 input parameters) . All you need t
FREE

The indicator identifies the trend change points. Does not redraw. Calculation is done on an active candle. Lines crossing is used as a trend change point. If the price is above the two lines, there is an uptrend. If the price is below the two lines, there is a downtrend. The indicator allows you to accurately enter the market during a trend change. It can also be used in custom strategies on a detected trend. 3 modes of notification on trend changes. Sound, arrows, sending push-notifications. I

OneClick Trades Panel Basic is a utility software created to open and also manage the open orders by closing each trades accordingly right from your charts. This version has few buttons and they are to open Buy and Sell trades, and also buttons to close Buy, Sell and all orders (both Buy and Sell) simultaneously. This is a basic version with minimal features.
Features Buy - button used to open a Buy trades. Sell - button used to open Sell trades. Close Buy - button used to close Buy trades. Clo

A mathematical trading system based on the principle of a neural network. It uses more than a thousand of the most stable trading algorithms in its work. Before getting into the general database of algorithms, each block of conditions has passed the testing for stability with the identification of certain market dependencies for that block. A network created in such a way allows the EA to automatically select the most optimal variant of response to the market situation from more than a thousand

Algo Mtf is a multi timeframe indicator that can inform you about the situation of the indicators placed on other timeframes. This indicator has the possibility to offer a series of algorithmic calculations such as: RSI, Vortex, MACD, Momentum, Stocastic and ATR. The zones are colored in base of levels of this indicators on the chosen timeframe.
The confluence observation offers excellent operational tips and allows you to identify the trend tendency. The indicator is very efficient and an indis
Plotter is an indicator that was created during the ICT mentorship to make charting quick, easy and fun for everybody. Assign a function to any hotkey in indicator settings or use the default keys to perform smart actions that usually takes a lot of time to perform. Click on any bar, press OHLCMBVPOKJH to plot objects, color them with keys 0-9 or modify them with keys ERAZ and much much more. Indicator settings are described below. CHART SETTINGS gmt_offset auto -23 - 23 daylightsavings= set dst

Ema Dashboard is an innovative dashboard that allows you to monitor Moving Average on multiples symbols and different timeframes. This dashboard allows you to analyze information on 28 pairs on an unique chart. Its functionality includes analysis of All Time Frames. This configuration allows you to identify the Long Term Trend with extreme ease. This panel allows you to take very important directional movements. A click on button opens a new chart (symbol and timeframe).
Graphic Object Symbol l

Breaking News Expert Advisor is a state-of-the-art news trading system. The EA analyzes the market during the most critical news announcement periods and determines the entry levels based on the finding of price fluctuations during that periods. The direction of the trade is determined by the EA's clever adaptive system. The unique clever way the EA auto-manages your trades cuts drawdowns to the minimum enabling you to start with a low balance like $50. The EA has a minimum set of inputs for sim

NIZMA is a ready-made trading system, that is the most efficient on the EURUSD, AUDUSD and GBPUSD currency pairs. The best timeframes are M5 and higher. The system shows the market entry points in the form of arrows, and also displays the information on the strength and direction of the trend. The signals are easy to interpret. It is suitable for both novice and professional traders. With the properly selected settings, it gives the minimum number of false signals. In tests, this number did not

Unity Basket WPR (William's Percent Range) indicator combines serveral pairs' WPR to a combined basket of your defined base currency. This gives you clear trading signals along with potential TP and SL. Use the indicator along with other indicators, like ATR, to avoid flat market situations and an indicator showing you the overall trend like an MA (50). Trade with the trend.
Settings Basket pairs - comma separated list of pairs (default: EURUSD,EURJPY,EURCHF,EURGBP,EURNZD,EURCAD,EURAUD) Period

TCD (Trend Convergence Divergence) is based on the standard MACD indicator with modified calculations. It displays the trend strength, its impulses and rollbacks. TCD consists of two histograms, the first one shows the main trend, while the second done displays the impulses and rollbacks. The advantages of the indicator include: trading along the trend, entering the market when impulses occur, trading based on divergence of the main trend and divergence of the rollbacks.
Input parameters Show_S

VR Black Box トレーディング ロボットは、人気があり実績のあるトレンドフォロー戦略に基づいています。数年間にわたって、定期的なアップデートと新しいアイデアの導入を通じて、ライブ取引口座で改善されてきました。このおかげで、VR Black Box は初心者と経験豊富なトレーダーの両方を感動させる強力でユニークな取引ロボットになりました。ロボットをよく知り、その有効性を評価するには、ロボットをデモアカウントにインストールし、数日または数週間結果を観察するだけで十分です。 セットファイル、製品のデモ版、説明書、特典が入手可能 [ブログ]
のバージョン [MetaTrader 5] 何が得られますか 開発者からのファイルの設定 無料のプログラムと手順のアップデート。 無料の技術サポート。 20 製品アクティベーション。 動作モードと戦略 ランダムポジションオープンモード(表と裏) 代替位置開放モード 買いまたは売りポジションを同時にオープンするモード 取引モードのみ購入 売りのみ取引モード 負けたトレーダーの取引を撤退するためのモード 推奨事項: シンボル 外国為替、仮想通貨、金

The Grid Trader Expert Advisor is a very special algorithm that allows traders to benefit from sideways markets. It trades long and short sides separately and creates two different grids according to its setting. Each side has its account and virtual take profit, determined in money. EA also uses virtual stop loss based on the account's percentage amount. Traders can work with a classic grid where the distance between orders is fixed or choose a more "adaptive" dynamic grid with ATR-based d

The fully automated Yellow EA works on short-term trend changes creating the price "corridor" set in the parameters. Trading is carried out at the external borders of this corridor by opening positions in different directions with different lot sizes.
Version of Yellow Expert Advisor for MetaTrader5 .
The strategy is simple, but effective.
Presence of a sufficient number of parameters allows trader to customize the advisor in accordance with his trading style.
Telegram: https://t.me/realfor

Perfection is a multicurrency, fully automated and secure trading robot. The robot is designed for both portfolio trading and trading a single instrument. The EA does not use averaging methods, the volume of positions is strictly regulated. Orders are opened only in the direction of market movement in a grid. Due to this, the robot operates efficiently on any strong movements. The decision making algorithm does not use indicators. Instead, the robot automatically calculates the key levels, which
MetaTraderマーケットが取引戦略とテクニカル指標を販売するための最適な場所である理由をご存じですか?宣伝もソフトウェア保護も必要なく、支払いのトラブルもないことです。これらはすべて、MetaTraderマーケットで提供されます。
取引の機会を逃しています。
- 無料取引アプリ
- 8千を超えるシグナルをコピー
- 金融ニュースで金融マーケットを探索
新規登録
ログイン