YouTubeにあるマーケットチュートリアルビデオをご覧ください
ロボットや指標を購入する
仮想ホスティングで
EAを実行
EAを実行
ロボットや指標を購入前にテストする
マーケットで収入を得る
販売のためにプロダクトをプレゼンテーションする方法
MetaTrader 4のための新しいエキスパートアドバイザーとインディケータ - 273

Deals Utility is designed to manage any opened and pending order. It can handle orders by adding SL/TP, Trailing or Breakeven.
How to use Apply this Utility to any chart and set input parameters at your discretion. When you open any Market or Pending order, this utility adds SL/TP immediately. It will not process any order with magic number, so other EA's can work with this. It will manage Forex, Metal and Energy symbols. Other EA's can work with this because it will not handle any order with m
FREE

Displays multiple indicators, across multiple timeframes and symbols to give a comprehensive overview of the market. Uniquely, the indicators are configurable and can include custom indicators, even those where you just have the ex4 file or those purchased from Market. Standard indicators can also be selected, the default being ADX, CCI, market price above/below Moving Average (MA), Moving Average Cross (MAX), MACD, Momentum (MOM), OsMA, RSI, Parabolic SAR, William's Percentage Range (WPR). Use

Tarantula is a trend Expert Advisor that looks for entry points based on the standard Moving Average indicator. It works with two timeframes selected in the settings. The EA looks for the points of trend change and opens an order when the signal matches on different timeframes. All orders are protected by stop loss. However almost all orders are closed by the EA on a signal change.
Parameters SL - stop loss. TP - take profit. OnWork_1 - enable/disable searching for signals on the first timefram
FREE

This is an expanded version of the Time Levels indicator provided with sound alerts notifying of level intersection. The indicator is designed for displaying the following price levels on the chart: Previous day's high and low. Previous week's high and low. Previous month's high and low. Each of the level types is customizable. In the indicator settings, you set line style, line color, enable or disable separate levels. This version is provided with an option for alerting using an audio signal a

This Utility is a tool to manage level of profits or losses for each order without using stop loss or take profit. The Utility applies virtual levels to close orders in profit or loss. You can use the robot to manage manually opened orders or manage orders opened by another EA.
You can to get the source code from here .
Parameters OrdersManage - orders to manage (all orders of all symbols or orders on the current chart). Stop Loss Pips - virtual stop loss level. Take Profit Pips - virtual take
FREE

The indicator is designed for displaying the following price levels on the chart: Previous day's high and low. Previous week's high and low. Previous month's high and low. Each of the level types is customizable. In the indicator settings, you set line style, line color, enable or disable separate levels. The version of the exact same indicator but only with sound alerts there - Time Levels with Alerts .
Configurations ----Day------------------------------------------------- DayLevels - enable/
FREE
With this utility, switching the object visibility for individual objects has never been easier. This will help eliminate the clutter that plagues MetaTrader 4 traders when they create objects and then go to a higher timeframe and see that the objects interfere with the visibility of the chart. The demo version of Visibility Switch only works on the EURUSD currency pair. The full version of Visibility Switch can be found here. By default, every new object created has its visibility set to the cu
FREE

Market Sponge EA is a fully automated Expert Advisor based on the RSI indicator and a custom home made algorithm who constantly analyzes the market to determine the best times to place orders that are confirmed by the RSI. This one is fully parametrable which gives you a great control over what the EA can do. Use this EA on EURCHF with the default settings if you want to use it on another Symbol you will need to optimize parameters. Basic settings are optimized and I will update them every 6 mon

Optimizes the value of overbought and oversold on each new bar. This expert strives to choose the best values for a simple strategy where it sells when the indicator crosses below an overbought level and executes a buy when it crosses above an oversold level. The best overbought and oversold level is calculated on each new bar according to how that value would have performed during the optimizing periods which can be specified.
Inputs Unique number for this EA - can be any integer value. Optimi
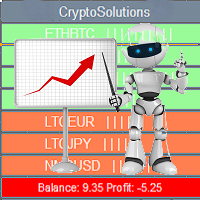
This indicator shows the current situation on the cryptocurrencies available for trading, depending on the signal strength specified in the settings. It can be used for determining the expected increase/decrease in the asset price, displayed by the corresponding color, and the signal strength, displayed by a vertical dash near a certain cryptocurrency pair. Indicator Parameters Panel color - color of the indicator panel Long color - cryptocurrency pair uptrend color Short color - cryptocurrency

TrendySignalMt4l is a trend-following indicator that quickly responds to a trend change. The indicator forms the line so that it is always located above or below the chart depending on a trend. This allows using the indicator both for a trend analysis and setting stop loss and take profit. The indicator should be attached in the usual way. It works on any timeframe from M1 to MN and with any trading symbols. The indicator has no configurable inputs.
Recommendations on working with the indicator
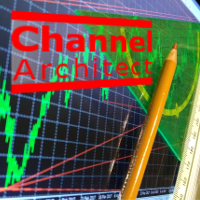
This indicator calculates and draws lines over the chart. There are two types of channels: Channel A: the mainline is drawn using local lows for uptrends and local highs for downtrends Channel B: the mainline is drawn using local highs for uptrends and local lows for downtrends The parallel lines of both types are built using the max. fractal between the base points of the mainline. There are a few conditions, which have to be fullfilled and can be changed by the parameters (see also picture 4):

"Still" is a trend-based Expert Advisor that looks for trend changes and opens orders in the direction of the new trend. The Moving Average indicator is used as the main signal supplemented by additional integrated confirmation functions. Whenever the signal changes, the opened orders are closed and a new order is opened. Stop levels are used for safety purposes. The EA is tied to the current timeframe. Recommended timeframes are H1 and M30. It can also work on M15 and M5. The recommended curren

This indicator displays the signals of the ADX indicator (Average Directional Movement Index) as points on the chart. This facilitates the visual identification of signals. The indicator also features alerts (pop-up message boxes) and sending signals to e-mail.
Parameters Period - averaging period. Apply to - price used for calculations: Close, Open, High, Low, Median (high+low)/2, Typical (high+low+close)/3, Weighted Close (high+low+close+close)/4. Alert - enable/disable alerts. EMail - enable
The Expert Advisor is based on Williams` Percent Range. The EA trades both during low volatility and a trend if MACD is enabled. Two Williams` Percent Range indicators can be used to enter a trade with different parameters, while the third one can be configured to close a trade. Besides, the EA has the trailing stop and stop loss calculation functions depending on the currency pair movement strength.
Inputs Lots - lot size (if 0, the lot volume is calculated based on the % of account free margi

LevelUP is a fully automated Expert Advisor trading robot. It applies cutting edge "Key level Break Out" strategy. Slippage and trade execution delay can’t be avoided for breakout trading system. However, LevelUP applies pending orders instead of market orders to improve those issues. Also, LevelUP implements algorithms for limiting its trading hours and you may specify the most effective trading hours based on your optimization. And there is trailing stop system to secure accumulated profits. W

Colored trend indicator advanced is a trend indicator that is based on Fast Moving Average and Slow Moving Average and also uses RSI and Momentum to give a trend strength in percent. It is aimed to find more healthy trends with this indicator. This indicator can be used alone as a trend indicator.
Colors (Default) Green = Uptrend (Default) Red = Downtrend No color = No trend, no good trend
Indicator Parameters WarnPosTrendchange: Warns you when the trend may change. FullColor: See screenshot.

Mr. Fibonacci は、チャート上でフィボナッチレベルを描画および調整するプロセスを簡素化するように設計された素晴らしいインジケーターです。このインジケーターはプロのトレーダーに優れたカスタマイズ オプションを提供し、あらゆるフィボナッチ レベルを正確に描画できるようにします。さらに、価格がフィボナッチレベルに入ったときにモバイル通知、電子メールアラート、ポップアップアラートを提供し、潜在的な取引機会を決して逃さないようにします。 このインジケーターを使用すると、フィボナッチレベルに達するまで価格変動を常に監視する必要がなくなります。代わりに、モバイル通知や電子メール アラートを利用して最新情報を入手できます。これにより貴重な時間が節約され、取引戦略の他の側面に集中できるようになります。さらに、フィボナッチ氏は、フィボナッチ レベルがポイントツーポイントで正しく描画されることを保証します。これは、正確な分析と意思決定にとって非常に重要です。 ユーザーフレンドリーなインターフェイスとクイックアクセスボタンにより、Mr. Fibonacci は使いやすく、ナビゲートしやすくなります

Better Scrollは、スクロール時にMT4のAutoScroll機能を有効または無効にし、機能をより直感的で便利に感じさせます。 オートスクロールを手動で有効または無効にしたり、バックテストや過去の価格データを確認しているときにオフにするのを忘れたためにチャートの最後に移動する必要がなくなりました。 概要
AutoScrollは、次の場合に無効になります。
マウスクリック+左ドラッグ(現在開いているキャンドルを過ぎた) マウスホイールを左にスクロール(現在開いているキャンドルを過ぎた) PageUpキーが押されました ホームキーが押されました 左矢印キーが押されました(現在開いているキャンドルを過ぎて) 市場は閉鎖されています
AutoScrollは、次の場合に有効になります。 マウスクリック+右ドラッグ(現在キャンドルを開くには) マウスホイール右にスクロール(現在キャンドルを開く) ページダウンキーが押されました(現在キャンドルを開くため) エンドキーが押されました 右矢印キーが押されました(現在キャンドルを開くため) Metatrader 4の生活の質を向上させる他のユ

STO Currency Strength Meter uses Stochastic Oscillator to monitor how strong a currency is, or in other words, if it's being bought or sold by the majority compared to the other currencies. It displays the strength-lines of the currencies of the pair (base and counter currencies of the chart) with changeable solid lines. Also, you can add up to five additional currencies to the "comparison pool". If you want to look and compare, for example, EUR, USD and JPY, it will only look at the EURUSD, USD

Early Morning Scalper ATR ( 以下 EMS ATR) は、いわゆる朝スキャタイプの Expert Adviser (EA) です。システムトレード用のプログラムとして組まれており、月曜日から金曜日までの特定の時間帯でのみ動作するように設計されています。 EMS ATR には複雑なアルゴリズムと内部搭載のインジケーターを用いて市場の状況を分析します。プライスレンジを計算してその動きの強さを分析し、その結果最適なタイミングであると判断した場合にポジションを持ちます。 Stop Loss と Take Profit を持っていますのでユーザーのアカウントバランスを保護しながらトレードをしかけます。他にも EMS ATR にはアドバンスド・トレーリングや内部アルゴリズムを備えているので、マーケットの動向を賢く判断しながらベストな「逃げ時」をうかがいます。マーケットが好ましくない状況になれば、開いているポジションを閉じて設けを確保したり、損失をおさえます。 Spread と slippage フィルターを備えているので、ボラティリティが高くて不利な状況でのエントリーを

Grid Expert Advisor with floating step. The strategy of this EA is based on the main idea of trading - "Buy Low & Sell High". Pending orders "slip" behind the price in order to open a buy or sell order at an optimal price. The EA has several tactical techniques to reduce the loss.
Features Grid Expert Advisors have a serious drawback. It consists in the fact that there is a high risk of the deposit drawdown as a result of imbalance in a large number of BUY or SELL orders. This EA contains prote

Features: Generates BUY / SELL Signals for easy to use: You do not need to read or understand market trend lines on indicators. Quantina Bitcoin Indicator shows a little Red Arrow for SELL and a little Green Arrow for the BUY entry points above- and under - the actual bars. (Green = Bullish Trend , Red = Bearish Trend). Measured Signal Strength also has written on the chart for advanced traders. Working on every known currency pairs: It's working on major-, minor-, and cross - pairs too. Also, Q

This long-term trading system works on 12 pairs and 4 timeframes . The Expert Advisor uses various trading systems, such as trend trading, counter-trend trading and others. This increases the chances of sustained growth and reduces exposure to a single pair or individual operations. The risk is tightly controlled.
/>
The EA has the built-in smart adaptive profit taking filter. The robot has been optimized for each currency and timeframe simultaneously. It does not need arrival of every tick and

Quantina Multi Indicator Reader can analyse up to 12 most popular and commonly used together indicators in seconds on any timeframe, on any currency pair, stocks or indices. On the chart panel you can easily read each indicators default meanings and also there is an Indicators Summary on panel.
Features 1 file only: Quantina Multi Indicator Reader is 1 file only. No need to install other indicators to work. It is using the built-in indicators from MetaTrader 4 terminal. Detailed Alert Message:

It is a fully automated trading Expert Advisor, whose algorithm is based on trading using pending orders at the high and low of the daily working channel. StopLoss and TakeProfit are set manually by the trader, which provides ample opportunities for Expert Advisor optimization. When the UseTrall function is enabled, the EA only uses TakeProfit without setting a fixed StopLoss level. Upon reaching the specified profit target level, the EA sets StopLoss at the specified NoLossLevel distance from t
FREE

iSTOCH in iMA is an indicator which applies the stochastic changes to the iMA. Changes are reflected by altering the moving average colors. It is a useful tool to see easily the upsides or downsides of the stochastic.
You can to get source code from here .
Parameters MA_Periods - iMA period. MA_Method - iMA method. K_Period - K line period. D_Period - D line period. Slowind - slowing. STOCH_MA_METHOD - averaging method for MA. PriceField - price (Low/High or Close/Close). STOCH_LevelUp - uptre
FREE

The Expert Advisor is based on a breakout strategy. Market entry signals are generated when the price crosses the border of a certain price range. We created the strategy using historical data with the 99.9% quality data over the past 15 years. We have selected highest-quality signals and eliminated low-quality ones. The EA performs technical analysis and takes into account only those breakdowns that show the best result. The EA uses filtration of false signals. It uses an adaptive trailing stop

Attention! Friends, since there have been many scammers on the Internet recently selling indicators called ForexGump, we decided to warn you that only on our page is the LICENSE AUTHOR'S VERSION of the INDICATOR sold! We do not sell this indicator on other sites at a price lower than this! All indicators are sold cheaper - fakes! And even more often sold demo versions that stop working in a week! Therefore, in order not to risk your money, buy this indicator only on this site!
Forex Gump Pro is

Overview It only needs a small initial deposit. Suitable for multi-currency trading. Immunity to the large delay and the size of the spread. Monitoring of my accounts : https://www.mql5.com/en/signals/author/mizrael
How it works After launching the EA on a chart, the EA remembers the first order's Open level. The EA sets a Sell order grid above it. A Buy order grid is set below it. If the total profit of Buy and Sell orders exceeds the value of the Profit parameter, the EA closes the order d

The Elize Expert Advisor has been designed to work with the EURCHF currency pair. It considers the peculiarities of this trading instrument, its behavior and dependence on the behavior of other currencies. In particular, when the currencies of the European countries (EURUSD, GBPUSD, EURNOK, EURCHF) move in the same direction, the EA starts its operation and opens a deal in the trend direction of the European currencies. In the event of price rollbacks, the EA uses a unique method for making the

Three MA Alert インジケーターは 、移動平均クロスオーバー戦略 に依存するトレーダーにとって不可欠なツールです。モバイル デバイスや電子メールに通知を送信し、3 つの移動平均が交差するたびに音付きのポップアップ アラートを表示することで、取引生活を簡素化します。この広く使用されているテクニックに従うことで、常にトレンドの正しい側にいることを保証し、一般的な市場の方向に逆らった取引を避けることができます。 Three MA Alert インジケーターを使用すると、移動平均のクロスオーバーを座って待つ必要はもうありません。モバイル デバイスに通知が到着してアラート音が鳴るのを待っている間、家族と有意義な時間を過ごしたり、他のアクティビティに参加したりできます。このインジケーターのデフォルト設定は、30 分以上の時間枠、特に EUR/USD 通貨ペアに完全に適しています。 このインジケーターの驚くべき価値ある機能は、各ローソク足の実際の出来高情報を取得できることです。買い手と売り手の争いを総取引高に対するパーセンテージとして計算し、チャートに表示します。この情報は、取引に入る前

CCI Currency Strength Meter uses CCI (Commodity Channel Index) to monitor how strong a currency is, or in other words, if it's being bought or sold by the majority compared to the other currencies. If you load this indicator on a chart, it will first display the strength-lines of the currencies (base and counter currency of the chart) with changeable solid lines. Also, you can add up to five additional currencies to the "comparison pool," that already has the base and the profit (counter) curren

IMA Recover Loss is the expert advisor based on moving average and some technical indicators. This concept uses statistical tools that help in price analysis. By creating a trend line to find trading signals. This expert advisor has developed and improved the moving average to work well with current data and reduce delays. Long and Short Trade Signals: The method for using the Multiple Moving Average indicator is to trade a basic moving average crossover system using all of the MAs. This system

Requirement for the EA use: the EA needs a low spread (recommended spread value is 2) and minimum slippage! Systems that operate based on Bollinger waves signals are considered to be among the most popular well performing systems. This Expert Advisor belongs to such systems. In addition to Bollinger waves, the Expert Advisor uses the following indicators: Stochastic, RSI and Moving Average. Recommended Expert Advisor operation time is from 00:05 to 08:00 (the interval between the close of the A
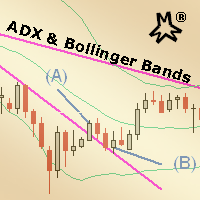
MMM ADX & Bollinger Bands strategy: This EA's strategy combines 2 built-in indicators to enhance its signals and decide to open a new order at the right time, there is an ADX indicator and you may choose its signal's strength and a Bollinger Bands indicator confirms the trends and a MA to check if the prices are deviating from its pattern. By joining both indicators' data and the moving average, it is possible to calculate quality signals, avoiding sudden market movements against your trading op
The EA is based on price crossing the High or Low of a Moving Average. Advance Fractal profit taking method. Advance stop management option based on explosive candles (Big Candles). Loss recovery system making recovery of losses easier. Configured the EA to match your trading style. Scalping, Swing Trading or Trend Trading. Three custom trailing stop options. Explosive candle stop management with partial closure. Advance fractal partial close profit taking Two indicator filters Time filter wit

ReviewCandleChart is a unique product that can verify past price fluctuations using candlestick charts. This indicator accurately reproduces market price fluctuations in the past and can make trading decisions (entries, profits, loss cut) many times so that you can learn the trading faster. ReviewCandleCahrt is the best indicator to improve trading skills. ReviewCandleCahrt caters to both beginners and advanced traders.
Advantages of the indicator This Indicator for verifying price fluctuation
FREE

ReviewCandleChart is a unique product that can verify past price fluctuations using candlestick charts. This indicator accurately reproduces market price fluctuations in the past and can make trading decisions (entries, profits, loss cut) many times so that you can learn the trading faster. ReviewCandleCahrt is the best indicator to improve trading skills. ReviewCandleCahrt caters to both beginners and advanced traders. Advantages of the indicator This Indicator for verifying price fluctuation u
This indicator analyzes in parallel price charts for multiple currency pairs on all timeframes and notifies you as soon as a double tops or double bottoms pattern has been identified.
Definition Double Top / Double Bottom pattern Double Top is a trend reversal pattern which are made up of two consecutive peaks that are more and less equal with a trough in-between. This pattern is a clear illustration of a battle between buyers and sellers. The buyers are attempting to push the security but are

Requirement for the EA use : the EA needs a low spread (recommended spread value is 2) and minimum slippage! Systems that operate based on Bollinger waves signals are considered to be among the systems with the best results and reliability. The Oblivion Expert Advisor also belongs to such systems. In addition to Bollinger waves, the Expert Advisor uses the following indicators: Stochastic and Moving Average. The EA does not use Martingale and grid systems! Recommended Expert Advisor operation t
FREE

Quantum Theory is a fully automated Expert Advisor based on the principle of scalping in the distribution of data in the sample and the distance between individual data points to the mean or average sample values. In Statistics, the data area between +/- 1 standard deviations will be 68.2%, the data area between +/- 2 standard deviations will be around 95.4%, and the data area between +/- 3 standard deviations will range from 99.7%. The Expert Advisor works with Stop loss, The Larry Williams Per

FX Master Expert Advisor opens positions at breakthroughs of support and resistance levels.
The EA trades during both trend and flat movements with no need to adjust parameters.
The EA uses the minimum stop loss (250 points) allowing the efficient use of funds and risk management.
Working timeframe: 1H
Recomended params for trading - all default values, excluding Filtration: AUDUSD=8, EURUSD, GBPUSD, USDCAD =12, USDCHF = 28
Note! Use "Every tick" mode when testing the EA!
Inputs Fix_Lot

Do you need detailed info from different magic numbers trading on the same account? This is your product. Detailed Magics, allows you to know profit, profit factor... of each magic number, so you will know which strategy is working best. Here are the specific information provided for each magic number: Profit. Number of trades. Profit factor. Expectancy (average pip per trade). Recovery factor (profit/drawdown). Max drawdown. Days that this magic number is trading on the account. Number of trade
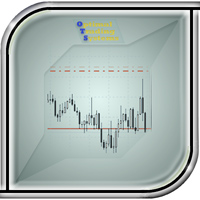
The utility manages other EAs' orders as well as the ones opened manually. It is capable of trailing the price (trailing stop function), set a stop loss and take profit if they have not been set before. When configuring the utility for an EA having no trailing stop function, place it to the new window with the same currency pair specifying the same Magic value (as for the EA orders the stop loss is to be applied to). You can set any timeframe. It does not affect the utility operation. Set Magic
FREE

RCCMA is a general moving average indicator that works with ReviewCandleChart. Original is "Custom Moving Average" provided by MetaQuotes Software Corp. Based on that source code, I corresponded to ReviewCandleChart .
Advantages When ReviewCandleChart is ON, no line will be displayed on the right side from the vertical reference line. When ReviewCandleChart is ON and you press a key such as "Z" or "X" Following that, the MA is drawn. When ReviewCandleChart is OFF, the same drawing as the origin
FREE

This Expert Advisor is designed for use on all currency pairs on any timeframes. Candlestick analysis from different timeframes is used for opening positions. Positions are closed using the automated trailing system or by an opposite signal. The EA does not have input parameters affecting the trading algorithm. Timeframe: any (candlesticks from M15 to H4 are used) Currency pair: any (it is recommended to simultaneously use at least 4 major currency pairs).
Parameters LotSize - lot value paramet
The Expert Advisor generates trading signals based on the values of the FractalDivergence_Patterns indicator. A Buy signal is generated when the indicator detects a support level, and a Sell signal is generated when the resistance level is found (see Fig. 1: blue arrows show buying, red arrows show selling). The Expert Advisor does not require the indicator to be additionally used, and can display the appropriate support and resistance levels.
Parameters The "Fractal divergence parameters" bloc

Bollinger Bands are volatility bands plotted two standard deviations away from a simple moving average. Volatility is based on the standard deviation, which changes as volatility increases and decreases. The bands expand when volatility increases and narrow when volatility capturing 85%-90% of price action between the upper and lower bands.
How it Works Knowing that the majority of price action is contained within the two bands we wait for price to break out of either the upper or lower band an

The Expert Advisor is easy to use. The EA operating principle is to start active trading, to open several orders in different directions and to close them by averaging.
Advantages Easy to use. Reasonable price. Customer support. Works with any signal delay and any spread value. Trades using pending BuyStop and SellStop orders.
Recommendations It is recommended to stop the Expert Advisor operation during important news releases. The EA is recommended for use on one of the major currency pairs.
If you want to add a pattern indicator to confirm the market movement you are in the right place, this indicator permit to detect some famous candle patterns Hammer, Inverted Hammer, Shooting Star, Hanging Man and Engulfing patter that can be highlighted on your chart once the patters occurs. Up, Down arrows are traced at the beginning of the new bar each time a pattern is detected.
Parameters Body to Bar Fraction (%) : the body size / the candle size (20% by default) Max Little Tail Fraction (

Trading Trend Line エキスパートアドバイザーは、確立されたトレンドラインに関連して取引します。これを行うには、名前を変更せずに価格チャートにトレンドラインを描画する必要があります。トレンドラインの名前は、常に「トレンドライン」のスペースと数字の形式である必要があります。この名前は、回線をインストールするときにデフォルトで常に使用され、編集する必要はありません。 EAのトレンドラインに沿った取引は、改行での取引とラインからのリバウンドでの取引の2つの方法で表示されます。取引のシグナルは、始値がトレンドラインを下回っている/上回っており、終値がトレンドラインを上回っている/下回っている場合の最後から2番目のバー(固定)です。オープンポジションの標準のトレーリングも使用されます。
設定の説明 Type_Strategy-ブレイクアウトまたはリターンのための取引戦略の選択 MagicNumber-注文のマジックナンバー StopLoss-ポイント単位の損失レベル TakeProfit-ポイント単位の利益レベル トラル-オープンポジションのトレーリングを有効または無効にし

This indicator can send alerts when a Heiken Ashi Smoothed color change occurs. Combined with your own rules and techniques, this indicator will allow you to create (or enhance) your own powerful system. Features Can send all types of alerts. Option to delay the alert one bar in order to confirm the color (trend) change. Input parameters Wait for candle close: 'true' or 'false'. Setting it to 'true' will delay the alert to the opening of the bar following the bar where the color change occurred.
FREE

This indicator is a proof of concept of pyramid trading strategy. It draws fibonacci level automatically from higher high to lower low or from lower low to higher high combinate with Pyramid Trading Strategy for better risk reward ratio. What is Pyramid Trading Strategy? The pyramid forex trading strategy is a something every forex trader should know about because it makes the difference between making some pips with some risk in only one trade or some pips with less the risk by applying the pyr
Key Features This application is designed to quickly place a pending order or open a position at market. The position volume will be calculated automatically according to the risk settings. This application also manages orders and positions. Everything is simple, you only need to specify the price of the order (or position by market) and stop loss. The type of the pending order is selected automatically depending on the logic of the relative location of the current price, pending order price and

The RightTrend indicator shows the direction of trend and reversal points (market entry and exit points). It is very easy to use: open BUY deal when the up arrow appears and open SELL deal when the down arrow appears. The indicator generates accurate and timely signals for entering and exiting the market, which appear on the current candle while it is forming. In spite of apparent simplicity of the indicator, it has complex analytic algorithms which determine trend reversal points.
Inputs stren
The indicator shows buy or sell on the screen when it catches a signal with its own algorithm. The arrows warn the user to buy or sell. Pairs: USDCHF, AUDUSD, USDJPY, GBPJPY, EURUSD, GBPUSD, EURCHF, NZDUSD, EURCHF and EURJPY. You can test the indicator and choose the appropriate symbols. The best results are on M30.
Parameters AlertsOn - send alerts AlertsMessage - send a message AlertsSound - sound alert
AlertsEmail - email alert Buy color - buy color
Sell color - sell color

This indicator draws Fibonacci level automatically from higher high to lower low or from lower low to higher high combinate with Pyramid Trading Strategy for better risk reward ratio. With adjustable Fibonacci range and has an alert function.
What is Pyramid Trading Strategy? The basic concept of pyramiding into a position is that you add to the position as the market moves in your favor. Your stop loss moves up or down (depending on trade direction of course) to lock in positions. This is how
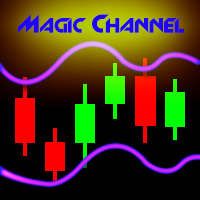
Magic Channel is a channel indicator for the MetaTrader 4 terminal. This indicator allows finding the most probable trend reversal points. Unlike most channel indicators, Magic Channel does not redraw. The alert system (alerts, email and push notifications) will help you to simultaneously monitor multiple trading instruments. Attach the indicator to a chart, and the alert will trigger once a signal emerges. With our alerting system, you will never miss a single position opening signal! You can t

Rung トレンドインジケーター。インディケータは、価格変動の主な傾向を識別し、さまざまな色でマークしますが、主な傾向に対するノイズや短期的な価格変動を排除し、反応しません。 インディケータは、市場の現在のトレンドを決定するツールです。デフォルト設定では、価格がチャネル内で移動すると、インジケーターは上昇傾向(「強気」トレンド)、インジケーターは緑色の線でマークされ、下降トレンド(「弱気」)トレンドは赤色の線でマークされます。 、インジケーターは反応しません。コリドーまたは横方向の価格変動の値は、インジケーターの設定によって調整できます。
インジケーター設定の説明 striction_points-コリドーのサイズ(ポイント単位)。 factor_smoother-平滑化係数。 アラート-ユーザーデータを含むダイアログボックスを表示します。 Text_BUY-買いシグナルのカスタムテキスト。 Text_SELL-売りシグナルのカスタムテキスト。 Send_Mail- [メール]タブの設定ウィンドウで指定されたアドレスにメールを送信します。 件名-電子メールの件名。 Send_No
FREE

The indicator displays the key support and resistance levels on the chart. The significance of these levels lies in that the price may reverse or strengthen the movement when passing such levels, since they are formed as a consequence of the natural reaction of market participants to the price movement, depending on which positions they occupied or did not have time to occupy. The psychology of the level occurrence: there always those who bought, sold, hesitated to enter or exited early. If the

Take your trading to the next level with DFGX - our second generation Dynamic Fibonacci Grid. This new, powerful and easy to use application is specially designed and optimized for contrarian intraday trading, scalping and news trading on the Forex market. This system is the ideal solution for active professional traders and scalpers who are looking for innovative ways to optimize their strategy. The system also provides excellent opportunity for new traders who want to learn to trade in a syste

This indicator shows the main trend on the current chart.
Features This indicator includes two bands, one is the inner white bands, another is the outer blue bands. If the white dotted line crosses down the white solid line, this means that the trend has changed to be bearish. If the white dotted line crosses up the white solid line, this means that the trend has changed to be bullish. Once the crossing happened, it will not repaint.
Settings ShowColorCandle: if 'true', it will show the color

MQLTA Support Resistance Lines is an indicator that calculates the historical levels of Support and Resistance and display them as Lines on chart. It will also Alert you if the price is in a Safe or Dangerous zone to trade and show you the distance to the next level. The indicator is ideal to be used in other Expert Advisor through the iCustom function. This DEMO only works with AUDNZD, the full product can be found at https://www.mql5.com/en/market/product/26328
How does it work? The indicator
FREE

The indicator shows the trend of 3 timeframes: higher timeframe; medium timeframe; smaller (current) timeframe, where the indicator is running. The indicator should be launched on a chart with a timeframe smaller than the higher and medium ones. The idea is to use the trend strength when opening positions. Combination of 3 timeframes (smaller, medium, higher) allows the trend to be followed at all levels of the instrument. The higher timeframes are used for calculations. Therefore, sudden change

Note: this product is a free limited version of the full featured product Currency Timeframe Strength Matrix . It only includes AUD, CAD, CHF currencies instead of all 8 currencies. It includes only 5S, 1M, 5M time frames instead of all 8 (5S, 1M, 5M, 15M, 30M, 1H, 4H, 1D).
What is it? The Currency TimeFrame Strength Matrix is a simple and comprehensive Forex map that gives a snapshot of what is happening in the Forex market at the very present time. It illustrates the strength and momentum ch
FREE
At last! See the actual, oscillating RSI for multiple pairs & multiple timeframes, all on the one chart!
The Benefits of Multi TimeFrame / Multi Pair Analysis Multiple time frame analysis is one of the most important things you should be doing before you take every trade. The most successful traders rely on monitoring several timeframes at once, from the weekly down to the 1 minute. They do this because using only one timeframe causes most traders to become lost in the "noise" of random price m

The Moving Average Slope (MAS) is calculated by detecting the moving average level n-periods ago and comparing it with the current moving average level. This way, the trend of the moving average can be drawn on the moving average line. This indicator allows to compare the slopes of two moving averages (fast and slow) to cancel out noise and provide better quality entry and exit signals SCANNER is included . Now with Scanner you can find trading opportunities and setups easily and faster.
Featur

Fix M15 is a fully automated short-term trading robot. The EA does not use hedging, martingale, grid strategies, arbitrage, etc. Fix M15 opens a trade during the Asian session in a narrow channel defined by MA and RSI indicators. Only one trade per one pair can be opened on the market at each given time. It can be closed by a certain TP, SL or after a certain time (set in the EA settings). Basic EA settings are configured for trading GBPUSD М5 for the terminal set to GMT+3 (summer time). The EA

The indicator uses the Chester W. Keltner's channel calculation method, modified by the well-known trader Linda Raschke. Due to the modification, the calculated channel contains a much more complete overview of the price movements, which allows increasing the probability of an accurate prediction of the upcoming price movement. Unlike the classic Keltner method, the base line of the channel is plotted based on the Exponential Moving Average, and the Average True Range is used to calculate the up
FREE
MetaTraderプラットフォームのためのアプリのストアであるMetaTraderアプリストアで自動売買ロボットを購入する方法をご覧ください。
MQL5.community支払いシステムでは、PayPalや銀行カードおよび人気の支払いシステムを通してトランザクションをすることができます。ご満足いただけるように購入前に自動売買ロボットをテストすることを強くお勧めします。
取引の機会を逃しています。
- 無料取引アプリ
- 8千を超えるシグナルをコピー
- 金融ニュースで金融マーケットを探索
新規登録
ログイン