YouTubeにあるマーケットチュートリアルビデオをご覧ください
ロボットや指標を購入する
仮想ホスティングで
EAを実行
EAを実行
ロボットや指標を購入前にテストする
マーケットで収入を得る
販売のためにプロダクトをプレゼンテーションする方法
MetaTrader 4のための新しいエキスパートアドバイザーとインディケータ - 285

true Momentum - time-based Indicator it will inform about Momentum, a strong impulse in the appropriate direction it's based on a self-developed candle Pattern, in relation to the ATR (Average True Range)
Quick Start : the indicator is ready to use choose your personal times to trade try an indicator-preset or use an additional indicator, below the pro-settings
Filter Hours Weekdays Moving Averages Correlation Instruments - Moving Averages MACD RSI ADX PSAR Stochastic Bollinger Bands Keltne
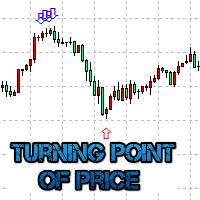
The Turning point of price indicator displays assumed turning points of the price on the chart. It is based on data of the Prise Reversal oscillator and standard ADX. When the value of Prise Reversal is in overbought or oversold area (area size is set by a user), and the value of the ADX main line exceeds the preset value, the Turning point of price indicator draws an arrow pointed to the further assumed price movement. This idea is described in the article Indicator of Price Reversal .
Indica

Tired of plotting trendlines? The PZ TrendLines indicator applies a mechanical approach to the construction of trend lines for you! [ Installation Guide | Update Guide | Troubleshooting | FAQ | All Products ] It can draw up to 18 trendlines Trendlines can be optionally based on fractals Each line represents a breakout level Each trendline can be broken or rejected Configurable amount of lines Configurable colors
Author Arturo López Pérez, private investor and speculator, software engineer an

The Supply and Demand with Swap zones MTF indicator is a powerful tool for technical analysis that has been modified and enhanced to provide traders with even more valuable information. This tool is based on the rule of supply and demand and allows traders to analyze a chart on three different timeframes at once, providing a more comprehensive view of the market. One of the key features of this indicator is the so-called swap zones, which are areas that have been broken through by the price but

This indicator shows data from 9 currency pairs by your choice from all 9 timeframes. If a digital value of the RSI is less or equal to DnLevel = 30 (or whatever number you decided to put), then a Green square will appear. This is (potentially) an Oversold condition and maybe a good time to go Long . If a digital value of the RSI is greater or equal to UpLevel = 70 (or whatever number you decided to put), then a Red square will appear. This is (potentially) an Overbought condition and maybe a go

This indicator displays pivot points in the chart, including historical vales, and supports many calculation modes for Pivot Points and S/R levels. [ Installation Guide | Update Guide | Troubleshooting | FAQ | All Products ] It plots historical levels for backtesting purposes
It allows you to select the reference timeframe It implements different Pivot Point calculation modes It implements different SR calculation modes
It implements customizable colors and sizes
Calculation Modes The indic

This is a portfolio night scalper working on EURUSD, GBPUSD, USDCAD, USDCHF, USDJPY, USDMXN and USDSGD. Timeframe - M15.
Parameters Orders_Comment - comment to orders opened by the EA. Lot_Size - fixed lot size if Auto_MM = 0. Auto_MM - percent of equity to be used in trading. If Auto_MM = 0, it will use a fixed lot. Magic_Number - unique number of orders (set different values for each trading symbol). Start_Time - the EA's operation start hour (default is 00.00; we do not recommend changing

A portfolio night scalper for instruments: EURAUD, GBPAUD, EURNZD, GBPNZD. Timeframe - M15. Parameters Orders_Comment - comment to orders opened by the EA. Lot_Size - fixed lot size if Auto_MM = 0. Auto_MM - percent of equity to be used in trading. If Auto_MM = 0, it will use a fixed lot. Magic_Number - unique number of orders (set different values for each trading symbol). Start_Time - the EA's operation start hour (default is 00.00; we do not recommend changing this value). End_Time - the EA's
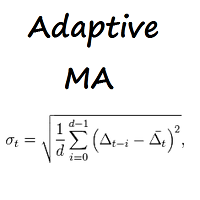
Adaptive MA 移動平均。計算方法は、バーの定義で使用されるすべての価格の平均です。
インジケーターの外部設定の説明: MA_period- インジケーターを計算するための平均期間。推奨値:5、13、21、34。 ma_method- 平均化メソッド。移動平均メソッドの任意の値にすることができます。 0-(SMA)単純移動平均。 1-(EMA)指数移動平均。 SMMA 2-(SMMA)平滑化移動平均。 LWMA 3-(LWMA)線形加重移動平均。 移動平均。計算方法は、バーの定義で使用されるすべての価格の平均です。
インジケーターの外部設定の説明: MA_period- インジケーターを計算するための平均期間。推奨値:5、13、21、34。 ma_method- 平均化メソッド。移動平均メソッドの任意の値にすることができます。 0-(SMA)単純移動平均。 1-(EMA)指数移動平均。 SMMA 2-(SMMA)平滑化移動平均。 LWMA 3-(LWMA)線形加重移動平均。

Cardiogram Market 設定の説明: MA_period_fast- 高速移動平均を計算するための平均期間。 MA_period_slow- 低速移動平均を計算するための平均期間。 価格 -使用する価格。価格定数のいずれかにすることができます。 0-(閉じる)終値。 1-(OPEN)始値。 2-(高)高価格。 3-(低)最低価格。 4-(中央値)平均価格、(高+低)/ 2。 5-(代表値)通常価格、(高値+安値+終値)/ 3。 6-(加重)加重終値、(高値+安値+終値+終値)/ 4。 方法 -方法を平均化。移動平均メソッドの任意の値にすることができます。 0-(SMA)単純移動平均。 1-(EMA)指数移動平均。 SMMA 2-(SMMA)平滑化移動平均。 LWMA 3-(LWMA)線形加重移動平均。
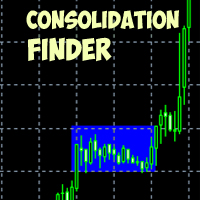
The indicator allows to find consolidations. It is meant for channel breakthrough. Easy to use, it has only three parameters: Minimum number of bars to analyze Consolidation tunnel Indicator color It works on all timeframes . Approximate settings are adjusted for H1 by default. Works on all currency pairs. This indicator does not repaint and is not recalculated. All screenshots are real!

DoubleExit is an Expert Adviser designed for scalpers that will place automatically the stop loss and take profit for every new trade that you open and is without specified exit levels. Also DoubleExit adds a partial exit level at a fixed (by the user) amount of pips. The user can define also the amount of the original trade (in a percentage) to be closed at the time of the partial exit level is reached. The exit level (represented on the chart with an orange dash-dot-dot line) can be changed ea
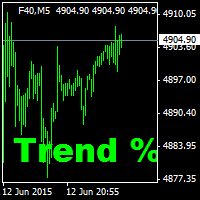
These indicators are suitable for scalper tradition. At least 5-10 pips of income should be targeted. The stop should be at least 11 pips. It is suitable to be used in brokers with not much spread. This indicator is used to determine the trend percentage. Trend direction is made in color. It has the indicator warning system: beep, e-mail and has three types of alerts, including messages to mobile phone. The position can be in 4 different corners of the screen. When trend value reaches the value

Written for currency pairs: GBPUSD, USDJPY, XAUUSD There is a built-in function to return the stop to its place after slipping, an example of slipping in the last screenshot., in a similar situation, the function tries to return the stop to the place indicated when placing the order. The number of transactions in the strategy tester, demo account, real account is almost the same, the result depends on: the size of the spread, slippage, Stop Level and the speed of execution of the broker. Availab

The use of a polynomial expansion of data opens up new possibilities for analysis and decision making. But the problem of all existing algorithms is a very slow computation. The main feature of this indicator is its fast algorithm. The speed of calculation of the polynomial algorithm and its standard deviation values is several thousand times faster than conventional algorithms. So this is a convenient algorithm for use without the need to apply supercomputers. Also, starting from version 1.4
This indicator creates more stable Aqua histogram, which crosses the zero line up and down indicating UP and DOWN trend for long and short positions. The indicator generates a pulse red signal, which crosses the zero line up and down more frequently than the histogram. You may use only the histogram for entering the market in the point where the histogram crosses the zero line. You may use only the red line for entering the market in the point where the red line crosses the zero line. You may us

Binary Options Copier Remote is an EA that allows to copy binary options trades between MT4 accounts at different computers. This is an ideal solution for signal provider, who want to share his trade with the others globally on his own rules. Provider can give free bonus license to 10 receivers. That means those 10 receivers can copy from provider by using Binary Options Receiver Free (no cost). From 11th one, receiver have to buy Binary Options Receiver Pro (paid version) in order to copy from

Binary Options Receiver Free is a free tool to copy binary options trades from other traders at different locations over internet, who use Remote Binary Options Copier to send. To start copying via this tool, provider must add a free license in his list first. That means you can use this free tool to copy binary options trades from a provider, who authorized you to do so and issued a free license. Reference : If you need both sending and receiving features, please check Remote Binary Options Cop
FREE

Binary Options Copier Local is an EA that allows to copy binary options trades between MT4 accounts on the same computer. With this copier, you can act as either a provider (source) or a receiver (destination). All binary options trades will be copied from the provider to the receiver with no delay. Demo : Demo version for testing can be downloaded at: https://www.mql5.com/en/market/product/10047 Reference : If you need to copy between different computers over Internet, please check Binary Optio
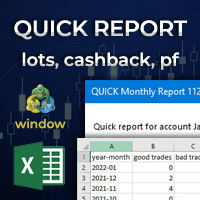
Quick Monthly Report – One Click Report Displays the results of trading according to monthly periods in a pop-up window Advantages With just one click you can view a list of the entire history according to months Exports data to CSV files with custom separator Filter by Magic Numbers Filter by Symbols Filter by words, letter or phrase in the comment Calculates the profits gained and the percentage of a Performance fee Enables to calculate the traded Volume or Lots with cachback in USD Par

Advanced Bollinger Bands (BB) indicator. The standard Bands.mq4 indicator was complemented with a range of upper/lower band and signal of possible reverses.
Parameters: BandsPeriod - indicator period. BandsRange - period of determining a range. BandsDeviations - number of standard deviations. Averaging Fast Period - fast period of averaging. Averaging Slow Period - slow period of averaging.
Buffer indexes: 0 - Middle line, 1 - Upper line, 2 - Lower line, 3 - Upper range, 4 - Lower range, 5
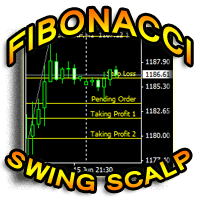
Fibonacci Swing Scalp (Fibonacci-SS) This indicator automatically places Fibonacci retracement lines from the last highest and lowest visible bars on the chart with an auto Pending Order (Buy/Sell), Stop Loss, Taking Profit 1, Taking Profit 2 and the best risk and reward ratio. This is a very simple and powerful indicator. This indicator's ratios are math proportions established in many destinations and structures in nature, along with many human produced creations. Finding out this particular a

The All-in-One Trade Indicator (AOTI) determines daily targets for EURUSD, EURJPY, GBPUSD, USDCHF, EURGBP, EURCAD, EURAUD, AUDJPY, GBPAUD, GBPCAD, GBPCHF, GBPJPY, AUDUSD, and USDJPY. All other modules work with any trading instruments. The indicator includes various features, such as Double Channel trend direction, Price channel, MA Bands, Fibo levels, Climax Bar detection, and others. The AOTI indicator is based on several trading strategies, and created to simplify market analysis. All-in-One

The indicator calculates currency strength of eight major and also can calculate strength of any other currency, metal or CFD. You don't need to look through a lot of charts to determine the strong and weak currencies, as well as their current dynamics. The picture of the whole currency market for any period can be viewed in a single indicator window. Built-in tools for monitoring and controlling the situation will help you not to miss out on profits.
Main Features It is able to display only t

BREAKOUT-SESSION-BOX LONDON EU US ASIA Open
watch the expectation of a volatile movement above or under the opening range We take the high of the range as Entry for a long trade and SL will be the low of the range and vice versa the low of the range as Entry for a short trade and the high for SL The size of the range is the distance to the TP (Take Profit) The range of the opening hours should not be larger than about 1/3 of the average daily range 4 breakout examples are already predefined:
FREE

Introduction to Smart Renko The main characteristics of Renko Charting concern price movement. To give you some idea on its working principle, Renko chart is constructed by placing a brick over or below when the price make the movement beyond a predefined range, called brick height. Therefore, naturally one can see clear price movement with less noise than other charting type. Renko charting can provide much clearer trend direction and it helps to identify important support and resistance level
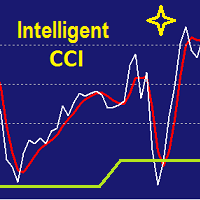
It is CCI indicator with very smooth and noiseless movement that calculates four levels of buy, sell, overbought and oversold dynamically. Professional traders know well that level of 100, 200 or -100 and -200 are not always right and need fine adjustments. This indicator calculates those levels dynamically by using mathematics and statistic methods in addition to shows divergence between indicator and price. Like original CCI, for best result you have better to set proper value for CCI period b

This indicator signals about Stochastic crossing in the trend direction which is determined by the position of the price relative to the Ichimoku cloud.
Features: Flexible settings: filtering signals by bullish/bearish bars ( parameter "BUY - the bullish bar only; SELL - the bear bar only" ); setting levels of Stochastic crossing ( parameters "BUY-signal if Stochastic below this level" and "BUY-signal if Stochastic below this level" ) ability to use the Ichimoku cloud of higher timeframes ( pa

Binary Options Trading Pad is a very useful tool for trading binary options on the MT4 platform. No need to setup plugins outside MT4 anymore. This is a simple and convenient panel right on MT4 chart. Demo: For testing purpose, please download the free demo version here: https://www.mql5.com/en/market/product/9981 Features
One-click trading buttons on the panel. Trade multi-binary option symbols in one panel. Auto recognize all binary options symbols. Show order flow with expiration progress. M

The indicator MilkyWay is calculating and draws a blue or red ribbon as a trend and as a filter. In case the price is moving inside the ribbon you should not enter the market. In case you see a blue trend and the current price is above the blue ribbon than this is a good time to go Long. In case you see a red trend and the current price is below the red ribbon than this is a good time to go Short. Only 1 input parameter: nBars = 500; - number of Bars where the ribbon will appears.

This is a simple technical indicator that plots a line in a zigzag fashion using the Bill Williams Fractals indicator as reference. The mechanics in this indicator is as simple as this: from the latest available fractal in the chart it will trace a line to the next fractal in the opposite side of the price candles and so on until the older possible fractal in the chart is covered. This technical indicator does not have any input to configure.

Expert Advisor は 、アカウントMetaTrader 4で 取引を繰り返し、ポジションを設定するか、事前に設定された回数だけシグナルを送信します。 手動または別のエキスパートアドバイザーによって開かれたすべての取引をコピーします。 シグナルをコピーし、シグナルからロットを増やします ! 他のEAの多くを増やします。 次の機能がサポートされています:コピーされた取引のカスタムロット、ストップロスのコピー、テイクプロフィット、トレーリングストップの使用。 MT5のバージョン
完全な説明 +DEMO +PDF 購入する方法
インストールする方法
ログファイルの取得方法 テストと最適化の方法 Expforex のすべての製品 リンク MetaTraderのトレードコピー機はこちらから入手できます: COPYLOT 注意
注:これは、端末間の取引用のコピー機ではありません。 ストラテジーテスターでエキスパートアドバイザーをテストし、ビジュアルモードでEAPADPROツールバーと取引することができます! EAを1つの通貨ペアにインストールす

Eureka Lock ユーレカロック -エキスパートアドバイザーは、指定された設定に関連する価格変動のフラットエリアを決定します。取引は、指定されたフラットの境界からの買いストップと売りストップの保留中の注文によって実行されます。損失を制限する代わりに、ボリュームを増やして損失位置をロックすることが使用されます。仮想利益レベルも使用されます。
設定の説明: TF_flet = 15-フラットが決定されるチャート期間 Bars_flet = 25-フラットを決定するためのバーの数 extern int Size_flet = 30-フラットの上下の境界線(高さ)間の距離をポイント単位で制限します otstyp = 5-保留中の注文を行うためのフラットボーダーからのオフセット ロット= 0.1-注文量 koef_lot = 2-オーダーをロックするための乗算係数 TakeProfit = 100-設定されたロット設定に対して、ポイント単位の仮想利益レベルが計算されます MagicNumber = 1975-マジックオーダー数 NumberOfTry = 5-ブローカーの再見積もり

Bands Jazz Bands Jazz -Expert Advisorは、ボリンジャーバンド インジケーターからのシグナルの分析に基づいています。 Expert Advisorのアルゴリズムは単純で、SL、TP、およびオープンポジションのトロールを使用します。
設定の説明 TimeBeginHour- 数値。取引開始時刻の時間を設定します。 0〜24の値。 TimeBeginMinute- 数値。取引開始時間の分を設定します。 0〜60の値。 TimeEndHour- 数値。取引終了の時間を設定します。 0〜24の値。 TimeEndMinute- 数値。取引終了時間の分を設定します。 0〜60の値。 期間 -ボリンジャーバンド指標を計算するための平均期間。 偏差 -ボリンジャーバンドインジケーターのメインラインからの標準偏差の数。 band_shift- ボリンジャーバンドインジケーターの価格チャートに対するインジケーターのシフト。 apply_price- ボリンジャーバンドインジケーターの適用価格。 shift- ボリンジャーバンドインジケーターのインジケーター

Smart YTG MT5端末のアドバイザのバージョン。 | すべての製品 スマート YTGは、GBPUSD通貨ペア、チャート期間H1で動作するように作成されました。本質的に、システムはトレンドであり、STOP注文による価格変動のトレンドセクションで完全に機能します。トレンドは 、エキスパートアドバイザーの内部に組み込まれた価格チャネル インジケーターを分析することによって決定されます。インジケーターを追加でインストールする必要はありません。平坦な地域では、市場が優柔不断であり、市場のさらなる動きが決定された場合、撤退システムは損失なく稼働し、価格の動きの方向と反対のポジションが市場にある場合、それらは価格変動の方向で注文がオーバーラップし、総利益が一連のポジション全体のクローズに達したとき、エクイティは下落せず、バランスラインを維持します。これはテスト結果からわかります。 コード内の多くの計算とその大部分は、市場がフラットを形成し、ドローダウンや損失なしにトレンドから抜け出す必要がある瞬間に正確に属します。このために、位置を動的に閉じるためのブロックと静的に閉じるためのブ
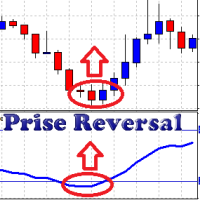
This oscillator takes into account the data from a number of standard indicators. Using this data, it forms its own (more accurate) signals. Prise Reversal helps to identify reversal points during the flat and the price extremums during the trend. At these points, you can enter a counter-trend with a short take profit. Besides, they indicate the time intervals when you cannot open a trend-following deal. After a few days of using the indicator, it will become an integral part of your trading sys

The Nash Equilibrium MT4 draws the channel as a Trend and as Envelopes or Bands. You may use these white lines as levels for overbought and oversold conditions. Inside Bands, this indicator draws dot white line as a median line between the two bands and Aqua or Orange line and you may use this change of colors as moment to enter the market. Parameters nPeriod = 13 - number of Bars for indicator's calculation. nBars = 500 - number of Bars where the indicator is to be shown. Attention : This indic

The idea for indicator is using multi-SuperTrend line to define market trend and Multi Moving Average line to find good entry point. The signal doesn't repaint, wait until the bar closed to make sure the signal is confirmed. Lowest RoyalBlue line is used for Buy stoploss. Highest Magenta line is used for Sell stoploss. Indicator supports alert when signal is coming (sends email, push notifications, sound alert). High Timeframe is better for using.
Indicator parameters:
CountBars = 500 — How m

All Pending Orders with StopLoss opens any combination of Buy Stop, Sell Stop, Buy Limit and Sell Limit pending orders and closes all existing pending orders. If boolSL = true then this Script will calculate one common StopLoss value as the StopLoss for a first/last orders and put this value in all pending orders.
Input Parameters Before placing all pending orders, the input window is opened allowing you to modify all input parameters: DeleteAllPendings : if true , then all pending orders (for

This is a great indicator to find an exit point. We never know when the market is going to change its trend. Many indicators give you a good entry point, but not good to use opposite signal as an exit point, because the signal always comes too late. This indicator will protect your profit as soon as possible when a signal to exit is found! Don't use this signal to enter, it may not be good for making an entry. The signal doesn't repaint, wait until a bar closes to make sure it is confirmed. Indi
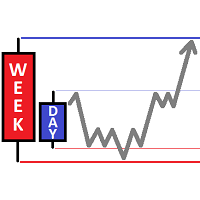
The indicator places levels on the chart: day and week high, day and week low. When the price crosses the high's level upwards or the low's level downwards, the indicator beeps and send a notification (Alert and Push-notification on mobile phone ) indicating a direction and an instrument by which crossing has occurred, and also draws arrows. Visual parameters: Day_Width - daily level width. Days_Alerts - enabling Alerts. Days_Arrows - enabling drawing arrows. Day_High - color of daily high

The indicator has been developed as a trading system component. It has proven to be an efficient technical tool when following a trend. The indicator shows the most suitable market entry points. It can be especially useful to those who add to positions after corrections in the trend direction. When a signal appears, the indicator generates an alert.
The settings contain the depth of the indicator display history and ability to disable alerts. The signal is generated upon closing of the current

The indicator automatically sets trendlines on the really important points directly on the chart. Timeframe, color and style of the lines can be adjusted. Notification of a breakout above or below the line via a smartphone is possible.
Inputs Timeframe - Choose timeframe TrendlineColor - Choose line color TrendlineStyle - Line styles (solid, dash, dot, dash dot, dash dot dot) Alerts - True = alert SendNotifications - True = Notification via a smartphone
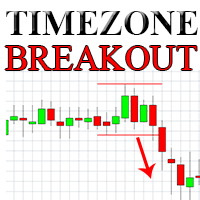
Simply breakout EA on highest and lowest point of choosen period of time. EA works on H1. This is not full EA. You need to set your strategy and know profitability. I am using it for London breakout 08:00 to 09:00 (set for UTG+1, if you want to used it too, change time to fit your timezone), picture of setting are below.
Parameters Start of timezone - When your zone start (xx:xx) - minutes must be 00 End of timezone - When your zone end (xx:xx) - minutes must be 00 Max width of zone - Max allo


Crazy Scalper Crazy Scalper は、2つの方向(売買)で同時に取引するスキャルピングシステムを使用する非インジケーター取引ロボットです。同時に、多方向のポジションは利益を生むことができず、オープンポジションの1つは必然的に損失を被ります。負けポジションがある場合は、ロック(ロック)が使用されます。次に、ロック位置がその役割を果たしておらず、見積もりが取り消された場合、平均化システムによれば、保留中の注文で、引き出しが損失なく使用されます。
MT5ターミナルの エキスパートアドバイザー 設定の説明 TakeProfit = 3; -ポイント単位の利益レベル。 Lock_Level = 22; -ロック注文を出すための距離(ポイント単位)。 coef_l = 1.8; -多くのロックオーダーの乗算係数。 TakeProfit_Av = 10; -すべての未決済注文の合計利益レベル。 AV_Level = 50; -平均化順序をトリガーするための距離(ポイント単位)。 OR_Level = 24; -現在の価格から保留中の平均注文を出す

Forex Jumper 外国為替ジャンパー -EURJPY通貨ペアで動作するように設計されたエキスパートアドバイザー。ローソク足パターンの分析は、取引決定を行うためのシグナルです。 EAは、取引時に保留中の注文BUYSTOPとSELLSTOPを使用します。 設定: ロット= 0-未決済注文の量の手動設定 リスク= 13-MMのリスクのパーセンテージ、ロット= 0で機能 MagicNumber = 208-アドバイザーの注文と位置の識別子、マジックナンバー TP = 20-市場に一方向のオープンポジションが1つある場合の、ポイント単位の仮想レベルの利益 TP2 = 20-市場に複数のオープンな一方向のポジションがある場合のポイント単位の仮想レベルの利益 StopLoss = 500-ポイント単位の損失レベル。値が0(ゼロ)の場合、レベルは設定されません。 count_BUY = 1-市場での買い注文の同時存在数の制限。0では注文は行われません。 count_SELL = 1-市場での売り注文の同時存在数を制限します。0では注文は行われません。 すべり= 3-すべりレベル(ポイント

The indicator finds candlestick patterns based on Gregory L.' Morris "Candlestick Charting Explained: Timeless Techniques for Trading Stocks and Futures". If a pattern is detected, the indicator displays a message at a bar closure. If you trade using the MetaTrader 5 terminal, then you can download the full analogue of the " Candle Pattern Finder for MT5 " indicator It recognizes the following patterns: Bullish/Bearish (possible settings in brackets) : Hammer / Shooting Star (with or without con

This is a very simple script that will show you the following info about any symbol in your chart: Point, digits, spread, stop level, lot size, tick value, tick size, swap long, swap short, starting date (if future contract), expiration date (if future contract), trade allowed, minimum lot size, lot step, maximum lot size, swap type, profit calculation mode, margin calculation mode, initial margin, margin maintenance, margin when hedged, margin required, freeze level. All this info is extracted
FREE

The "Market Profile" indicator displays the profiles and volumes of periods – weekly, daily, session (8-hour), 4-hour, hour, summary. The VAH/VAL price area is automatically highlighted by a dotted line for each profile (except for the summary). The indicator includes chroma Delta, which colors the profile areas. The areas of prevailing Buys is colored in green, that of Sells - in red. The intensity histogram features blue/red respectively. In the filter mode, the indicator displays the volume a

This is yet another non-parametric ZigZag. Its every upward edge continues until next bar's high is formed below highest low of its bars, and every downward edge continues until next bar's low is formed above lowest high of its bars. In addition to zigzag itself (shown in orange color), the indicator shows signal marks on those bars where zigzag direction changes. The blue arrow up denotes that new bullish edge is started (but not yet completed), whereas the red arrow down denotes that new beari
FREE

This indicator draws Fibonacci level automatically from higher high to lower low or from lower low to higher high. With adjustable Fibonacci range and has an alert function.
How to use Fibonacci Risk Reward Ration (R3) into trading strategy Forex traders use Fibonacci-R3 to pinpoint where to place orders for market entry, for taking profits and for stop-loss orders. Fibonacci levels are commonly used in forex trading to identify and trade off of support and resistance levels. Fibonacci retrace
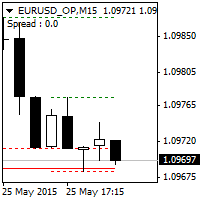
This indicator automatically draws Support and Resistance lines based on High and Low Candle at every timeframe. Support and resistance have a recurring nature as a trader goes through the process of building a strategy. Because of its importance, it is often reasonable for a trader to build object patterns for incorporating these prices into a strategy. When strong support and resistance levels are found, this can enable traders to effectively plot their approach, manage trades, and adjust risk

This indicator is customized for binary option trading like M1 timeframe or turbo option trading. The way a binary option works is from the traders perspective is that you choose whether or not a certain underlying asset (a stock, commodity, currency etc.) is going to go up or down in a certain amount of time. You essentially bet money on this prediction. You are shown how much money up front you will earn if your prediction is correct. If your prediction is wrong, you lose your bet and the mone

Fibox4 indicator displays Fibonacci Retracement, Pivot Point, and many other useful information for analysis. The interface is improved by providing clickable button on chart to switch on/off H4, daily, weekly, monthly swing retracement level.
In addition, fibox4 displays Current Daily Range and Weekly Range.
This version can be used for all pairs..

The Trend Magic Alarm shows the direction of a trend and indicates when it changes with a sound, popup window, push or email notice. Blue dots in the chart indicate an uptrend, red dots indicate a downtrend. Levels of former highs + lows give orientation in a chart. Trend Magic Alarm can draw these levels as lines in the chart, see inputs.
Input Parameters Counter : number of bars used for calculation PowerSet : shows how near to the bars the trigger dots are placed DotSize : size of the show

Robo Grid FX ROBO GRIDFX はグリッドエキスパートアドバイザーです。 活発な市場と速い通貨ペアでの日中取引用に設計されています。これは、クローズドアベレージングシステムを備えたグリッドアドバイザーです。閉ループ平均化システムは、高速で積極的な通貨ペアで預金がドローダウンした場合の安定したブレークイーブン戦略です。 Expert Advisorは、保留中の注文のグリッドを両方向に配置し、負のポジションが表示された場合、価格変動が40〜60ポイントのコリドーに発生したときにそれをロックします。そして、損益分岐点まで(露出したグリッドを両方向に削除せずに)グリッド内に表示を開始します。そして、引用がチャネルを壊す方向(上または下)は関係ありません。エキスパートアドバイザーは、25〜40ポイントを超える市場ポジションのドローダウンをなくすことはできません。StopLossとTakeProfitは、状況と見積もりの方向または逆転に応じて絶えず変更されます。強いトレンドの動きで、ロボットは単にトレンドを追跡します。 すべての計算は、エキスパートのコア内の所定のアルゴリズム

Pyramid MA ピラミッドMA- アドバイザーの特性:移動平均(MA)インジケーターを使用します。トレンドが逆転したときに注文のグリッドを変更する。平均ポジションに対するメイントレーディンググリッドの注文量の増加の指数。保留中の注文BUYSTOPおよびSELLSTOPに取り組みます。オープントレードのバランスを制御し、損益分岐点に到達させる損失平均化システムを使用します。オープンおよび完了した取引に関する適切な通知。 PYRAMID MA Expert Advisorに基づいて、独自の取引戦略を簡単に作成できます。
アドバイザ設定の説明: koef_grid = 0.5-多くのグリッドオーダーの乗算係数 インジケーター設定: tf_grid = 0-開始注文時にインジケーター信号を受信するためのチャート期間。チャートの期間の1つにすることができます。 0は現在のチャートの期間を意味します。 1分。 5〜5分。 15〜15分。 30〜30分。 60-1時間240-4時間。 14 40-1日。 10080-1週間。 43200-1か月。 tf_lock = 60-注文をロック

Boom トレーディングロボットは指標分析に基づいています。取引の決定は移動平均の読み取りに基づいて行われ、インジケーターは外部変数を使用して構成できます。 TF = 0-チャートの稼働期間の選択。チャートの期間の1つにすることができます。 0は現在のチャートの期間を意味します。 1分。 5〜5分。 15〜15分。 30〜30分。 60-1時間240-4時間。 14 40-1日。 10080-1週間。 43,200-1か月。 shift = 0-インジケーターバッファーから受け取った値のインデックス(現在のバーに対して指定された期間だけシフトバック)。 period_fast = 5-高速移動平均インジケーターの期間。 period_slow = 12-遅い移動平均インジケーターの期間。 mehod = 0-平均化方法。移動平均メソッドの任意の値にすることができます。 0-(SMA)単純移動平均。 1-(EMA)指数移動平均。 SMMA 2-(SMMA)平滑化移動平均。 LWMA 3-(LWMA)線形加重移動平均。 適用= 0-適用価格。価格定数のいずれかにすることができます。 0

Hammering ハンマー は、任意の通貨ペアで機能するように設計された自動取引システムです。取引時には、多通貨モードと単通貨モードが使用されます。 取引の決定を行うために、EAは スロープ方向ライン インジケーターからのシグナルを使用します。 設定の説明。 Profit_Percent_AccountEquity = 0.4; -利用可能な資金のパーセンテージとしての利益のレベル Fix_AccountEquity = 0; -強制レベルの無料資金 FIX_PROFIT = 1000; -強制利益レベル 期間= 55; -指標期間。 FilterNumber = 2; -インジケーターフィルター。 ma_method = 3; -インジケーターの平均化方法。 apply_price = 0;インジケーターの使用価格です。 TF = 15; -インジケーターのチャート期間。 ペア= "EURUSD、GBPUSD、USDCHF、USDJPY"; -多通貨取引用の通貨ペアのセット。 MagicNumber = 6; -アドバイザーの注文ID TrailingStart = 9.5;

The product combines a manual trade panel with the ability to perform actions automatically in a highly configurable way. Actions include capturing indicator values and then based on those values raising alerts, open/close or partially close trades, scale-in, setting up pending orders, adjusting stop loss, take profit and more. On-chart controls can be configured, such as tick boxes and buttons, so can be fully interactive. The EA also handles money management, news events, hidden stop loss, tak

The ProfileVolumesMarket indicator calculates tick volume on each price level in a selected range. Volume is vital when determining strength and therefore significance of price levels. The calculation range is set by a trader by means of moving two vertical lines. Thus the indicator allows to track important levels on different steps of a symbol price formation. A histogram of volume profile can be displayed on the chart (or removed from the chart) if you press "ON" ("OFF") button. When you chan
Most of brokers make slippage for your orders (stop orders or market orders). When you make limit orders (Buy or Sell), they don't make slippage for you. Because it is for your advantage. This EA will resolve limit slippage problem for you with any brokers. Slippage Problem Example: The price now is 1.31450, you put sell limit at 1.31500. If the price jumps to 1.31550. The Broker will execute your sell limit at 1.31500 NOT 1.31550. If you put buy stop, the Broker will execute it at 1.31550 (or m
FREE
TrafficLight provides simple trading buy and sell signals. The indicator shows reversal points and ambiguous points on current chart using cross rates. Only completed bars are counted. Buys are denoted by green arrows, sells - by red arrows. Yellow diamonds denote bifurcation points. Distance to the arrows relatively to the current price is a measure of volatility on the cross rates, and can be used as future price movement estimate for the work symbol. Due to the fact that indicator is calculat
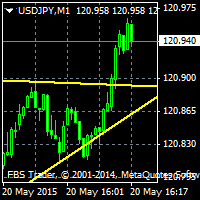
This Indicator will draw support and resistance (SR) in chart and give alert whenever there is a Support or Resistance Breakout. It has a variable to control SR line length (default 100) 500 is recommended. Support and resistance (SR) The concepts of support and resistance are undoubtedly two of the most highly discussed attributes of technical analysis and they are often regarded as a subject that is complex by those who are just learning to trade or even the expert traders. As we all know that

How To Determine If The Market is Strong Or Weak?
Strength Meter uses an Adaptive Algorithm That Detect Price Action Strength In 4 Important Levels! This powerful filter gives you the ability to determine setups with the best probability.
Features Universal compatibility to different trading systems Advance analysis categorized in 4 levels Level 1 (Weak) - Indicates us to WAIT. This will help avoid false moves Weak Bullish - Early signs bullish pressure Weak Bearish - Early signs bearish pre

The indicator displays the moving average of all periods on one chart. It shows the MA of a one step lower timeframe and all the MAs equal to and higher than it.
Parameters Period moving average - Moving Average period (default is 34); Used to calculate price - price used for the MA calculation (default is the average price = (high+low)/2); The averaging method - default is linear-weighted; Moving average shift - MA shift (default is 0). Just enter the MA calculation period and its parameters,

5TT Pivot Lines is a visual display of pivot lines. These are primarily support and resistance points with the 'Blue' Pivot Point. Pivot points are useful for determining key levels for entry or exits (setting targets and stop loss levels). Having these support & resistance lines visually displayed on the chart is very useful for intraday traders. 5TT Pivot Lines come with some user-friendly settings to decide if to display the lines or connectors on the chart Settings CandlesBack: This gives th

The indicator determines Dragon pattern. It is based on the zigzag. There is buffer 0 which has no color located in the Colors tab. You will see the zigzag if you set it to some color. The indicator draws an up arrow when it detects a pattern which assumes further upward movement of the indicator. Similarly, the indicator draws a down arrow when it detects a pattern which assumes further downward movement of the indicator. Parameters: Alerts - show alert when an arrow appears. Push - send a pus

TraderTool is a tool/panel that will help any trader to perform trades quickly and easily. The product has been developed with user friendliness and ease of use in mind. It has the ability to manage multiple types of orders, either placed by an Expert Advisor, or manually. It also allows you to place orders in a single click. You can add stop loss and take profit, initiate a trailing stop or start break even operation, and all these with the simple panel. With the advanced panel (you can call it
FREE
MetaTraderマーケットは、開発者がトレーディングアプリを販売するシンプルで便利なサイトです。
プロダクトを投稿するのをお手伝いし、マーケットのためにプロダクト記載を準備する方法を説明します。マーケットのすべてのアプリは暗号化によって守られ、購入者のコンピュータでしか動作しません。違法なコピーは不可能です。
取引の機会を逃しています。
- 無料取引アプリ
- 8千を超えるシグナルをコピー
- 金融ニュースで金融マーケットを探索
新規登録
ログイン