Guarda i video tutorial del Market su YouTube
Come acquistare un Robot di Trading o un indicatore
Esegui il tuo EA
hosting virtuale
hosting virtuale
Prova un indicatore/robot di trading prima di acquistarlo
Vuoi guadagnare nel Market?
Come presentare un prodotto per venderlo con successo
Nuovi Expert Advisors e Indicatori per MetaTrader 4 - 273

SwapTrader is a simple Expert Advisor for swap trading at the end of the day. The EA scans the current chart instrument and instruments specified in the settings, looking for the currency and order with the positive swap. It opens positions with positive swaps after user-defined time and then closes these positions after user-defined time as soon as the specified profit is reached. The EA trades the current currency and instruments listed in the settings.
Expert Advisor Settings SymbolsList - l
FREE

Sblocca la potenza delle informazioni sul volume reale con l'indicatore Candle Power Pro . Questo strumento dinamico acquisisce i dati del volume effettivo per ciascuna candela e li presenta come percentuale del volume totale. In tal modo, ti consente di discernere la lotta in corso tra acquirenti e venditori nel mercato. Candle Power Pro mostra la battaglia tra acquirenti e venditori come percentuale del volume totale, fornendo preziose informazioni sulle dinamiche di mercato. Puoi facilmen

L'indicatore EZT Trend ti mostrerà la tendenza, il pullback e le opportunità di ingresso. Sono disponibili filtri opzionali e tutti i tipi di avvisi. Vengono aggiunti avvisi tramite posta elettronica e notifiche push. Stiamo anche sviluppando un EA basato su questo indicatore, che sarà presto disponibile.
È un indicatore multifunzionale composto da due istogrammi di colore e una linea. È una rappresentazione visiva della direzione e della forza di un trend, inoltre troverai divergenze molte vo

Il Two MA Crossover è un potente sistema di notifica progettato specificamente per i trader che si affidano alla Moving Average Crossover Strategy . Questo indicatore completamente automatizzato funge da sistema di avviso completo, assicurandoti di non perdere mai un evento di trading cruciale. Invia notifiche al tuo dispositivo mobile, e-mail e visualizza avvisi pop-up con audio sul tuo computer, tutto quando rileva un crossover della media mobile in base ai tuoi parametri preferiti. Un

Correct market entries and exits are essential for any Forex trader. MasterArrow indicator addresses this issue. It has no redundant elements and draws only buy/sell arrows. The up arrow is a BUY signal, while the down arrow is a SELL one. The indicator is simple to configure. Change the Strength parameter to configure the signals frequency. The product is based on standard indicators (MA, RSI, ATR, etc.). But it also features the custom algorithm allowing to combine them into a single tool and

Con questa utility, cambiare la visibilità degli oggetti per i singoli oggetti non è mai stato così facile. Ciò contribuirà a eliminare il disordine che affligge i trader di MetaTrader 4 quando creano oggetti e quindi passano a un intervallo di tempo più alto e vedono che gli oggetti interferiscono con la visibilità del grafico. Per impostazione predefinita, ogni nuovo oggetto creato ha la visibilità impostata sull'intervallo di tempo corrente e inferiore. Questa impostazione può essere modifica

The robot works best on Н4 and opens trades only at the beginning of a week. It applies built-in parameters to define the price movement for the previous time period (last hours of the previous week, last weekday and last week) and opens contracts with the minimum take profit. I usually use the robot on 10 pairs with the minimum spread (for four-digit quotes): usdchf 3, gbpusd 3, eurusd 2, usdjpy 2, usdcad 3, audusd 3, eurjpy 3, nzdusd 4, eurgbp 3, gbpjpy 6. The EA features the predefined settin
This indicator is a free version of Double Top Tracker . Unlike the full version, some functions are disabled and the parameters cannot be changed. This indicator analyzes in parallel price charts for multiple currency pairs on all timeframes and notifies you as soon as a double tops or double bottoms pattern has been identified. The alert occurs when the the second peak has been reached. Double Top is a trend reversal pattern which are made up of two consecutive peaks that are more and less eq
FREE

Deals Utility is designed to manage any opened and pending order. It can handle orders by adding SL/TP, Trailing or Breakeven.
How to use Apply this Utility to any chart and set input parameters at your discretion. When you open any Market or Pending order, this utility adds SL/TP immediately. It will not process any order with magic number, so other EA's can work with this. It will manage Forex, Metal and Energy symbols. Other EA's can work with this because it will not handle any order with m
FREE

Displays multiple indicators, across multiple timeframes and symbols to give a comprehensive overview of the market. Uniquely, the indicators are configurable and can include custom indicators, even those where you just have the ex4 file or those purchased from Market. Standard indicators can also be selected, the default being ADX, CCI, market price above/below Moving Average (MA), Moving Average Cross (MAX), MACD, Momentum (MOM), OsMA, RSI, Parabolic SAR, William's Percentage Range (WPR). Use

Tarantula is a trend Expert Advisor that looks for entry points based on the standard Moving Average indicator. It works with two timeframes selected in the settings. The EA looks for the points of trend change and opens an order when the signal matches on different timeframes. All orders are protected by stop loss. However almost all orders are closed by the EA on a signal change.
Parameters SL - stop loss. TP - take profit. OnWork_1 - enable/disable searching for signals on the first timefram
FREE

This is an expanded version of the Time Levels indicator provided with sound alerts notifying of level intersection. The indicator is designed for displaying the following price levels on the chart: Previous day's high and low. Previous week's high and low. Previous month's high and low. Each of the level types is customizable. In the indicator settings, you set line style, line color, enable or disable separate levels. This version is provided with an option for alerting using an audio signal a

This Utility is a tool to manage level of profits or losses for each order without using stop loss or take profit. The Utility applies virtual levels to close orders in profit or loss. You can use the robot to manage manually opened orders or manage orders opened by another EA.
You can to get the source code from here .
Parameters OrdersManage - orders to manage (all orders of all symbols or orders on the current chart). Stop Loss Pips - virtual stop loss level. Take Profit Pips - virtual take
FREE

The indicator is designed for displaying the following price levels on the chart: Previous day's high and low. Previous week's high and low. Previous month's high and low. Each of the level types is customizable. In the indicator settings, you set line style, line color, enable or disable separate levels. The version of the exact same indicator but only with sound alerts there - Time Levels with Alerts .
Configurations ----Day------------------------------------------------- DayLevels - enable/
FREE
With this utility, switching the object visibility for individual objects has never been easier. This will help eliminate the clutter that plagues MetaTrader 4 traders when they create objects and then go to a higher timeframe and see that the objects interfere with the visibility of the chart. The demo version of Visibility Switch only works on the EURUSD currency pair. The full version of Visibility Switch can be found here. By default, every new object created has its visibility set to the cu
FREE

Market Sponge EA is a fully automated Expert Advisor based on the RSI indicator and a custom home made algorithm who constantly analyzes the market to determine the best times to place orders that are confirmed by the RSI. This one is fully parametrable which gives you a great control over what the EA can do. Use this EA on EURCHF with the default settings if you want to use it on another Symbol you will need to optimize parameters. Basic settings are optimized and I will update them every 6 mon

Optimizes the value of overbought and oversold on each new bar. This expert strives to choose the best values for a simple strategy where it sells when the indicator crosses below an overbought level and executes a buy when it crosses above an oversold level. The best overbought and oversold level is calculated on each new bar according to how that value would have performed during the optimizing periods which can be specified.
Inputs Unique number for this EA - can be any integer value. Optimi
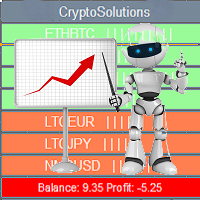
This indicator shows the current situation on the cryptocurrencies available for trading, depending on the signal strength specified in the settings. It can be used for determining the expected increase/decrease in the asset price, displayed by the corresponding color, and the signal strength, displayed by a vertical dash near a certain cryptocurrency pair. Indicator Parameters Panel color - color of the indicator panel Long color - cryptocurrency pair uptrend color Short color - cryptocurrency

TrendySignalMt4l is a trend-following indicator that quickly responds to a trend change. The indicator forms the line so that it is always located above or below the chart depending on a trend. This allows using the indicator both for a trend analysis and setting stop loss and take profit. The indicator should be attached in the usual way. It works on any timeframe from M1 to MN and with any trading symbols. The indicator has no configurable inputs.
Recommendations on working with the indicator
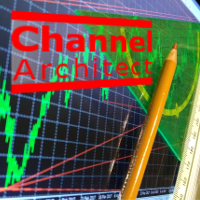
This indicator calculates and draws lines over the chart. There are two types of channels: Channel A: the mainline is drawn using local lows for uptrends and local highs for downtrends Channel B: the mainline is drawn using local highs for uptrends and local lows for downtrends The parallel lines of both types are built using the max. fractal between the base points of the mainline. There are a few conditions, which have to be fullfilled and can be changed by the parameters (see also picture 4):

"Still" is a trend-based Expert Advisor that looks for trend changes and opens orders in the direction of the new trend. The Moving Average indicator is used as the main signal supplemented by additional integrated confirmation functions. Whenever the signal changes, the opened orders are closed and a new order is opened. Stop levels are used for safety purposes. The EA is tied to the current timeframe. Recommended timeframes are H1 and M30. It can also work on M15 and M5. The recommended curren

This indicator displays the signals of the ADX indicator (Average Directional Movement Index) as points on the chart. This facilitates the visual identification of signals. The indicator also features alerts (pop-up message boxes) and sending signals to e-mail.
Parameters Period - averaging period. Apply to - price used for calculations: Close, Open, High, Low, Median (high+low)/2, Typical (high+low+close)/3, Weighted Close (high+low+close+close)/4. Alert - enable/disable alerts. EMail - enable
The Expert Advisor is based on Williams` Percent Range. The EA trades both during low volatility and a trend if MACD is enabled. Two Williams` Percent Range indicators can be used to enter a trade with different parameters, while the third one can be configured to close a trade. Besides, the EA has the trailing stop and stop loss calculation functions depending on the currency pair movement strength.
Inputs Lots - lot size (if 0, the lot volume is calculated based on the % of account free margi

LevelUP is a fully automated Expert Advisor trading robot. It applies cutting edge "Key level Break Out" strategy. Slippage and trade execution delay can’t be avoided for breakout trading system. However, LevelUP applies pending orders instead of market orders to improve those issues. Also, LevelUP implements algorithms for limiting its trading hours and you may specify the most effective trading hours based on your optimization. And there is trailing stop system to secure accumulated profits. W

Colored trend indicator advanced is a trend indicator that is based on Fast Moving Average and Slow Moving Average and also uses RSI and Momentum to give a trend strength in percent. It is aimed to find more healthy trends with this indicator. This indicator can be used alone as a trend indicator.
Colors (Default) Green = Uptrend (Default) Red = Downtrend No color = No trend, no good trend
Indicator Parameters WarnPosTrendchange: Warns you when the trend may change. FullColor: See screenshot.

Ti presentiamo Mr. Fibonacci , un incredibile indicatore progettato per semplificare il processo di disegno e regolazione dei livelli di Fibonacci sul tuo grafico. Questo indicatore offre eccezionali opzioni di personalizzazione per i trader professionisti, consentendo loro di tracciare con precisione qualsiasi livello di Fibonacci. Inoltre, fornisce notifiche mobili, avvisi e-mail e avvisi pop-up quando il prezzo entra nei livelli di Fibonacci, assicurandoti di non perdere mai potenziali op

Better Scroll abilita e disabilita la funzione AutoScroll di MT4 durante lo scorrimento, rendendo la funzione più intuitiva e conveniente. Non dovrai più abilitare e disabilitare manualmente AutoScroll o farti portare alla fine del grafico perché ti sei dimenticato di disattivarlo durante il backtest o guardando i dati storici sui prezzi. Riepilogo
AutoScroll è DISATTIVATO quando:
Clic del mouse + Trascina a sinistra (oltre la candela attualmente aperta) Rotellina del mouse Scorri a sinistra (o

STO Currency Strength Meter uses Stochastic Oscillator to monitor how strong a currency is, or in other words, if it's being bought or sold by the majority compared to the other currencies. It displays the strength-lines of the currencies of the pair (base and counter currencies of the chart) with changeable solid lines. Also, you can add up to five additional currencies to the "comparison pool". If you want to look and compare, for example, EUR, USD and JPY, it will only look at the EURUSD, USD

Introducing Early Morning Scalper ATR: Precision Trading During Asian Forex Market A breakthrough in forex trading automation, the Early Morning Scalper ATR Expert Adviser offers a fully autonomous solution meticulously engineered for a specific window of opportunity—the early hours of the Asian Forex market. At its core, this innovative tool employs an advanced algorithm that orchestrates forex trading seamlessly. Augmenting its prowess are sophisticated internal indicators, which deftly ident

Grid Expert Advisor with floating step. The strategy of this EA is based on the main idea of trading - "Buy Low & Sell High". Pending orders "slip" behind the price in order to open a buy or sell order at an optimal price. The EA has several tactical techniques to reduce the loss.
Features Grid Expert Advisors have a serious drawback. It consists in the fact that there is a high risk of the deposit drawdown as a result of imbalance in a large number of BUY or SELL orders. This EA contains prote

Features: Generates BUY / SELL Signals for easy to use: You do not need to read or understand market trend lines on indicators. Quantina Bitcoin Indicator shows a little Red Arrow for SELL and a little Green Arrow for the BUY entry points above- and under - the actual bars. (Green = Bullish Trend , Red = Bearish Trend). Measured Signal Strength also has written on the chart for advanced traders. Working on every known currency pairs: It's working on major-, minor-, and cross - pairs too. Also, Q

This long-term trading system works on 12 pairs and 4 timeframes . The Expert Advisor uses various trading systems, such as trend trading, counter-trend trading and others. This increases the chances of sustained growth and reduces exposure to a single pair or individual operations. The risk is tightly controlled.
/>
The EA has the built-in smart adaptive profit taking filter. The robot has been optimized for each currency and timeframe simultaneously. It does not need arrival of every tick and

Quantina Multi Indicator Reader can analyse up to 12 most popular and commonly used together indicators in seconds on any timeframe, on any currency pair, stocks or indices. On the chart panel you can easily read each indicators default meanings and also there is an Indicators Summary on panel.
Features 1 file only: Quantina Multi Indicator Reader is 1 file only. No need to install other indicators to work. It is using the built-in indicators from MetaTrader 4 terminal. Detailed Alert Message:

It is a fully automated trading Expert Advisor, whose algorithm is based on trading using pending orders at the high and low of the daily working channel. StopLoss and TakeProfit are set manually by the trader, which provides ample opportunities for Expert Advisor optimization. When the UseTrall function is enabled, the EA only uses TakeProfit without setting a fixed StopLoss level. Upon reaching the specified profit target level, the EA sets StopLoss at the specified NoLossLevel distance from t
FREE

iSTOCH in iMA is an indicator which applies the stochastic changes to the iMA. Changes are reflected by altering the moving average colors. It is a useful tool to see easily the upsides or downsides of the stochastic.
You can to get source code from here .
Parameters MA_Periods - iMA period. MA_Method - iMA method. K_Period - K line period. D_Period - D line period. Slowind - slowing. STOCH_MA_METHOD - averaging method for MA. PriceField - price (Low/High or Close/Close). STOCH_LevelUp - uptre
FREE

The Expert Advisor is based on a breakout strategy. Market entry signals are generated when the price crosses the border of a certain price range. We created the strategy using historical data with the 99.9% quality data over the past 15 years. We have selected highest-quality signals and eliminated low-quality ones. The EA performs technical analysis and takes into account only those breakdowns that show the best result. The EA uses filtration of false signals. It uses an adaptive trailing stop

Attention! Friends, since there have been many scammers on the Internet recently selling indicators called ForexGump, we decided to warn you that only on our page is the LICENSE AUTHOR'S VERSION of the INDICATOR sold! We do not sell this indicator on other sites at a price lower than this! All indicators are sold cheaper - fakes! And even more often sold demo versions that stop working in a week! Therefore, in order not to risk your money, buy this indicator only on this site!
Forex Gump Pro is

Overview It only needs a small initial deposit. Suitable for multi-currency trading. Immunity to the large delay and the size of the spread. Monitoring of my accounts : https://www.mql5.com/en/signals/author/mizrael
How it works After launching the EA on a chart, the EA remembers the first order's Open level. The EA sets a Sell order grid above it. A Buy order grid is set below it. If the total profit of Buy and Sell orders exceeds the value of the Profit parameter, the EA closes the order d
The Elize Expert Advisor has been designed to work with the EURCHF currency pair. It considers the peculiarities of this trading instrument, its behavior and dependence on the behavior of other currencies. In particular, when the currencies of the European countries (EURUSD, GBPUSD, EURNOK, EURCHF) move in the same direction, the EA starts its operation and opens a deal in the trend direction of the European currencies. In the event of price rollbacks, the EA uses a unique method for making the

L'indicatore Three MA Alert è uno strumento essenziale per i trader che si affidano alla Moving Averages Crossover Strategy . Semplifica la tua vita di trading inviando notifiche al tuo dispositivo mobile, e-mail e visualizzando avvisi pop-up con suono ogni volta che c'è un crossover di tre medie mobili. Seguendo questa tecnica ampiamente utilizzata, puoi assicurarti di essere sempre dalla parte giusta del trend ed evitare di fare trading contro la direzione prevalente del mercato. Con l
CCI Currency Strength Meter uses CCI (Commodity Channel Index) to monitor how strong a currency is, or in other words, if it's being bought or sold by the majority compared to the other currencies. If you load this indicator on a chart, it will first display the strength-lines of the currencies (base and counter currency of the chart) with changeable solid lines. Also, you can add up to five additional currencies to the "comparison pool," that already has the base and the profit (counter) curren

IMA Recover Loss is the expert advisor based on moving average and some technical indicators. This concept uses statistical tools that help in price analysis. By creating a trend line to find trading signals. This expert advisor has developed and improved the moving average to work well with current data and reduce delays. Long and Short Trade Signals: The method for using the Multiple Moving Average indicator is to trade a basic moving average crossover system using all of the MAs. This system

Requirement for the EA use: the EA needs a low spread (recommended spread value is 2) and minimum slippage! Systems that operate based on Bollinger waves signals are considered to be among the most popular well performing systems. This Expert Advisor belongs to such systems. In addition to Bollinger waves, the Expert Advisor uses the following indicators: Stochastic, RSI and Moving Average. Recommended Expert Advisor operation time is from 00:05 to 08:00 (the interval between the close of the A
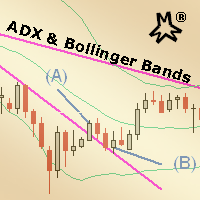
MMM ADX & Bollinger Bands strategy: This EA's strategy combines 2 built-in indicators to enhance its signals and decide to open a new order at the right time, there is an ADX indicator and you may choose its signal's strength and a Bollinger Bands indicator confirms the trends and a MA to check if the prices are deviating from its pattern. By joining both indicators' data and the moving average, it is possible to calculate quality signals, avoiding sudden market movements against your trading op
The EA is based on price crossing the High or Low of a Moving Average. Advance Fractal profit taking method. Advance stop management option based on explosive candles (Big Candles). Loss recovery system making recovery of losses easier. Configured the EA to match your trading style. Scalping, Swing Trading or Trend Trading. Three custom trailing stop options. Explosive candle stop management with partial closure. Advance fractal partial close profit taking Two indicator filters Time filter wit

ReviewCandleChart is a unique product that can verify past price fluctuations using candlestick charts. This indicator accurately reproduces market price fluctuations in the past and can make trading decisions (entries, profits, loss cut) many times so that you can learn the trading faster. ReviewCandleCahrt is the best indicator to improve trading skills. ReviewCandleCahrt caters to both beginners and advanced traders.
Advantages of the indicator This Indicator for verifying price fluctuation
FREE

ReviewCandleChart is a unique product that can verify past price fluctuations using candlestick charts. This indicator accurately reproduces market price fluctuations in the past and can make trading decisions (entries, profits, loss cut) many times so that you can learn the trading faster. ReviewCandleCahrt is the best indicator to improve trading skills. ReviewCandleCahrt caters to both beginners and advanced traders. Advantages of the indicator This Indicator for verifying price fluctuation u
This indicator analyzes in parallel price charts for multiple currency pairs on all timeframes and notifies you as soon as a double tops or double bottoms pattern has been identified.
Definition Double Top / Double Bottom pattern Double Top is a trend reversal pattern which are made up of two consecutive peaks that are more and less equal with a trough in-between. This pattern is a clear illustration of a battle between buyers and sellers. The buyers are attempting to push the security but are

Requirement for the EA use : the EA needs a low spread (recommended spread value is 2) and minimum slippage! Systems that operate based on Bollinger waves signals are considered to be among the systems with the best results and reliability. The Oblivion Expert Advisor also belongs to such systems. In addition to Bollinger waves, the Expert Advisor uses the following indicators: Stochastic and Moving Average. The EA does not use Martingale and grid systems! Recommended Expert Advisor operation t
FREE

Quantum Theory is a fully automated Expert Advisor based on the principle of scalping in the distribution of data in the sample and the distance between individual data points to the mean or average sample values. In Statistics, the data area between +/- 1 standard deviations will be 68.2%, the data area between +/- 2 standard deviations will be around 95.4%, and the data area between +/- 3 standard deviations will range from 99.7%. The Expert Advisor works with Stop loss, The Larry Williams Per

FX Master Expert Advisor opens positions at breakthroughs of support and resistance levels.
The EA trades during both trend and flat movements with no need to adjust parameters.
The EA uses the minimum stop loss (250 points) allowing the efficient use of funds and risk management.
Working timeframe: 1H
Recomended params for trading - all default values, excluding Filtration: AUDUSD=8, EURUSD, GBPUSD, USDCAD =12, USDCHF = 28
Note! Use "Every tick" mode when testing the EA!
Inputs Fix_Lot

Do you need detailed info from different magic numbers trading on the same account? This is your product. Detailed Magics, allows you to know profit, profit factor... of each magic number, so you will know which strategy is working best. Here are the specific information provided for each magic number: Profit. Number of trades. Profit factor. Expectancy (average pip per trade). Recovery factor (profit/drawdown). Max drawdown. Days that this magic number is trading on the account. Number of trade
The utility manages other EAs' orders as well as the ones opened manually. It is capable of trailing the price (trailing stop function), set a stop loss and take profit if they have not been set before. When configuring the utility for an EA having no trailing stop function, place it to the new window with the same currency pair specifying the same Magic value (as for the EA orders the stop loss is to be applied to). You can set any timeframe. It does not affect the utility operation. Set Magic
FREE

RCCMA is a general moving average indicator that works with ReviewCandleChart. Original is "Custom Moving Average" provided by MetaQuotes Software Corp. Based on that source code, I corresponded to ReviewCandleChart .
Advantages When ReviewCandleChart is ON, no line will be displayed on the right side from the vertical reference line. When ReviewCandleChart is ON and you press a key such as "Z" or "X" Following that, the MA is drawn. When ReviewCandleChart is OFF, the same drawing as the origin
FREE

This Expert Advisor is designed for use on all currency pairs on any timeframes. Candlestick analysis from different timeframes is used for opening positions. Positions are closed using the automated trailing system or by an opposite signal. The EA does not have input parameters affecting the trading algorithm. Timeframe: any (candlesticks from M15 to H4 are used) Currency pair: any (it is recommended to simultaneously use at least 4 major currency pairs).
Parameters LotSize - lot value paramet
The Expert Advisor generates trading signals based on the values of the FractalDivergence_Patterns indicator. A Buy signal is generated when the indicator detects a support level, and a Sell signal is generated when the resistance level is found (see Fig. 1: blue arrows show buying, red arrows show selling). The Expert Advisor does not require the indicator to be additionally used, and can display the appropriate support and resistance levels.
Parameters The "Fractal divergence parameters" bloc

Bollinger Bands are volatility bands plotted two standard deviations away from a simple moving average. Volatility is based on the standard deviation, which changes as volatility increases and decreases. The bands expand when volatility increases and narrow when volatility capturing 85%-90% of price action between the upper and lower bands.
How it Works Knowing that the majority of price action is contained within the two bands we wait for price to break out of either the upper or lower band an

The Expert Advisor is easy to use. The EA operating principle is to start active trading, to open several orders in different directions and to close them by averaging.
Advantages Easy to use. Reasonable price. Customer support. Works with any signal delay and any spread value. Trades using pending BuyStop and SellStop orders.
Recommendations It is recommended to stop the Expert Advisor operation during important news releases. The EA is recommended for use on one of the major currency pairs.
If you want to add a pattern indicator to confirm the market movement you are in the right place, this indicator permit to detect some famous candle patterns Hammer, Inverted Hammer, Shooting Star, Hanging Man and Engulfing patter that can be highlighted on your chart once the patters occurs. Up, Down arrows are traced at the beginning of the new bar each time a pattern is detected.
Parameters Body to Bar Fraction (%) : the body size / the candle size (20% by default) Max Little Tail Fraction (

The Expert Advisor trades using trendlines. You should draw a trendline on a chart. The name of the line should be in the following format: "Trendline" space digits. This is the default name used when a line is drawn on the chart, please do not change it. The EA supports two types of trading using the trendlines: a breakout strategy and a roll back strategy. A trade signal is generated on the last but one bar (the completed one), if its open price is below/above the trendline and its close price

Questo indicatore può inviare avvisi quando si verifica un cambiamento di colore Heiken Ashi Smoothed. Combinato con le tue regole e tecniche, questo indicatore ti permetterà di creare (o migliorare) il tuo potente sistema. Caratteristiche Può inviare tutti i tipi di avvisi. Possibilità di ritardare di una barra l'avviso per confermare il cambio colore (tendenza). Parametri di input Attendi la chiusura della candela: 'vero o falso'. Impostandolo su 'true' ritarderà l'avviso all'apertura de
FREE

This indicator is a proof of concept of pyramid trading strategy. It draws fibonacci level automatically from higher high to lower low or from lower low to higher high combinate with Pyramid Trading Strategy for better risk reward ratio. What is Pyramid Trading Strategy? The pyramid forex trading strategy is a something every forex trader should know about because it makes the difference between making some pips with some risk in only one trade or some pips with less the risk by applying the pyr
Key Features This application is designed to quickly place a pending order or open a position at market. The position volume will be calculated automatically according to the risk settings. This application also manages orders and positions. Everything is simple, you only need to specify the price of the order (or position by market) and stop loss. The type of the pending order is selected automatically depending on the logic of the relative location of the current price, pending order price and

The RightTrend indicator shows the direction of trend and reversal points (market entry and exit points). It is very easy to use: open BUY deal when the up arrow appears and open SELL deal when the down arrow appears. The indicator generates accurate and timely signals for entering and exiting the market, which appear on the current candle while it is forming. In spite of apparent simplicity of the indicator, it has complex analytic algorithms which determine trend reversal points.
Inputs stren
The indicator shows buy or sell on the screen when it catches a signal with its own algorithm. The arrows warn the user to buy or sell. Pairs: USDCHF, AUDUSD, USDJPY, GBPJPY, EURUSD, GBPUSD, EURCHF, NZDUSD, EURCHF and EURJPY. You can test the indicator and choose the appropriate symbols. The best results are on M30.
Parameters AlertsOn - send alerts AlertsMessage - send a message AlertsSound - sound alert
AlertsEmail - email alert Buy color - buy color
Sell color - sell color

This indicator draws Fibonacci level automatically from higher high to lower low or from lower low to higher high combinate with Pyramid Trading Strategy for better risk reward ratio. With adjustable Fibonacci range and has an alert function.
What is Pyramid Trading Strategy? The basic concept of pyramiding into a position is that you add to the position as the market moves in your favor. Your stop loss moves up or down (depending on trade direction of course) to lock in positions. This is how
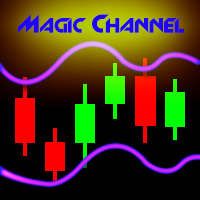
Magic Channel is a channel indicator for the MetaTrader 4 terminal. This indicator allows finding the most probable trend reversal points. Unlike most channel indicators, Magic Channel does not redraw. The alert system (alerts, email and push notifications) will help you to simultaneously monitor multiple trading instruments. Attach the indicator to a chart, and the alert will trigger once a signal emerges. With our alerting system, you will never miss a single position opening signal! You can t

Trend indicator. The indicator identifies the major price movement trends and market them with different colors. It filters out and ignores the noise and short-term movements of the price against the main trend. This indicator is a tool that identifies the current trend in the market. With the default settings, the ascending ("bullish") trends are marked with green lines and the descending ("bearish") trends are marked with red lines. The indicator ignored sideways or flat movements, when the pr
FREE

The indicator displays the key support and resistance levels on the chart. The significance of these levels lies in that the price may reverse or strengthen the movement when passing such levels, since they are formed as a consequence of the natural reaction of market participants to the price movement, depending on which positions they occupied or did not have time to occupy. The psychology of the level occurrence: there always those who bought, sold, hesitated to enter or exited early. If the

Take your trading to the next level with DFGX - our second generation Dynamic Fibonacci Grid. This new, powerful and easy to use application is specially designed and optimized for contrarian intraday trading, scalping and news trading on the Forex market. This system is the ideal solution for active professional traders and scalpers who are looking for innovative ways to optimize their strategy. The system also provides excellent opportunity for new traders who want to learn to trade in a syste
Il MetaTrader Market è il posto migliore per vendere robot di trading e indicatori tecnici.
Basta solo sviluppare un'applicazione per la piattaforma MetaTrader con un design accattivante e una buona descrizione. Ti spiegheremo come pubblicare il tuo prodotto sul Market per metterlo a disposizione di milioni di utenti MetaTrader.
Ti stai perdendo delle opportunità di trading:
- App di trading gratuite
- Oltre 8.000 segnali per il copy trading
- Notizie economiche per esplorare i mercati finanziari
Registrazione
Accedi
Se non hai un account, registrati
Consenti l'uso dei cookie per accedere al sito MQL5.com.
Abilita le impostazioni necessarie nel browser, altrimenti non sarà possibile accedere.