YouTubeにあるマーケットチュートリアルビデオをご覧ください
ロボットや指標を購入する
仮想ホスティングで
EAを実行
EAを実行
ロボットや指標を購入前にテストする
マーケットで収入を得る
販売のためにプロダクトをプレゼンテーションする方法
MetaTrader 4のための新しいエキスパートアドバイザーとインディケータ - 202
Ultimum Signal Indicator contains the most powerful buy,sell and exit signals. They can all be be separately turned on/off, so you decide what to display on the chart ! This is my ultimum inidicator that is a no-nonsense, no delay, no repaint indicator ! Signals : Target price levels :
Liquidity Pools (Liquidity voids, major supply/demand zones, and price discrepancies) Liquidity Pools Forecast Projection Market Reversals :
Reversal Blocks Pinbar groups Trend and mastertrend slowdowns (indicatin

The trading Expert Advisor's strategy is based on one of the most powerful technical analysis signals - the Pin Bar.
When determining this figure, a trading expert studies the current market situation and, if there is a combination of certain factors, it starts working.
It is recommended to start working with a small trading lot . As you become familiar with the work of an expert, the trading lot can be increased (use money management) to a psychologically acceptable size.
Attention : the fo
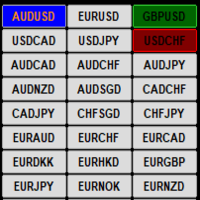
This indicator display current profit/loss status for each pair visually on a single chart. If the current open chart pair is selected and a trade/s are opened for that pair only the Symbol name is highlighted and the button color reflects the current trade/s status if the selected chart pair does not have any open trades then the button color is Blue. The input options are :
1/ Select Pairs automatically from the Market Watch
2/ Manually select your own Pairs
3/ Select all MT4 Timeframes aut

Ophiuchus is the 13th zodiac and it is also the name for this EA as 13 is the key elements for this trading strategy. Trading Strategy
The following are the main characteristic of this EA. Martingale based strategy. Only open more trades when it is on the right direction. earn small profit for each trades but a lot of volume everyday. Profit from the volatility of the market. Tested and Proved to be able to profit on EURUSD trading with M1 timeframe. Back Test Result
Back test result are a

Orions , an Expert Advisor, has implemented the best algorithms for trading from scalping and pipsing: filtering deals using the Gann and Elder methods from different time intervals when trading price momentum patterns from 5-minute charts of the instrument. This robot makes a lot of trades every month and filters out each of them using powerful analytical tools, but it is impossible to open so many trades per year and still not get a single losing day. If you do not agree with this, do not buy

The Vkids Trend indicator displays the trend direction with colored bars, works in a simple and visual way. It uses a combination of reliable and simple indicators for price analysis. The graph is presented in the form of blue and red histograms. Red bars indicate a buy signal, blue bars - a sell signal. The graph is not redrawn during operation.
The signals of the Vkids Trend indicator can be interpreted as follows: Buy when the bars are blue and sell when they are red. The advantage of the i

The strategy of the Expert Advisor is based on one of the strongest signals of technical analysis - Engulfing .
When determining this figure, a trading expert studies the current market situation and, if there is a combination of certain factors, starts working.
It is recommended to start working with a small trading lot . As you become familiar with the work of an expert, the trading lot can be increased (use money management) to a psychologically acceptable size.
Attention : the format of

The utility is designed to close and delete positions when the specified loss/profit values are reached in the currency/percentage of the Deposit. The chart displays a panel with information: profit/loss on the account, the number of open positions, and total positions in lots. Parameters: SHOW THE DASHBOARD - TRUE - Yes, FALSE - No. CURRENCY PAIRS - TRUE - All, FALSE-Current. STOP PROFIT IN $ OF THE DEPOSIT - Profit value in the Deposit currency. STOP LOSS IN $ OF THE DEPOSIT - Loss value in
FREE

Ultimate pattern builder Scanner (multi time frame and currency pair)
Allows you to build any pattern with up to 3 candlesticks. This Scanner is basically indicator with scanning feature, you can now create your own candlestick patterns and scan them in real time at any time frame and currency pair (stocks, energies, crypto...). Now you can use full potential of indicator in real time trading. If you dont know yet what is so special about this ultimate pattern builder software collection: it a

The Pushing Trend indicator implements a kind of technical analysis based on the idea that the market is cyclical in nature. The indicator tracks the market trend, ignoring sharp market fluctuations and noise around the average price. It fixes the trend and shows favorable moments of entering the market with arrows. AND
Working with the Pushing Trend indicator is quite simple. Look at the arrows and determine the direction of work. The indicator can be used not only to fix the trend direction

The Trend Priority indicator can be used for both short-term pips and long-term trading. Works on all currency pairs and on all timeframes. When using it is recommended to look at the additional indicator of a filter of possible false signals.
Indicator shows signals for input. Displays both entry points and the trend itself. Shows statistically calculated moments for entering the market by arrows. When using the indicator, you can optimally distribute the risk factor.
Settings: Uses all one

RealProfit Expert works on currency pair USDJPY only! The Expert doesn’t use any additional indicators to open transaction. Trade is based on important levels breakthrough. The Expert has minimum quantity of parameters, for this reason it is ready for work immediately after it has been installed. The absence of additional parameters provides the possibility to use the Expert easily even by beginners. The Expert is suitable for long term investments over 1 year. You should take into consideratio

Introduction
What should be the Lot Size of our next trade ? is a very common and an important question. We don't want to burn our account by placing higher lots or neither want less profit by placing small lots even when we have capacity to place a reasonable lot size. The Risk Lot Calculator is a simple and efficient small tool that will assist your trading and help you choosing lot size by risking your account balance of your own choice. It will tell you how much lot size will risk your how

Angry Bull Option Binary
This is a Binary Options robot, which contains 7 strategies, you can backtest it to check what the best strategies are Settings Initial Batch Value Dynamic Investment = If activated it will use an automatic lot according to its capital Balance ($) w/ backtest = Starting balance to backtest PorcRiscoInvestment = It will be the value of % for the automatic lot if it is activated Expiration (in minutes) = It will be the expiration time of orders in Binary Options Magic

Expert system Comets goes through the whole history and all currency pairs with one single setting. The more delay your broker has in the amount of the Internet channel, the higher you need to set stop loss, take profit, and trailing stop so that the server can process them at the required price and the lower the trading frequency will be.
Expert Advisor - works using sharp tick movements. The uniqueness of the Expert Advisor is that it can be run on any hourly period, on any currency pair and

The Dawn Trend indicator is not prone to redrawing or any other type of erroneous display. Sharp price fluctuations, as well as noise around average prices, are ignored.
Perhaps, trend indicators can be called the main ones, since classic trading involves looking for trends. Many classics of trading in financial markets have developed their systems specifically to search for market trends.
This indicator embodies the implementation of a trend indicator. Which fixes a certain direction of chan
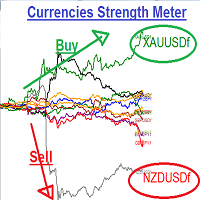
Currencies Strength Meters
:::: It is programmed to work on any M5 Chat windows !! Used to determine the Strongest currency pairs and the Weakest pairs also detect the peak of deviation of currencies strength IT CAN BE USED FOR INDICES AND STOCKS TOO !! Strategy one : It can be used in to BUY Strongest pair and SELL Weakest one Strategy two: It can be used on Daily basis to Hedge BUY Strongest pair with high % (ex: +1%) and BUY Weakest one with % lower(ex: -0.7%) the same with SELL Strategy t
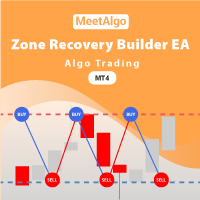
CAP Zone Recovery Strategy Builder EA MT4 is a another version of our Main Product CAP Zone Recovery EA. This EA is a strategy builder type EA has more then 34+ build in indicator that you can make more then 1 million combination strategy that boost you trading strategy. Also this Builder offers an incredible amount of functionality with zone recovery strategy. So you can test your strategy easy way without knowledge of coding. [ Installation Guide | Update Guide | Submit Your Problem
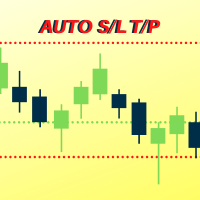
Number one rule to investing is to protect your capital. Never worry about trading without stop loss or take profit with Auto S/L T/P. Auto S/L T/P will automatically add your preset default stop loss and take profit to any order on the chart it's installed. Be sure to enable auto trading in order for the EA to work.
Entering a trade on the go from your mobile is breeze with Auto S/L T/P running on the chart on your desktop. Just enter a trade and your default stop loss and take profit will be
FREE

Signal indicator that displays price reversals from the upper and lower corners of the chart.
It is adjusted for different volatility and timeframes by one parameter - Gradation .
Works on any trading pairs. The recommended timeframe for use is from M15 and higher. Not redrawn. If necessary, I will help you choose the optimal setting.
Input parameters
Gradation - from 0 and higher. If the parameter is larger, arrows are displayed at shorter price intervals. Alerts for signals
Play sound - S

Utility for show on charts the visual informations about: - a vertical line at start of each bar of selected timeframe - a vertical line at start of each day - a vertical line at start of each week - vertical lines at start / end of trading sessions selected - bid / ask prices, spread, money value for each point (of 1 standard lot) and last tick time recived" You can enable / disable each information and set the color for each line
FREE

GBP INDEX
The Currency Index Project is ONE part of a thorough Forex study. Many people do not know the theoretical basis that drives currency exchange rates to move on the market. With this set of tools you will be able to have a more complete view of the entire market by analyzing not only the single currency of an exchange, but all the exchange rates that make up that currency by looking at a single window!
The indicator faithfully represents the real index of a single currency present in a
FREE

USD INDEX
The Currency Index Project is ONE part of a thorough Forex study. Many people do not know the theoretical basis that drives currency exchange rates to move on the market. With this set of tools you will be able to have a more complete view of the entire market by analyzing not only the single currency of an exchange, but all the exchange rates that make up that currency by looking at a single window!
The indicator faithfully represents the real index of a single currency present in a
FREE

EUR INDEX
The Currency Index Project is ONE part of a thorough Forex study. Many people do not know the theoretical basis that drives currency exchange rates to move on the market. With this set of tools you will be able to have a more complete view of the entire market by analyzing not only the single currency of an exchange, but all the exchange rates that make up that currency by looking at a single window!
The indicator faithfully represents the real index of a single currency present in a
FREE

NZD INDEX
The Currency Index Project is ONE part of a thorough Forex study. Many people do not know the theoretical basis that drives currency exchange rates to move on the market. With this set of tools you will be able to have a more complete view of the entire market by analyzing not only the single currency of an exchange, but all the exchange rates that make up that currency by looking at a single window!
The indicator faithfully represents the real index of a single currency present in a
FREE

AUD INDEX
The Currency Index Project is ONE part of a thorough Forex study. Many people do not know the theoretical basis that drives currency exchange rates to move on the market. With this set of tools you will be able to have a more complete view of the entire market by analyzing not only the single currency of an exchange, but all the exchange rates that make up that currency by looking at a single window!
The indicator faithfully represents the real index of a single currency present in a
FREE

Robot basado en indicadores para realizar operaciones de forma tendencial. Ideal para cuentas de cualquier capital, como un balance mínimo de 100$ Funciona con cualquier Timeframe. El bróker recomendado es Swissquote. Si desea utilizar el robot le recomendamos que se ponga en contacto con nosotros para asesorarle en la mejor configuración posible del sistema.
FREE

CAD INDEX
The Currency Index Project is ONE part of a thorough Forex study. Many people do not know the theoretical basis that drives currency exchange rates to move on the market. With this set of tools you will be able to have a more complete view of the entire market by analyzing not only the single currency of an exchange, but all the exchange rates that make up that currency by looking at a single window!
The indicator faithfully represents the real index of a single currency present in a
FREE

Utility for know all informations and settings of account where the platform is connected The informations that you can know are for example:
- The difference from server time and time of your PC
- The limit orders that you can place at market
- The credit that you have
- The stopout mode of your broker
- The exact name of company of your broker
and other informations
FREE

CHF INDEX
The Currency Index Project is ONE part of a thorough Forex study. Many people do not know the theoretical basis that drives currency exchange rates to move on the market. With this set of tools you will be able to have a more complete view of the entire market by analyzing not only the single currency of an exchange, but all the exchange rates that make up that currency by looking at a single window!
The indicator faithfully represents the real index of a single currency present in a
FREE

Script to calculate equity and balance at a specific date and time.
This script makes up for a lack of MetaTrader account history, that does not show how the balance and equity changes in time.
Balance calculation includes closed orders only.
Equity calculation includes orders closed before and orders that are still open at the specified time.
Example: date and time set to 2020/07/06 00:00. If I had a Buy 1 lot EURUSD position opened at price 1.12470 on the 2020/07/02, the program would ca
FREE
This is a brand new trend scanner for all of us that love to use different kinds of moving averages to define a trending market. This scanner is very useful and saves you a lot of time when you want to look for trending markets. In the scanner, you can choose to either use two different moving averages or three when defining a trend. Some like to use f. ex. the 50 EMA and the 200 EMA. If 50 is below 200 they will consider it a downtrend. Others like to use three moving averages. This can be e.
MA cross AKT (Traders Club)
機能: MAゴールデンクロスで買いサイン、デットクロスで売りサインを表示します。 MAの期間は入力できます。 MAの種類を選択できます。(SMA、EMA、SMMA、LWMA) 適用する価格を選べます。(CLOSE,OPEN,LOW,HIGH,MEDIAN,TYPICAL,WEIGHTED) サインをアラートで通知します。 サイン発生をE-mailやSNSで通知します。 MAクロスの勝率を表示します。 ローソク足の本数を変更することにより過去何か月かの MAクロスの勝率をすぐに確認することができます。 これは各時間足、各通貨で確認することが出来ます。 判定するローソク足を3か所選ぶことが出来ます。 ディフォルトでは5本目、9本目、14本目となっています。 サインの表示をボタンで表示したり消したりできます。 表示するサインを変更することが出来ます。

Happiness in Forex Means Winning! What if we made your winnings "Steady Winnings!" This will make you happier! (Forex is risky, you may loose all your capital)
We implemented a safe and reliable strategy, that proved itself since 2010 until today! It passed COVID 19 fluctuations without any issues!
The idea behind the expert to to be a super scalping expert, attacking few pips at a time. This happens while using big lot size, thus insuring handsome profit.
Expert entries are very selective, w

Utility for know the performance of your acoount. From dialog you can filter data in this modes: - You can include or not include the open positions
- You can include or not the closed positions
- You can filter the data by date (from, to)
- You can filter the data by simbols (multi selection)
- You can filter the data by magic number (multi selection) On bottom of table, are show the total of: - Number of data
- Total size
- Total commissions paid
- Total swap paids
- Total profits
- Total net
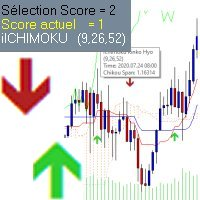
Indicator Ichimoku Arrows
to use with the Ichimoku indicator if you want to visualize. and very easy to use.
Use an arbitrarily chosen scale (to improve) to decide on the display or not of the signals according to their score. . the score takes into account -the positioning of the crossing of Kentan and kijun in relation to the cloud -if the chikou is above or below the course - the cloud trend. -the volatility of the movement. it is possible to select the display of the signals a

Hello Traders!
Behold the LightYear EA! The LightYear EA is about consistent profits and risk management. LightYear EA will protect your hard earned money and keep it consistently growing.
Symbols: Any Timeframe : M5(very important) Inputs: TakeProfitPips = Set TP pips(default is 15 pips) *spread/commission/swaps exclusive Startlot = Lot size TrailingStopLossPips = Trailing SL for unprecedented reversal TrailingStopLoss = Switch between on or off StopLossLevel = EA will automatically set SL, m

Money Pies.
Общие сведения:
Что бы начать торговать, большой депозит не требуется.
Идеально подходит для быстрого подъёма депозита.
Работает на мультивалютной торговле.
Иммунитет к длительной задержке и величине спреда.
Принцип работы:
После запуска на графике запоминает уровень открытия первого ордера.
Выше уровня открытия первого ордера, выставляет сеть ордеров на Sell.
Ниже уровня открытия первого ордера, выставляет сеть ордеров на Buy.
Если общая прибыль ордеров на покупку и на пр

The Nasbot Metatrader 4 Forex Robot is an algorithmic expert advisor that opens, exits and manages positions based on the Pivot Point cross overs. The logic that is used to define trade entries on The Nasbot EA is to buy when the Price Action is above the pivot. All timeframes will work on The Nasbot expert advisor but our preference falls on the 1- Hour chart. NOTE: The default settings in the EA should be left as is besides - inp33_Ro_Value Trade settings inp16_VolumeSize - This is the lot

Currency Strength Meter is the easiest way to identify strong and weak currencies. The indicator shows the relative strength of 8 major currencies: AUD, CAD, CHF, EUR, GBP, JPY, NZD, USD.
By default the strength value is normalised to the range from 0 to 100 for RSI algorithm: The value above 60 means strong currency; The value below 40 means weak currency;
The indicator is created and optimized for using it externally at an Expert Advisors or as a Custom Indicator inside your programs. For d

Ultimate No Nonsense FX Backtester - You can Run Forward Test Simulation with this tool! Do Not Download the Demo Here, Please Read Below!
Step by Step Manual Guide PDF for this backtester PDF List of Commands(Shortcuts) for this backtester
Ultimate NNFX Backtester is a powerful utility tool that significantly reduces the length of backtesting process for NNFX followers. As well as for Forex traders that operates their entries and exits at the close of a candle and manage the risk using ATR.

これはセミオートのEAで、どんなタイプの指標も使用せず、パラメータもシンプルです。
マスターオーダー(チャート上にアップロードした最初のオーダーを売買する)を含め、2つのリバースオーダーをヘッジに使用することができます。
マスターオーダー 初期注文と呼ばれるもの(SLにヒットすると、チャート上で再開するまでEAが取引を停止します)。
最初の逆指値注文。マスターオーダーと逆の注文を希望するピップ数だけ出します。
第二逆注文:第一逆注文の逆を希望するピップ数だけ開きます。
パラメータ
マスター取引の方向 - (最初の注文の方向、ロングまたはショート)
ロットサイズ - (あなたは、この電子は制御することができます3つの順序のすべての1つで異なるロットサイズを使用することができます)。
マスターに対して移動し、ピップ単位で反転トレードを開始 - (最初の反転注文が開かれるピップ距離)
2回目の逆張りを開始するために、逆張りに対して移動する - ( 2回目の逆張り注文が、1回目の逆張り注文に対して開くピップ距離 )
TPの後に再
FREE
This EA Utility allows you to manage (with advanced filtering) unlimited open orders (manual or EA) with 16 trailing stop methods: fixed, percent, ATR Exit, Chandelier Exit, Moving Average, Candle High Low Exit, Bollinger Bands, Parabolic, Envelope, Fractal, Ichimoku Kijun-Sen, Alligator, Exit After X Minutes or Bars, RSI and Stochastic. The trailing stop can be either real or virtual, and you can exit fully or with a partial close percent on touch or bar close.
Moreover, you can add (overrid

線形回帰の切片値と切片値に対称的な平均絶対偏差の表現。
パラメーター
•Periods:線形回帰を計算する期間の数
•Amplitude:バンドを定義するための絶対平均偏差の乗数
•Displacement:水平軸上の変位
•AppliedPrice:計算が行われる価格
•MainPlot:メインプロットの表示
•UpperPlot:上部バンドの表示
•LowerPlot:下部バンドの表示
価格が範囲内にある場合、移動平均は線形回帰にすぎないことに注意してください。ここでは、最もよく使用されるインジケーターの1つに対する線形回帰の利点がわかります。これは、価格がトレンドであるときに移動平均ではなく同じように調整されることです。
使用のための提案
•移動平均と比較して超高速なので、MainPlotは価格をより適切に表します
•バンドは、レンジだけでなくトレンドでも価格チャネルをより正確に定義します。これはスイング取引に最適です
•傾向を肉眼で視覚化するために使用できますが、価格の持続的な加速と減速も

Great smart dashboard for market analytics.
Using this dashboard you can: find signals from different indicators from all timeframes ; find signals from the Moving Average from all symbols ;
Include: 9 indicators (10 in Mt5 version); 27 signals (29 in Mt5 version); "Total" page.
Indicators and signals: MOVING AVERAGE MA cross Price - MA crosses Price; MA more/less Price - MA higher/lower Price; BOLLINGER BANDS BB crosses Price (in) - Price crosses Bollinger (upper/lower line) insid
This multi symbol indicator has been designed to automatically identify when price reaches major psychological levels. Also known as round numbers, whole numbers or key levels. As a bonus it can also scan for pivot point level on one selected time frame. Combined with your own rules and techniques, this indicator will allow you to create (or enhance) your own powerful system. Features Can write the signals to a file which can be used by an Expert Advisor for auto trading.
Can monitor all symbols
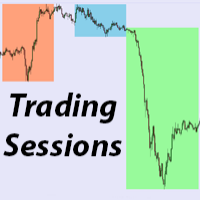
Trading Sessions 3
Description
Display the intra-day trading sessions from ASIA , LONDON and NEW YORK ASIA Session : Most volatile currencies AUD , NZD , JPY LONDON Session : Most volatile currencies GBP , EUR NEW YORK Session : Most volatile currency USD Inputs
Modifiable trading hours as HH:MM format
Custom days to display sessions
Note : GMT+3 = Helsinki Timezone
FREE
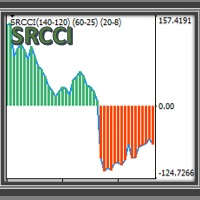
SRCCI An indicator based on RCCI , is a combination of the RSI and CCI indicators, adapted into three levels categorized into A, B and C. Taking advantage of their combination to maintain a controlled filter and applicable to different strategies. The RSI (Relative Strength Index) is one of the most popular and used oscillators to operate in the markets. It is a valuable tool to measure both the speed of price changes and the possible levels of overbought or overbought. The CCI (Commodity Channe

The Elephant Candle is an indicator for MT4. It draws arrows when strong bullish or bearish candles appear. Strong candles frequently initiate a new trend. The arrows can be used in expert advisors. This indicator can improve already existing trading strategies. The indicator is very fast and doesn't repaint.
Inputs Period Candle Multiplier Candle Niceness [%] Arrow Size Enable Alert Enable Push Notification Enable Email

Compatible with the rules of the NFA, CFTC and FCA regulators. Principle of operation The EA's algorithms are based on the method of amplitude-phase modulation of signals of different timeframes. The EA has a block structure and the ability to add an unlimited number of algorithms for open and close.
Main advantages Attention! Before starting, be sure to download the preset files - given at the end of the description.
Advisor Launch it works in the mode of opening minute candles, which allo

Introduction
This will calculate the risk taken only on EURUSD on going trades (both market order or pending) in dollar or euro. The risk is depending upon the lot size and stoploss you choose for the trade. Trades it consider
Only EURUSD Types of Trades
Direct Market order Pending Trades Please note Customization is also available for the function. For more details feel free to contact.
FREE

Indicator for binary options arrow is easy to use and does not require configuration works on all currency pairs, cryptocurrencies buy signal blue up arrow sell signal red down arrow tips do not trade during news and 15-30 minutes before their release, as the market is too volatile and there is a lot of noise it is worth entering trades one or two candles from the current period (recommended for 1 candle) timeframe up to m 15 recommended money management fixed lot or fixed percentage of the depo

Introduction
News is basic requirement for trading now a days. Due to its biased impact on the market a trader should be proactive to deal such scenarios before they arises. In this news alert indicator you have multi currency option to scan news for different pairs and notify you on Telegram, email, mobile push notification and chart alert. You can turn on/off any of the alert you need. It has two different option one is alerting you X min (user input) before the news and second is alerting you

This tool was developed and designed for binary options trading It has been noticed that it can also be used in stock markets and forex. There are 2 options for trading binary options using this indicator Option 1 We open a deal on the next candle after a signal for one cut of the current period Buy or Sell depending on the signal The blue up arrow is Buy The red down arrow is Sell / We enter only on the first signal on the next candle and ignore the rest / Option 2 We enter on a signal for the

Ultimate pattern builder Expert Advisor (case B)
Allows you to build any pattern with up to 3 candlesticks (+ special fourth). This EA is upgrade from indicator because you can now create your own trading scenarios and test it as much as you want. Everything that you test in strategy tester can be also done live at auto trading. If you dont know yet what is so special about this ultimate pattern builder software collection: it allows you to create any pattern you want, by modifying body and b

Ultimate pattern builder Expert Advisor (case A)
Allows you to build any pattern with up to 3 candlesticks (+ special fourth). This EA is upgrade from indicator because you can now create your own trading scenarios and test it as much as you want. Everything that you test in strategy tester can be also done live at auto trading. If you dont know yet what is so special about this ultimate pattern builder software collection: it allows you to create any pattern you want, by modifying body and b

Hello This Indicator will draw Green (Up) and Red (Down) small arrows from Multi TimeFrames based in ( Moving Average) to help you to take decision to buy or sell or waiting If there 4 green arrows in same vertical line that's mean (Up) and If there 4 Red arrows in same vertical line that's mean (Down) and the options contain (Alert and Mobile , Mail Notifications). Please watch our video for more details https://youtu.be/MVzDbFYPw1M and these is EA for it https://www.mql5.com/en/market/produc

Hello This Indicator will draw Green (Up) and Red (Down) small arrows from Multi TimeFrames based in ( MACD ) to help you to take decision to buy or sell or waiting If there 4 green arrows in same vertical line that's mean (Up) and If there 4 Red arrows in same vertical line that's mean (Down) and the options contain (Alert , Mobile and Mail Notifications). Please watch our video for more details https://youtu.be/MVzDbFYPw1M and these is EA for it https://www.mql5.com/en/market/product/53352

This indicator is SO SIMPLE… when the green Rise Coming arrow appears, a price drop may be on the way! Plain and easy profits! As you receive more than one 'Rise Coming' text signal in a downtrend, it means momentum is building larger for a bull run. HOW TO USE 1. When the green "Rise Coming" text appears, a price jump may be on the way! This indicator Never Repaints! To get the best setting it's a matter of tweaking the indicator until it gives you the best results. Our recommendation, and what

Live results: - Click Here .
- Click Here .
Manual File: you can find it Here in Telegram Group .
What's new ... Click Here . Set files ... Click Here .
By using Dolphin Expert you open a lot of new possibilities to your trading. It has a lot of customization and flexibility that no other expert in the markets offers!
You can choose the strategy based on rules or sequence of rules you define than assign this rules to enter 1st order or/and enter cooling orders or/and enter boosting order
The automatic trading system PowerATR works on the basis of detecting the determination of the price out of its "usual" range for a certain period of time.
At this moment, the expert evaluates the width of the price channel, the strength of the trend, and the distance traveled by the price in excess of the "normal" trading zone.
After opening the first order, the EA monitors further price behavior - if the movement continues - it averages the position and brings the probable level of profit t
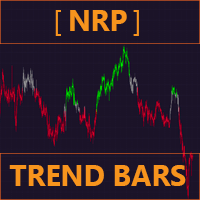
NRP Trend Bars
Your all-in-one Trend direction indicator, with Presets and Customisable options ! Get the most of Trends with NRP (No-repaint indicator) Trend Bars , designed to get the best of Trend Entries , Continuations and Reversals
One of it's function is the detection of the new trend starting , consolidation and possible trend change . It gives you the opportunity either to get in-&-out of the market in time
PRESETS (Sensibility)
LOW : Used for trend entries and confirming

Profits are on the way! This indicator is SO SIMPLE… when the red Drop Coming arrow appears, a price drop may be on the way! When more than one "Drop Coming" signal appears on a bull run, that means the drop is getting closer. HOW TO USE 1. When the red "Drop Coming" arrow appears, a price drop may be on the way! To get the best setting it's a matter of tweaking the indicator until it gives you the best results. Our recommendation, and what our traders do is open their chart and move the input n

You’ll love how you can receive alerts to your email and SMS when the candles turn green or red signifying the best buy and sell times in correlation to confirmed uptrends and downtrends. TO USE 1. Buy when green candles appear - this represents an uptrend. 2. Sell when red candles appear - this represents a downtrend. EXTRA FEATURE This indicator NEVER repaints so when a candle closes, that color is final. Also, the blue trend lines in the photos are not included, this is to demonstrate the pri
Time Line (Traders Club)
機能: 昨日高値、安値、本日始値、高値、安値の時間から線を引きます。 時間足により表示する時間が変わります。 1分、5分足では1時間ごとの表示 15分、30分足では4時間ごとの表示 1時間、4時間は12時間ごとの表示 日足以降は時間は表示されません。 高値安値は週足より下位足で表示されます。 各ラベルを変更可能になります。 更新頻度を変更できるのでチャート表示が 重くなることはありません。
各パラメータの説明: Difference hours form Server Time: サーバとの時間差を入力します。 Yesterday High Label:昨日高値のラベルを設定します。 Yesterday Low Label:昨日安値のラベルを設定します。 Show open line:true 始値の線を表示するかどうか Today Open Label:本日始値のラベルを設定します。 Today High Label:本日高値のラベルを設定します。 Today Low Label:本日安値のラベルを設定します。 Lim

特徴: このツールはDOWやNIKKEIなど500や1000ポイントがラウンドナンバーの 指数を取引する際に表示するように開発しました。 もちろんメジャー通貨でも表示はされます。
更新頻度を制限しているのでチャート表示が遅くなるということは ありません。
XMでDOWを取引される場合、Main Levelsを10000 Sub Levelsを5000にしてください。
各パラメータの説明: Number to display lines:表示するライン数を設定します。 Main Levels:メインレベルをポイントで指定します。 Main Line Color:メインラインの色を設定します。 Main Line Style:メインラインで使用されるラインを設定します。 Show Sub Lines:サブラインを表示するか設定します。 Sub Levels:サブレベルをポイントで指定します。 Sub Line Color:サブラインの色を設定します。 Sub Line Style:サブラインで使用されるラインを設定します。 Update Frequency(600
FREE

Robot de trading desarrollado para cuentas que inician desde un capital pequeño. Realiza operaciones que están un tiempo mínimo abiertas y con un riesgo pequeño en cada operación. Se debe usar en principalmente en gráficas en M1.
El broker recomendado para operar es Swissquote. En caso de requerir un prueba sin coste póngase en contacto conmigo y le ofreceré las posibilidades de utilizarlo.
Wouldn’t you love a heads up alert when the market is switching from bullish to bearish momentum? When the background turns green, there is your signal to place a long trade to increase your profitability. Also, when the background turns red, guess what? It’s time to go short for profits. HOW TO USE 1. When the background turns green, this is the best place to take long trades. This also represents a bull market. 2. When the background turns red, this is the best place to take short trades. This

You’re going to love this! We have coded in the ability for you to be alerted by email or SMS when the Green Buy Line crosses below the Red Stop-loss line signaling a sell. And to take it one step further to increase your profits, we coded in the ability for you to be notified with the Price crosses down below the Green Buy Line or below the Red Stop-loss Line to give you earlier exit opportunities. HOW TO USE 1. Buy when the green buy line crosses above the blue trend line. You can also buy whe

Strategy is based on short-term moving average analysis with the D1,H1 overview and M5 for entry and exit in every position. It is a combination of volume management and powerful trading techniques. The trading system is suitable for experienced traders. The EA allows you to trade with a fixed or automatic lot size. Recommended: Recommended timeframe is M5. Minimum account balance: $200. Default parameters are for EURUSD M5 . Features: The EA is not sensitive to spread or broker, you may ch
MetaTraderプラットフォームのためのアプリのストアであるMetaTraderアプリストアで自動売買ロボットを購入する方法をご覧ください。
MQL5.community支払いシステムでは、PayPalや銀行カードおよび人気の支払いシステムを通してトランザクションをすることができます。ご満足いただけるように購入前に自動売買ロボットをテストすることを強くお勧めします。
取引の機会を逃しています。
- 無料取引アプリ
- 8千を超えるシグナルをコピー
- 金融ニュースで金融マーケットを探索
新規登録
ログイン